. 2016 May;6(5):516-31.
doi: 10.1158/2159-8290.CD-15-1183. Epub 2016 Jan 25.

Tumor Cell-Driven Extracellular Matrix Remodeling Drives Haptotaxis during Metastatic Progression

Affiliations

Tumor Cell-Driven Extracellular Matrix Remodeling Drives Haptotaxis during Metastatic Progression

Madeleine J Oudin et al. Cancer Discov. 2016 May.

Abstract

Fibronectin (FN) is a major component of the tumor microenvironment, but its role in promoting metastasis is incompletely understood. Here, we show that FN gradients elicit directional movement of breast cancer cells, in vitro and in vivo Haptotaxis on FN gradients requires direct interaction between α5β1 integrin and MENA, an actin regulator, and involves increases in focal complex signaling and tumor cell-mediated extracellular matrix (ECM) remodeling. Compared with MENA, higher levels of the prometastatic MENA(INV) isoform associate with α5, which enables 3-D haptotaxis of tumor cells toward the high FN concentrations typically present in perivascular space and in the periphery of breast tumor tissue. MENA(INV) and FN levels were correlated in two breast cancer cohorts, and high levels of MENA(INV) were significantly associated with increased tumor recurrence as well as decreased patient survival. Our results identify a novel tumor cell-intrinsic mechanism that promotes metastasis through ECM remodeling and ECM-guided directional migration.

Significance: Here, we provide new insight into how tumor cell:ECM interactions generate signals and structures that promote directed tumor cell migration, a critical component of metastasis. Our results identify a tumor cell-intrinsic mechanism driven by the actin regulatory protein MENA that promotes ECM remodeling and haptotaxis along FN gradients. Cancer Discov; 6(5); 516-31. ©2016 AACR.See related commentary by Santiago-Medina and Yang, p. 474This article is highlighted in the In This Issue feature, p. 461.


Figures

Figure 1
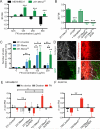
Figure 1. Mena-driven haptotaxis in vitro on FN gradients in 2D and 3D is dependent upon its direct interaction with α5 integrin and F-actin
A) Schematic diagram of a microfluidic device used for 2D or 3D haptotaxis, representative image of a FN gradient in a collagen gel, and a diagram describing the FMI used to quantify haptotaxis. B) Expression of Mena, but not VASP or EVL, in MVD7 fibroblasts drives haptotaxis on a 2D FN gradient (125μg/ml at top of gradient), as measured by the FMI. C) 231-Mena cells haptotax when plated on a 2D FN gradient (125μg/ml at top of gradient), but not on a LN or VN gradient, as measured by the FMI. D) MDAMB231 cells 231-Mena cells plated in a 3D collagen gel and subjected to increasing concentrations of FN at the top of the gradient. E) Inhibition of α5β1 with P1D6 (0.5μg/ml) blocked Mena-driven haptotaxis in 3D collagen gels, as measured by FMI, while inhibition of αvβ3 with Cilengitide (1μM) had no effect. F) Diagram of structure of Mena and its domains, including the LERER domain and the F-Actin binding domain (FAB). Deletion of the LERER domain abrogates the interaction of Mena/MenaINV with α5. G) 231-MenaΔLERER and MenaΔFAB cells did not haptotax in 3D collagen gels and this effect was independent of an effect on velocity (μm/min) (H). For each experiment, n=3 experiments, at least 80 cells tracked per condition. Results show mean ± SEM, significance by one way ANOVA, *p<0.5, **p<0.01, ***p<0.005. See FigS1.
Figure 2
Figure 2. MenaINV-drives haptotaxis at high FN concentrations in vivo and in vitro
A) 231-MenaINV cells plated in a 3D collagen gel and subjected to increasing concentrations of FN at the top of the gradient B) Inhibition of α5 with P1D6 (0.5μg/ml) blocked MenaINV-driven 3D haptotaxis, as measured by FMI, while inhibition of αvβ3 with Cilengitide had no effect. 231-MenaINVΔLERER or 231-MenaINVΔFAB did not haptotax in 3D. (n=3 experiments, ≥150 cells tracked per condition). C) In vivo invasion assay into needles inserted in tumors generated in NOD/SCID mice with MDAMB231 cells expressing Control-GFP, Mena or MenaINV. Needles contained 0.5mg/ml collagen and increasing amounts of FN (n=4 mice per condition). Results show mean ± SEM. Stars above columns represent significance relative to collagen only by one-way ANOVA. D) Representative image of a FN gradient (Rhodamine-labeled FN, shown in red) on collagen fibers (shown in white) generated using a microscale implantable device implanted into the tumor (tumor cells labeled with GFP shown in green) and visualized by intravital imaging. Scale bar is 100μm. FMI of E) MDAMB231 and F) SUM159 tumor cells expressing different Mena isoforms in the absence of a device, or in the presence of a device releasing fluorescently labeled FN or similarly sized Dextran (data pooled ≥8 movies from ≥2 mice per condition). Results show mean ± SEM, significance by one way ANOVA, *p<0.5, **p<0.01, ***p<0.005. See FigS2.
Figure 3
Figure 3. MenaINV is associated with poor outcome in human tumors and requires its interaction with α5 integrin for metastasis
Kaplan-Meier curves for survival of breast cancer patients binned by quartiles of Mena (A) or MenaINV (B) mRNA levels, as indicated (Q1 had the highest expression, Q4 the lowest). Data are from 128 breast cancer cases with >10 years of follow up BRCA TCGA dataset (data from entire 1060 patient cohort in Figs S3A-D). Significance calculated by log-rank Mantel-Cox test, hazard ratio calculated by logrank test, pTrend calculated by log-rank test for Trend (see methods). C) COX regression carried out to assess the relationship between Mena or MenaINV and time to death in breast cancer patients (patients with 10-year follow-up). D) Logistic regression carried out to assess the relationship between Mena or MenaINV and survival in breast cancer patients (patients with 10-year follow-up). E) Representative images of PyMT-MMTV tumors stained for Mena (red) and MenaINV (green) Scale bar = 20μm. F) Representative images of PyMT-MMTV stained for MenaINV (green) and integrin α5 (red) Same scale as E. G) Representative image from a wild-type PyMT tumor FN (red), MenaINV (green) and nuclei (DAPI staining) Scale bar = 100μm. H) Correlation between MenaINV and collagen FN intensity. Data from over 50 fields from 4 PyMT mice, each dot represents an individual field. I) Representative image of tumor spot from a tissue microarray with high levels of MenaINV (green) and FN (red). J) Correlation between FN and MenaINV staining in the entire patient cohort. K) MenaINV expression in 300 breast cancer patients comparing patients with or without recurrence, data shows mean +/− SEM. L) Table showing the median recurrence-free time in months and corresponding p-value in patients with high vs. low MenaINV, high vs., low FN or high vs. low MenaINV+FN. Significance calculated by log-rank Mantel-Cox test. M) Representative fluorescence images of GFP-positive metastasis in lungs of mice with 231-Control, Mena or MenaINV tumors. Scale bar = 50μm. N) H&E images of FFPE sections cut from the lungs of mice bearing MDAMB231 tumors expressing different Mena isoforms. Scale bar is 100μm. O) Lung metastatic index of NOD-SCID mice bearing tumors grown from MDAMB231 cells expressing different GFP-tagged Mena isoforms and measuring at least 1 cm in diameter (n≥4 mice per cell line). Data show mean ± SEM, significance by one way ANOVA, *p<0.5, **p<0.01, ***p<0.005. See FigS3 and S4.
Figure 4
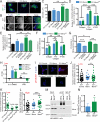
Figure 4. MenaINV drives haptotaxis via increased FX signaling
A) Representative images of 231-Control, Mena and MenaINV cells plated on FN and collagen, stained with antibodies to α5, and GFP (to visualize tagged GFP-Mena or GFP- MenaINV) and with phalloidin to visualize F-actin. Scale bar = 5μm. B) Magnification of inset shown in (A). Scale bar = 1μm. C) Quantification of cell area (in μm2) of MDAMB231 cells expressing different isoforms when plated on collagen (0.1mg/ml) + FN (50μg/ml). D) Number of α5-positive adhesions relative to cell area for 231-Mena and 231-MenaINV cells for cells plated on collagen only, collagen (0.1mg/ml) + FN (50μg/ml), and in the presence of P1D6, α5-function blocking antibody. E) Number of α5-positive adhesions relative to cell area for cells plated on collagen + FN. F) Intensity of α5 signal in Mena-positive adhesions (as counted by GFP positivity) for 231-Mena and 231-MenaINV cells plated on collagen only, collagen (0.1mg/ml) + FN (50μg/ml), and in the presence of P1D6, α5-function blocking antibody. G) Intensity of α5 signal in Mena-positive adhesions (as counted by GFP positivity) in cells plated on a low 2D 125 μg/ml FN gradient. H) Inhibition of FAK (0.5μM) decreased MenaINV-driven 2D haptotaxis on a low 2D 125 μg/ml FN gradient. Data from ≥3 experiments, with ≥80 cells tracked per condition. I) Representative images of 231-Control, Mena and MenaINV, 231-MenaΔLERER and MenaΔFAB cells plated on a low 2D 125 μg/ml FN gradient, stained with pFAK397 (red) and Phalloidin to visualized F-actin (blue). Scale bar = 5μm. J) Quantification of pFAK Y397-positive adhesions in 231-Control, Mena or MenaINV, while plated on a 2D low 125 μg/ml FN gradient K) 231-MenaINVΔLERER or 231-MenaINVΔFAB cells had decreased number of pFAK Y397-positive adhesions on a 2D low 125 μg/ml FN gradient. L) Quantification of pFAK Y397-positive adhesions in 231-Control, Mena or MenaINV, while plated on a 2D high 500 μg/ml FN gradient Data pooled from 3 experiments, with at least 30 cells analyzed per condition. M) Representative image of a WB for α5-immunoprecipitation from 231-Mena and 231-MenaINV lysates, probed for Mena, α5 and Tubulin. N) Quantification of fold increase in Mena pulled down in α5-IP, n=4. For all staining experiments, data pooled from at least 3 experiments, with at least 10 cells analyzed per experiments. Results show mean ± SEM, significance by one way ANOVA, *p<0.5, **p<0.01, ***p<0.005. Stars above data set represent significance relative to control. See FigS5.
Figure 5
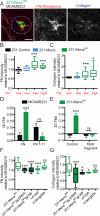
Figure 5. MenaINV-dependent directional motility requires ECM reorganizationin vitro
A) Representative images of MDAMB231 cells (outlined in white) and 231-MenaINV cells (green) in a 3D 125μg/ml FN gradient (red) in a collagen gel (blue) in merged image; middle and right panels show grayscale images of FN and Collagen alone, respectively. Scale bar is 25μm. 231-MenaINV showed increased accumulation and reorganization of B) FN and C) Collagen, in both low 125μg/ml and high 500μg/ml 3D FN gradients. D) A gradient of recombinant 7-11 domains of FN failed to induce 3D haptotaxis of 231-MenaINV cells, as measured by the FMI E) Inhibition of FN fibrillogenesis by inclusion of a 70kD fragment ablated MenaINV–dependent haptotaxis in 3D FN gradients (n=3 experiments, ≥80 cells tracked per condition). Deletion of the FAB and LERER regions in MenaINV, and inhibition of α5β1 with P1D6, but not Cilengitide, reduced collagen (F) and collagen (G) accumulation at low FN concentrations. Data from ≥3 experiments, with ≥30 cells analyzed per condition. Results show mean ± SEM, significance by one way ANOVA, *p<0.5, **p<0.01, ***p<0.005. See FigS6.
Figure 6
Figure 6. MenaINV drives collagen reorganization in tumors
A) Representative image from a wild type and Mena −/− PyMT tumor showing collagen as imaged by SHG (gray) and nuclei (DAPI staining). Scale bar = 100μm. B) Quantification of collagen signal as measured by SHG signal in wild type and Mena −/− PyMT tumors. Data from over 30 fields from 4 mice for wild-type mice and 2 mice for Mena −/−, each dot represents an individual field. C) Representative image from a wild-type PyMT tumor showing collagen as imaged by SHG (gray) and MenaINV (green). Scale bar = 100μm. D) Correlation between MenaINV and collagen intensity. Data from over 50 fields from 4 mice, each dot represents an individual field. E) Representative images showing collagen by SHG from a breast cancer patient samples with high or low MenaINV. F) Collagen intensity in 30 patients with high or low MenaINV expression. G) Representative images of collagen organization (gray) of 231-Control, Mena and MenaINV xenograft tumors taken by intravital imaging. Scale bar is 100μm. H) Representative diagram of angle used to measure the orientation of individual collagen fibers relative to the edge of the tumors. Plotted distributions of collagen fiber orientation relative to tumors edge comparing Control, Mena and MenaINV expressing H1) MDAMB231 and H2) SUM159 cells. Data pooled from ≥15 images from ≥4 mice per condition. Results show mean ± SEM, significance by t-test, *p<0.5, **p<0.01, ***p<0.005. See Fig S6
Figure 7
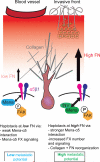
Figure 7. Summary diagram
FN levels are high around blood vessels and at invasive edges in tumors. Expression of Mena in tumor cells allows cells to haptotax on low gradients of FN, via its weak association with α5 and increased FX signaling. Expression of MenaINV allows cells to haptotax on both low and high FN gradients via increased association with α5, leading to increased FX number and FAK signaling at FXs, as well as through ECM reorganization.

Comment in

References

    1. Joyce JA, Pollard JW. Microenvironmental regulation of metastasis. Nat Rev Cancer. 2009;9:239–52. - PMC - PubMed
    1. Pickup MW, Mouw JK, Weaver VM. EMBO Rep. Vol. 15. EMBO Press; 2014. The extracellular matrix modulates the hallmarks of cancer. pp. 1243–53. - PMC - PubMed
    1. Naba A, Clauser KR, Lamar JM, Carr SA, Hynes RO. Extracellular matrix signatures of human mammary carcinoma identify novel metastasis promoters. Elife. 2014;3:e01308. - PMC - PubMed
    1. Conklin MW, Keely PJ. Why the stroma matters in breast cancer: insights into breast cancer patient outcomes through the examination of stromal biomarkers. Cell Adh Migr. 2012;6:249–60. - PMC - PubMed
    1. Conklin MW, Eickhoff JC, Riching KM, Pehlke CA, Eliceiri KW, Provenzano PP, et al. Aligned collagen is a prognostic signature for survival in human breast carcinoma. Am J Pathol. 2011;178:1221–32. - PMC - PubMed

Publication types

MeSH terms