

Genomic reconstruction of the history of extant populations of India reveals five distinct ancestral components and a complex structure
- PMID: 26811443
- PMCID: PMC4760789
- DOI: 10.1073/pnas.1513197113
Genomic reconstruction of the history of extant populations of India reveals five distinct ancestral components and a complex structure
Abstract
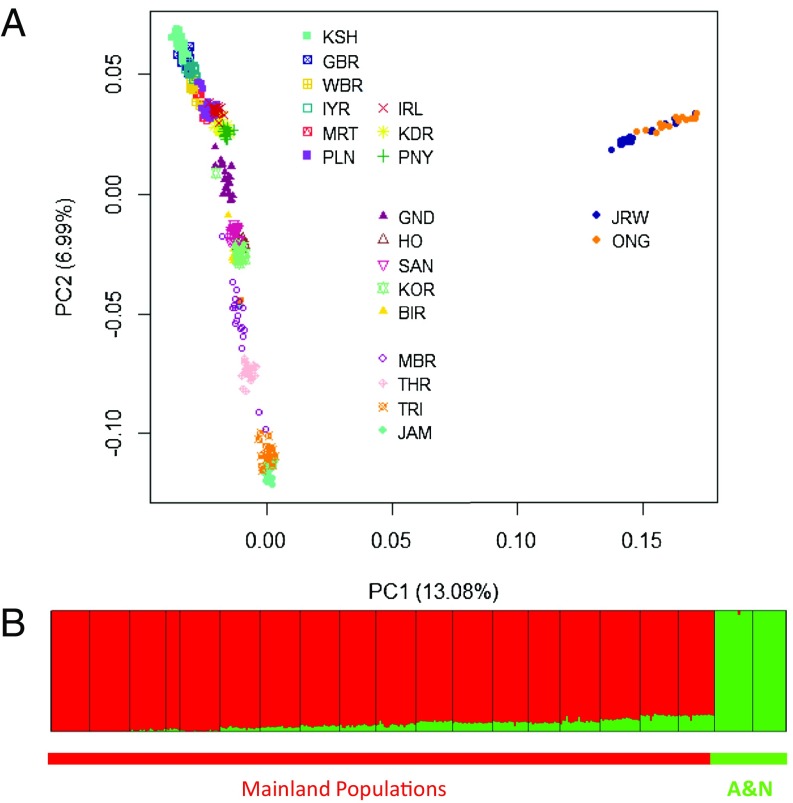
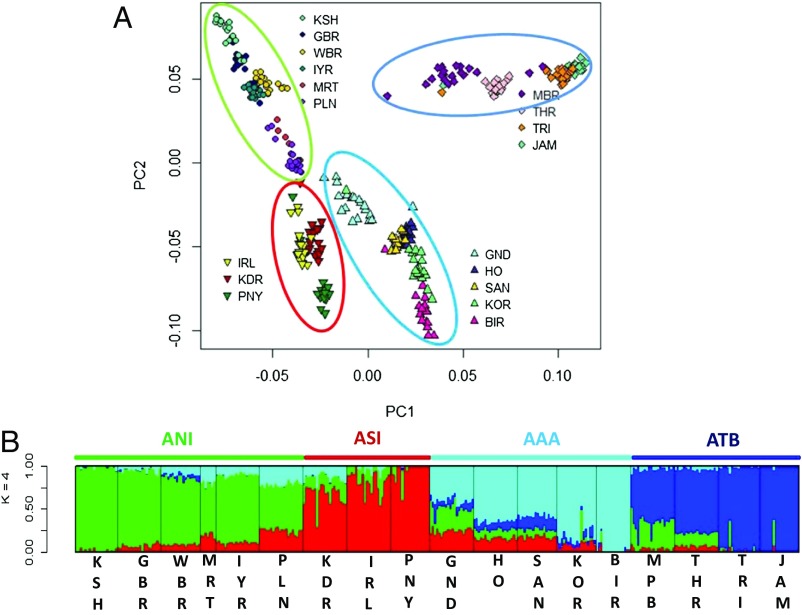
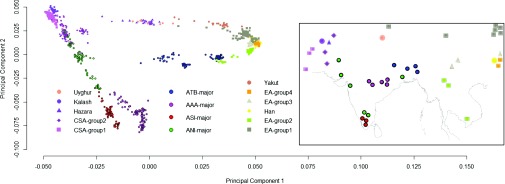
India, occupying the center stage of Paleolithic and Neolithic migrations, has been underrepresented in genome-wide studies of variation. Systematic analysis of genome-wide data, using multiple robust statistical methods, on (i) 367 unrelated individuals drawn from 18 mainland and 2 island (Andaman and Nicobar Islands) populations selected to represent geographic, linguistic, and ethnic diversities, and (ii) individuals from populations represented in the Human Genome Diversity Panel (HGDP), reveal four major ancestries in mainland India. This contrasts with an earlier inference of two ancestries based on limited population sampling. A distinct ancestry of the populations of Andaman archipelago was identified and found to be coancestral to Oceanic populations. Analysis of ancestral haplotype blocks revealed that extant mainland populations (i) admixed widely irrespective of ancestry, although admixtures between populations was not always symmetric, and (ii) this practice was rapidly replaced by endogamy about 70 generations ago, among upper castes and Indo-European speakers predominantly. This estimated time coincides with the historical period of formulation and adoption of sociocultural norms restricting intermarriage in large social strata. A similar replacement observed among tribal populations was temporally less uniform.
Keywords: admixture; ancestry; endogamy; haplotype blocks; social stratification.
Conflict of interest statement
The authors declare no conflict of interest.
Figures
Comment in
-
Emergence of sociocultural norms restricting intermarriage in large social strata (endogamy) coincides with foreign invasions of India.Proc Natl Acad Sci U S A. 2016 Apr 19;113(16):E2215-7. doi: 10.1073/pnas.1602697113. Epub 2016 Apr 8. Proc Natl Acad Sci U S A. 2016. PMID: 27071121 Free PMC article. No abstract available.
References
-
- Cann RL. Genetic clues to dispersal in human populations: Retracing the past from the present. Science. 2001;291(5509):1742–1748. - PubMed
-
- Mellars P. Going east: New genetic and archaeological perspectives on the modern human colonization of Eurasia. Science. 2006;313(5788):796–800. - PubMed
-
- Macaulay V, et al. Single, rapid coastal settlement of Asia revealed by analysis of complete mitochondrial genomes. Science. 2005;308(5724):1034–1036. - PubMed
-
- Quintana-Murci L, et al. Genetic evidence of an early exit of Homo sapiens sapiens from Africa through eastern Africa. Nat Genet. 1999;23(4):437–441. - PubMed
Publication types
MeSH terms
LinkOut - more resources
Full Text Sources
Other Literature Sources
Research Materials
