. 2016 Feb 9;113(6):1588-93.
doi: 10.1073/pnas.1515798113. Epub 2016 Jan 25.

Life history effects on the molecular clock of autosomes and sex chromosomes

Affiliations

Life history effects on the molecular clock of autosomes and sex chromosomes

Guy Amster et al. Proc Natl Acad Sci U S A. .

Abstract

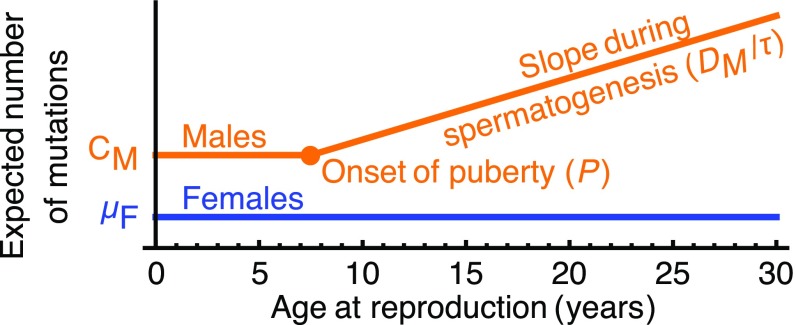
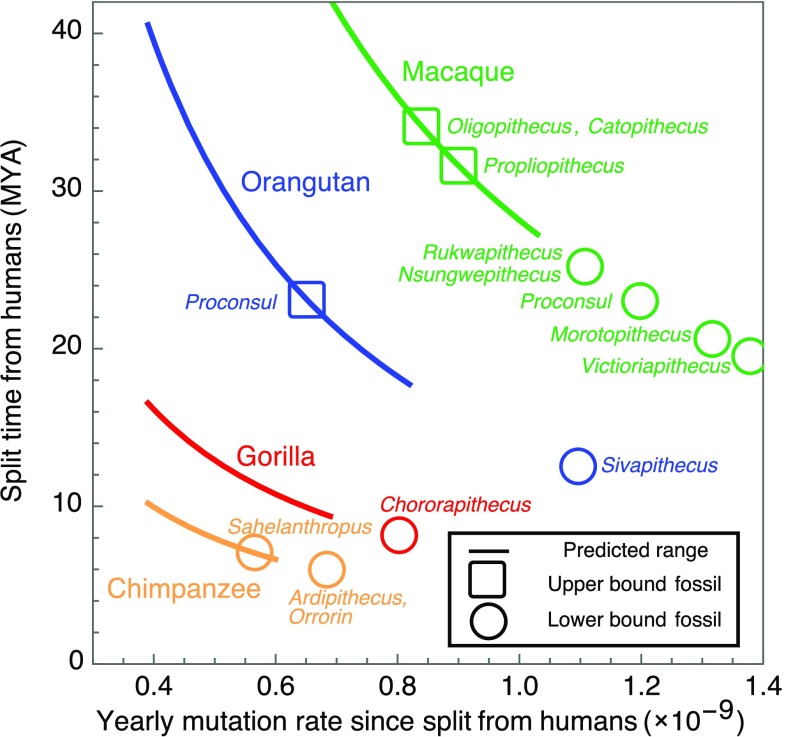
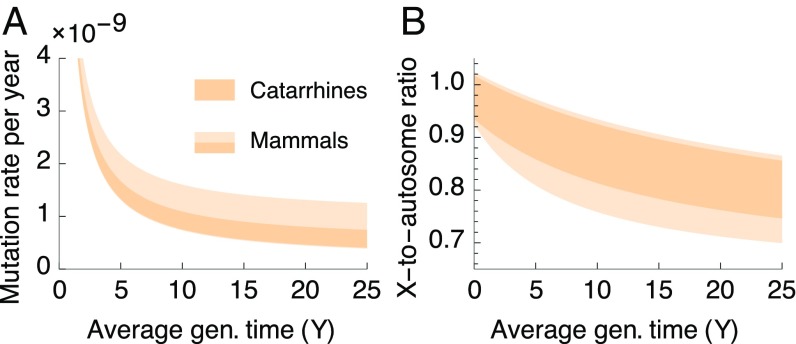
One of the foundational results in molecular evolution is that the rate at which neutral substitutions accumulate on a lineage equals the rate at which mutations arise. Traits that affect rates of mutation therefore also affect the phylogenetic "molecular clock." We consider the effects of sex-specific generation times and mutation rates in species with two sexes. In particular, we focus on the effects that the age of onset of male puberty and rates of spermatogenesis have likely had in hominids (great apes), considering a model that approximates features of the mutational process in mammals, birds, and some other vertebrates. As we show, this model can account for a number of seemingly disparate observations: notably, the puzzlingly low X-to-autosome ratios of substitution rates in humans and chimpanzees and differences in rates of autosomal substitutions among hominine lineages (i.e., humans, chimpanzees, and gorillas). The model further suggests how to translate pedigree-based estimates of human mutation rates into split times among extant hominoids (apes), given sex-specific life histories. In so doing, it largely bridges the gap reported between estimates of split times based on fossil and molecular evidence, in particular suggesting that the human-chimpanzee split may have occurred as recently as 6.6 Mya. The model also implies that the "generation time effect" should be stronger in short-lived species, explaining why the generation time has a major influence on yearly substitution rates in mammals but only a subtle one in human pedigrees.

Keywords: generation time effect; human–chimpanzee split; male mutation bias; molecular clock; mutational slowdown.


Conflict of interest statement

The authors declare no conflict of interest.

Figures

Fig. 1.
Fig. 1.
The mutational model.
Fig. 2.
Fig. 2.
Predicted yearly mutation rates on autosomes as a function of the ratio of male-to-female generation times (A), male age of puberty (B), and spermatogenic cycle length (C). Rates are measured relative to the estimate of 0.4×10⁹ per bp per year reported by Kong et al. (4), whose data we used to fit our mutational model (Model). In each panel, we vary one parameter, while fixing others to their estimated values in extant humans (brown) or chimpanzees (green) (Table 1). Note that the point estimates for humans and chimpanzees (black points) do not coincide with those reported in pedigree studies, because ours account for the predicted effects of life history and spermatogenesis parameters. The estimated range for gorillas (black line), where the spermatogenic cycle length has not been measured, corresponds to cycles between 16 d and 20 d.
Fig. 3.
Fig. 3.
The effects of the male-to-female ratio of generation times on estimates of the male mutation bias, α. (A) The function f mediating the effects of the ratios of male-to-female generation times and mutation rates on the X-to-autosome ratio of substitution rates. (B) The potential biases in estimates of α in nine mammalian species, as a function of the ratio of male-to-female generation times. The curve for each species is based on the X-to-autosome divergence ratio reported along its lineage (12, 13) (these ratios likely underestimate the X-to-autosome ratios of substitutions due to the contribution of ancestral polymorphism).
Fig. 4.
Fig. 4.
Predicted X-to-autosome ratios of substitution rates as a function of male and female generation times (A), male age of puberty (B), and rate of spermatogenesis (C). Other details are the same as in Fig. 2.
Fig. 5.
Fig. 5.
Estimated ranges of split times from humans (y axis) and the yearly mutation rates since the split (x axis). The inference is detailed in SI Appendix, section 5. Upper (squares) and lower (circles) bounds on split times are based on the hypothesized phylogenetic positioning of fossils (SI Appendix, section 5) (38).
Fig. 6.
Fig. 6.
The generation time effect on the molecular clock in a broader phylogenetic context. The yearly mutation rates (A) and X-to-autosome ratios (B) as a function of the sex averaged generation time, based on our mutational model. Other parameter ranges roughly correspond to catarrhines and mammals (SI Appendix, Table S4).

References

    1. Kimura M. The Neutral Theory of Molecular Evolution. Cambridge Univ Press; London: 1983.
    1. Kondrashov AS. Direct estimates of human per nucleotide mutation rates at 20 loci causing Mendelian diseases. Hum Mutat. 2003;21(1):12–27. - PubMed
    1. Nachman MW, Crowell SL. Estimate of the mutation rate per nucleotide in humans. Genetics. 2000;156(1):297–304. - PMC - PubMed
    1. Kong A, et al. Rate of de novo mutations and the importance of father’s age to disease risk. Nature. 2012;488(7412):471–475. - PMC - PubMed
    1. Ségurel L, Wyman MJ, Przeworski M. Determinants of mutation rate variation in the human germline. Annu Rev Genomics Hum Genet. 2014;15:47–70. - PubMed