. 2016 Mar 1;113(9):E1286-95.
doi: 10.1073/pnas.1520180113. Epub 2016 Jan 25.

Successful immunotherapy induces previously unidentified allergen-specific CD4+ T-cell subsets

Affiliations

Successful immunotherapy induces previously unidentified allergen-specific CD4+ T-cell subsets

John F Ryan et al. Proc Natl Acad Sci U S A. .

Abstract

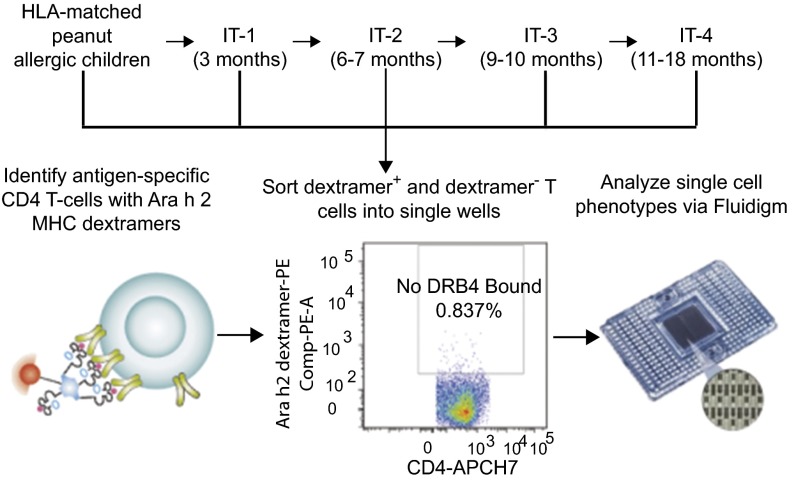
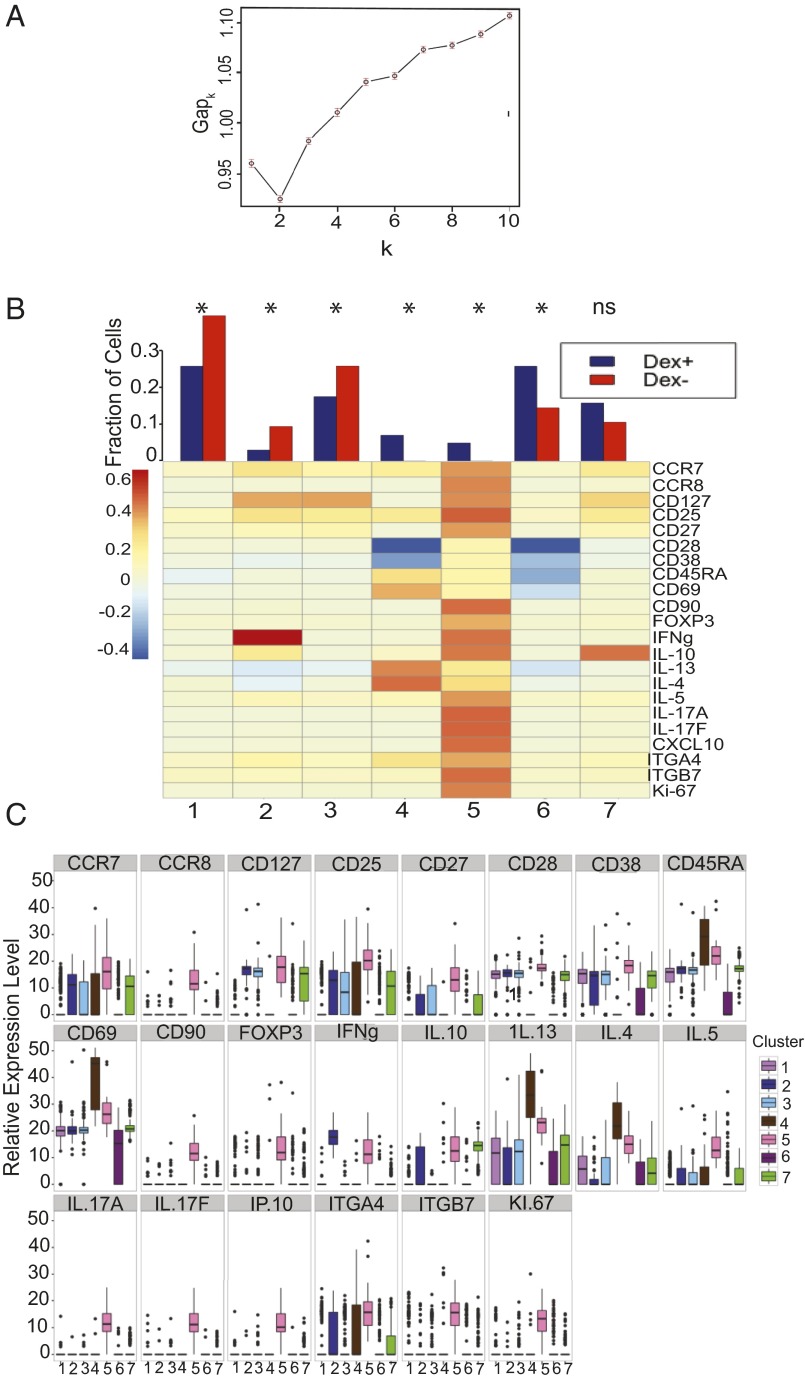
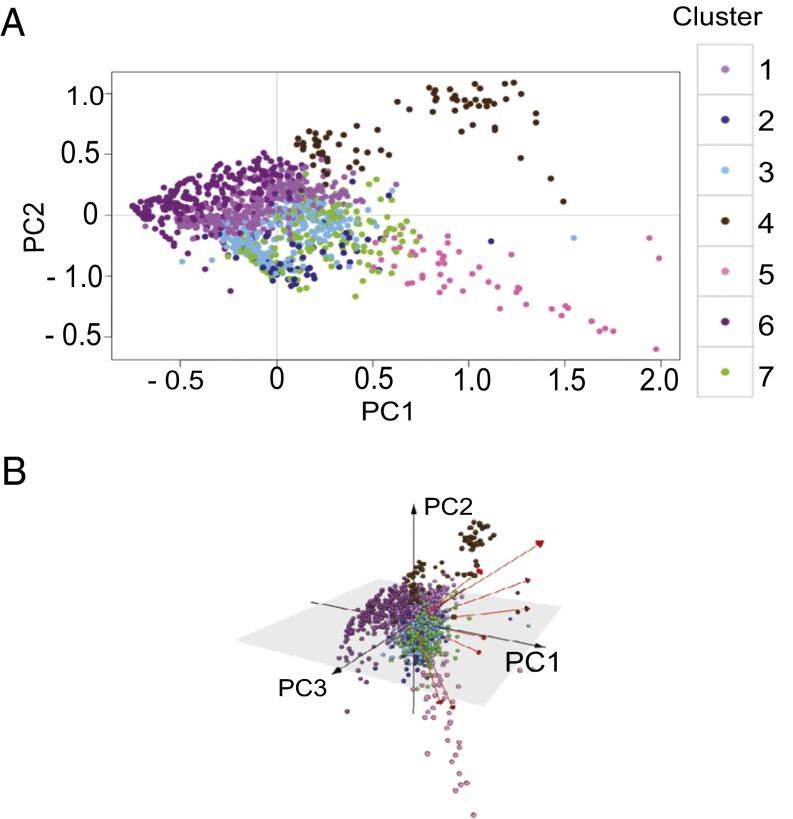
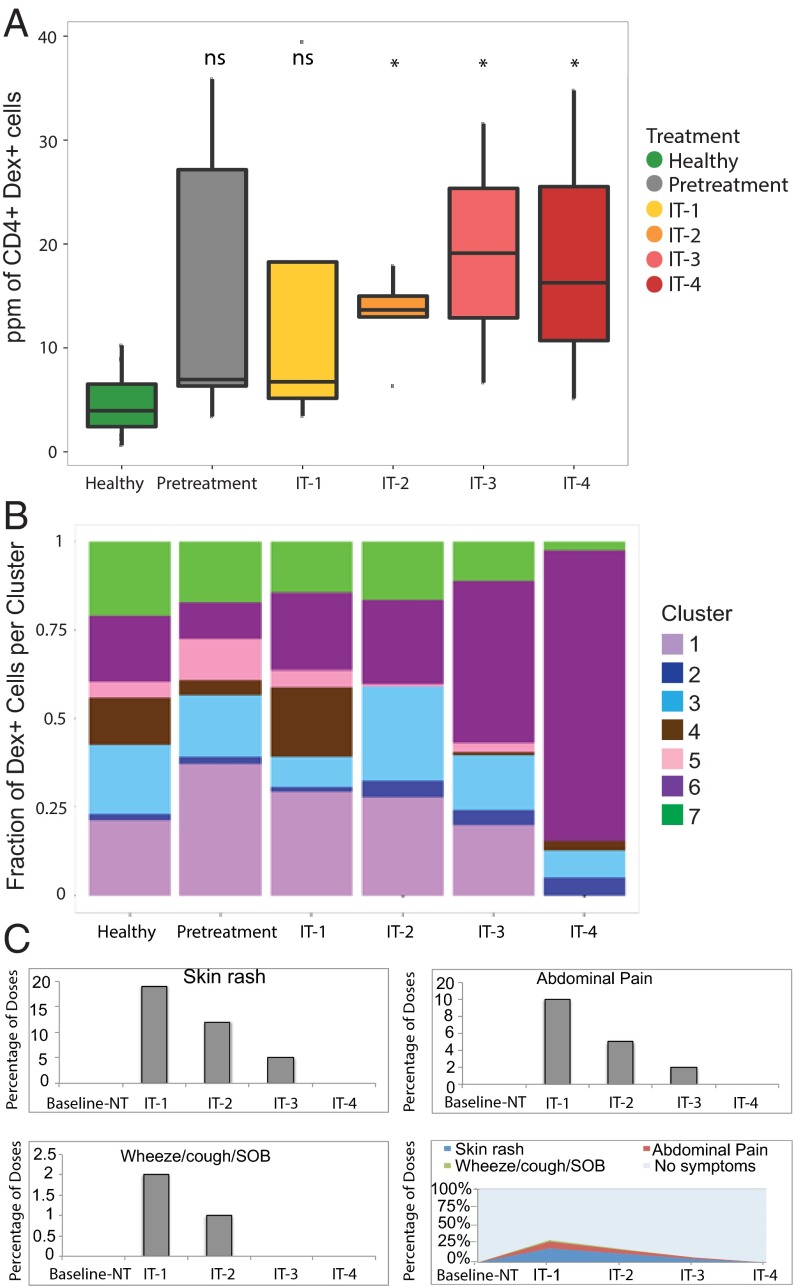
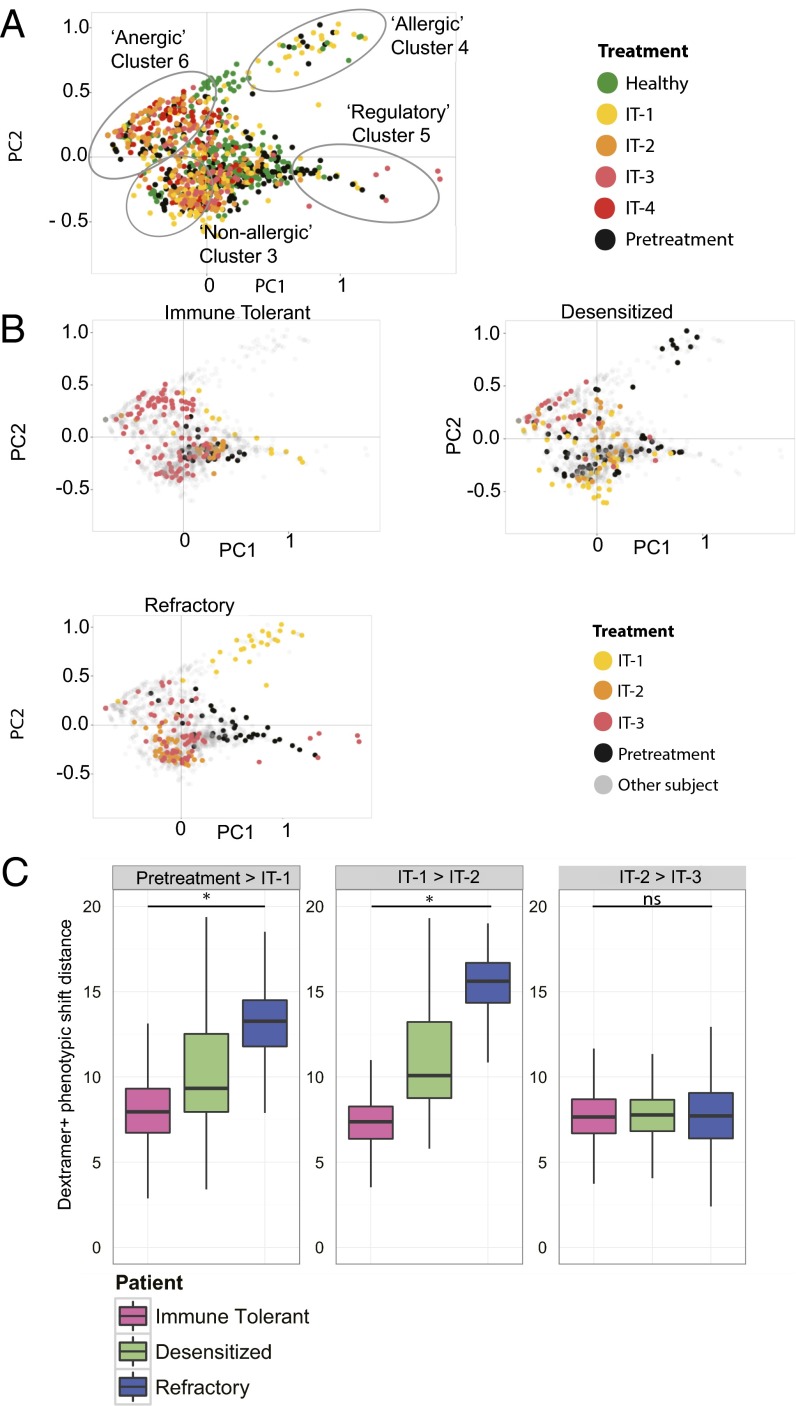
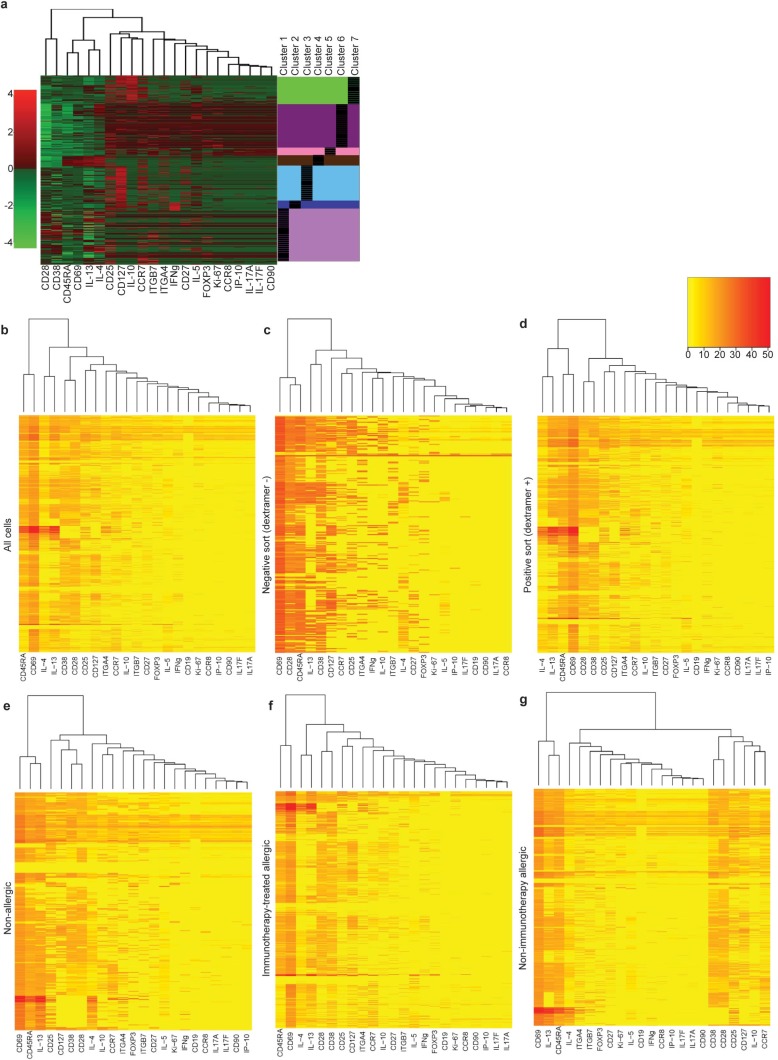
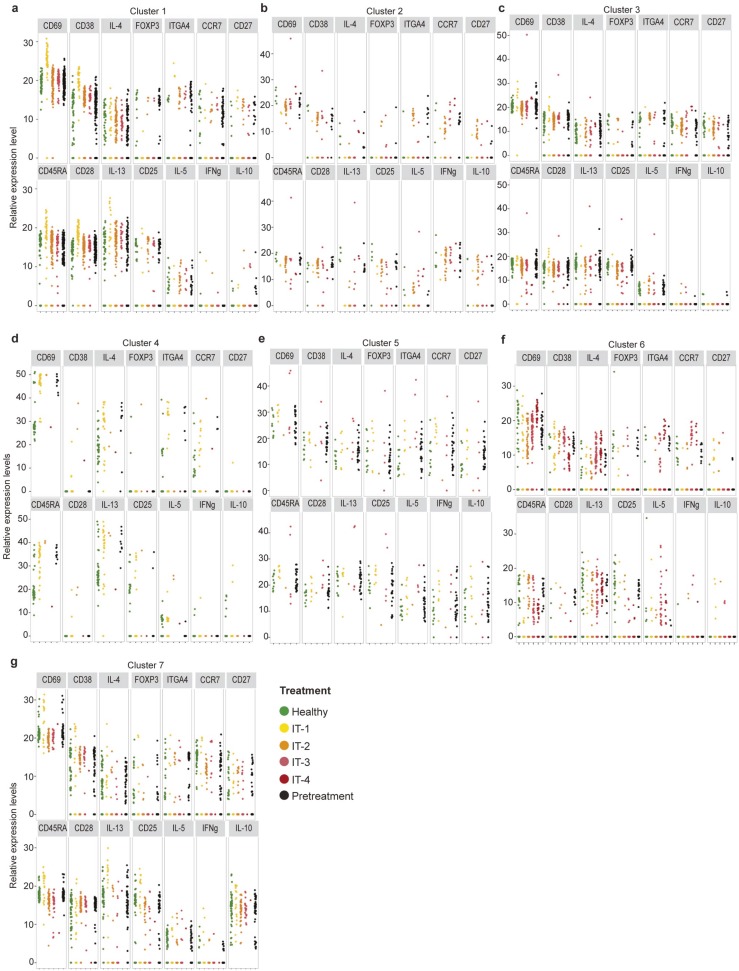
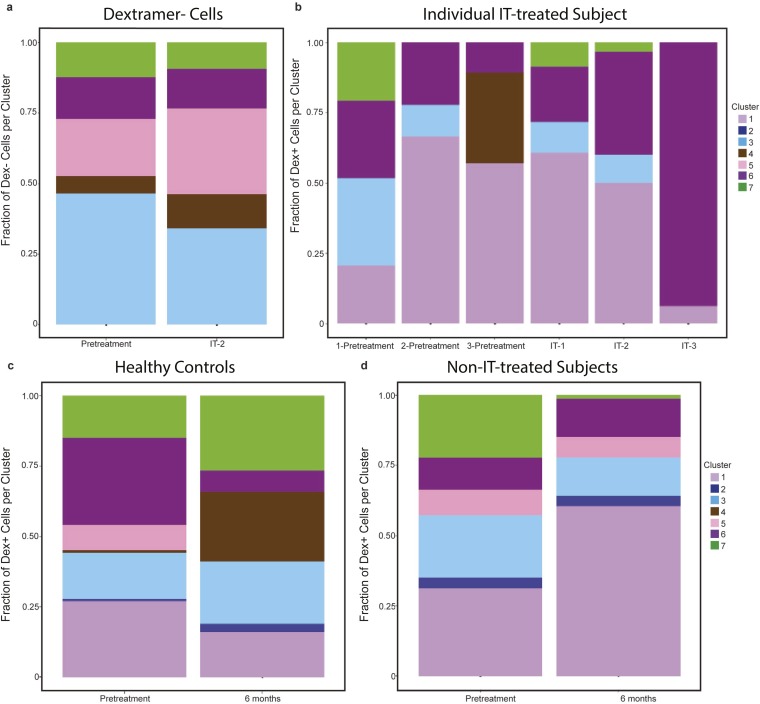
Allergen immunotherapy can desensitize even subjects with potentially lethal allergies, but the changes induced in T cells that underpin successful immunotherapy remain poorly understood. In a cohort of peanut-allergic participants, we used allergen-specific T-cell sorting and single-cell gene expression to trace the transcriptional "roadmap" of individual CD4+ T cells throughout immunotherapy. We found that successful immunotherapy induces allergen-specific CD4+ T cells to expand and shift toward an "anergic" Th2 T-cell phenotype largely absent in both pretreatment participants and healthy controls. These findings show that sustained success, even after immunotherapy is withdrawn, is associated with the induction, expansion, and maintenance of immunotherapy-specific memory and naive T-cell phenotypes as early as 3 mo into immunotherapy. These results suggest an approach for immune monitoring participants undergoing immunotherapy to predict the success of future treatment and could have implications for immunotherapy targets in other diseases like cancer, autoimmune disease, and transplantation.

Keywords: T cells; anergy; gene expression; immunotherapy; tolerance.


Conflict of interest statement

The authors declare no conflict of interest.

Figures

Fig. 1.
Fig. 1.
Allergen-specific CD4+ T cells are collected before and throughout IT treatment and analyzed for gene expression at the single-cell level. Schematic of the overall oral IT study and the time-point analysis. Allergen-specific CD4+ T cells were sorted from peripheral blood monocytes from HLA-DR4+ and HLA-DR15+ peanut-allergic participants by HLA-matched Ara h 2-MHC dextramer reagents on FACS into individual wells, followed by transcriptional profiling of a targeted phenotypic marker panel by Fluidigm Biomark.
Fig. 2.
Fig. 2.
CD4+ T cells form clusters with distinct gene expression, with allergen-specific cells preferentially occupying IL4+/IL13+/CD69+ cluster 4 and FOXP3+/IL10+/CD25+ cluster 5. (A) Gap statistics graph illustrating the elbow method for determining the number of k-means clusters that best represents the variance observed in single-cell gene-expression data. Seven clusters were chosen. (B) Fraction of dextramer+ and dextramer− CD4+ T cells which belong to each cluster, and a heat map profile of relative gene expression for each cluster. *P < 0.0073, ns = not significant (χ2 tests with Bonferroni-corrected P-value cutoff for multiple testing). (C) Interquartile ranges of relative gene expression for each of the seven clusters.
Fig. 3.
Fig. 3.
Antigen-specific CD4+ T cells form seven cluster phenotypes with distinct gene expression. PCA representation of variations in cell phenotypes, plotting cells along (A) PC1 and PC2; (B) PC1, PC2, and PC3. The cells of all participants at all time points are colored according to the CD4+ T-cell clusters to which they were assigned using k-means. Variance accounted for by each PC: PC1 = 32.8%, PC2 = 15.8%, PC3 = 8.83%, PC4 = 6.34%.
Fig. 4.
Fig. 4.
Cluster 6 T-cell receptor nonresponsive (CD28-/CD38-) noninterleukin secreting (IL13-/IL4-/IL10-/IL5-/IFNγ-) antigen-specific CD4+ T cells expand and allergy symptoms diminish over the course of IT. (A) Interquartile ranges for ppm of antigen-specific CD4+ T cells from pooled healthy (n = 7), pretreatment (n = 5), IT-1 (n = 5), IT-2 (n = 5), IT-3 (n = 2), and IT-4 (n = 2) participants. *P < 0.01, ns = not significant (t tests comparing each time point to healthy controls with Bonferroni-corrected p-value cutoff for multiple testing). (B) The fractional proportion of dextramer+ CD4+ T cells in each phenotype cluster from all participants at each IT time point IT-1 (n = 5), IT-2 (n = 5), IT-3 (n = 2), and IT-4 participants (n = 2), pretreatment (n = 5), and healthy controls (n = 7). (C) Percentage of doses resulting in allergy symptoms observed within 2 h of daily peanut ingestion within each IT time frame drawing from all IT participants.
Fig. 5.
Fig. 5.
Temporal expression of CD4+ T-cell clusters reveals individualized patterns associated with clinical phenotypes. (A) Two-dimensional PCA of antigen-specific CD4+ T cells from all healthy subjects (green), and all pretreatment time points (black), IT-1 (yellow), IT-2 (orange), IT-3 (pink), and IT-4 (red) time points for IT participants. Variance accounted for by PCs: PC1 = 32.8%, PC2 = 15.8%. (B) Representative phenotypic shifts across IT time points from one immune tolerant subject, one refractory subject, and one desensitized subject, displayed via 2D-PCA for antigen-specific CD4+ T cells from immune-tolerant, desensitized, or refractory participants over the course of IT. Gray dots represent cells from other participants. (C) Interquartile range of “phenotypic shift” distances for dextramer+ CD4+ T cells from individual participants between IT time points. The one immune-tolerant subject, one refractory subject, and one desensitized subject are the same individuals that appear in B. Higher shift values indicate greater average change in CD4+ allergen-specific phenotype between time points. Phenotype shifts were for months 0–18 during IT, whereas “desensitized/immune tolerant/refractory” status was determined at month 27. *P < 0.001, ns = not significant (one-way ANOVAs). The calculations were performed from every cell in one time point to every cell in the next time point within an individual. The total number of cell–cell comparisons are summarized in Table S2.
Fig. S1.
Fig. S1.
Single-cell gene-expression analyses of CD4+ T cells in allergic disease identifies differential gene expression. (A) Heat map of differential gene expression among all individual cells (rows) and 22 T-cell–related genes (columns) up-regulated (red) or down-regulated (green). Unsupervised k-means clustering divided individual cells into seven clusters, indicated to the right of the heat map. (B) Heat map of differential gene expression (red = up-regulated, yellow = down-regulated) for all individual cells, (C) negatively sorted cells (dextramer−), (D) positively sorted cells (dextramer +), (E) cells from nonallergic participants, (F) cells from IT-treated participants, and (G) cells from non–IT-treated allergic participants). Dendrograms in AG show clustering of markers based on similarity of expression profile using the complete linkage clustering.
Fig. S2.
Fig. S2.
IT changes gene expression among antigen-specific CD4+ T-cell clusters. Relative transcript expression levels for individual markers from antigen-specific CD4+ T-cell clusters from healthy nonallergic (green), pretreatment participants (black), and participants during IT at IT-1 (yellow), IT-2 (orange), IT-3 (pink), and IT-4 (red) time points for (A) cluster 1, (B) cluster 2, (C) cluster 3, (D) cluster 4, (E) cluster 5, (F) cluster 6, and (G) cluster 7.
Fig. S3.
Fig. S3.
CD4+ T cells of altered phenotypes expand or contract over time and during IT. The fractional proportion of each CD4+ T-cell cluster for (A) negatively sorted CD4+ T cells (antigen nonspecific) at pretreatment (n = 3) and at IT-2 (n = 3) from all individuals from whom negatively sorted cells were acquired, (B) antigen-specific CD4+ T cells from a single subject at pretreatment: 1 (−6 mo), 2 (−3 mo), and 3 (0 mo), and during IT at IT-1, IT-2, and IT-3, (C) antigen-specific CD4+ T cells from healthy control participants at pretreatment (n = 7) and 6 mo later without IT (n = 7), and (D) antigen-specific CD4+ T cells from allergic participants at pretreatment (n = 5) and 6 mo later without IT (n = 5).
Fig. S4.
Fig. S4.
Basophil activation and IgE and IgG4 levels among allergic participants are not predictive of clinical outcome. (A) Difference of percentage of CD63+ cells when stimulated with peanut vs. media for individual participants. (B) Concentration of IgE in the blood of individual participants. (C) Concentration of IgG4 in the blood of individual participants. Each line represents measurements from a single individual. Healthy control status and clinical outcome for allergic participants are indicated in the figure legend.
Fig. S5.
Fig. S5.
Comparison of biomarkers shows timing of phenotypic shifts. A comparison among allergic individuals of average IgE concentration, average IgG4 concentration, average basophil activation, and fractional proportion of T cells in cluster 6 as a percentage of each marker’s level at baseline. Mean concentrations are calculated at each time point using data from each individual who donated a sample at that time point.
Fig. 6.
Fig. 6.
Single-cell TCR sequencing and gene expression during successful IT demonstrates tolerogenic gene expression without defined lineage commitment. TCR sequencing of CDR3 regions and Vβ, Vα, Jα, and Jβ use, and RT-PCR of transcript expression, for individual sorted dextramer+ or dextramer− CD4+ T cells at IT-2 from one participant later determined to be immune tolerant. Shaded boxes represent gene expression of FOXP3, GATA3, IFN-γ, IL-13, IL-12, IL-21, T-BET, TGF-β1, TNFα, BCL-6, RUNX1, or RUNX3. Horizontal line separates data from dextramer− cells (above the line) and dextramer+ cells (below the line).

Similar articles

Cited by

  • Peanut oral immunotherapy differentially suppresses clonally distinct subsets of T helper cells.
    Monian B, Tu AA, Ruiter B, Morgan DM, Petrossian PM, Smith NP, Gierahn TM, Ginder JH, Shreffler WG, Love JC. Monian B, et al. J Clin Invest. 2022 Jan 18;132(2):e150634. doi: 10.1172/JCI150634. J Clin Invest. 2022. PMID: 34813505 Free PMC article. Clinical Trial.
  • Deciphering the black box of food allergy mechanisms.
    Sampath V, Tupa D, Graham MT, Chatila TA, Spergel JM, Nadeau KC. Sampath V, et al. Ann Allergy Asthma Immunol. 2017 Jan;118(1):21-27. doi: 10.1016/j.anai.2016.10.017. Ann Allergy Asthma Immunol. 2017. PMID: 28007085 Free PMC article. Review.
  • Biomarkers in oral immunotherapy.
    Zhu H, Tang K, Chen G, Liu Z. Zhu H, et al. J Zhejiang Univ Sci B. 2022 Sept 15;23(9):705-731. doi: 10.1631/jzus.B2200047. J Zhejiang Univ Sci B. 2022. PMID: 36111569 Free PMC article. Review.
  • Emerging Food Allergy Biomarkers.
    Patil SU, Bunyavanich S, Berin MC. Patil SU, et al. J Allergy Clin Immunol Pract. 2020 Sep;8(8):2516-2524. doi: 10.1016/j.jaip.2020.04.054. J Allergy Clin Immunol Pract. 2020. PMID: 32888527 Free PMC article. Review.
  • Treating cat allergy with monoclonal IgG antibodies that bind allergen and prevent IgE engagement.
    Orengo JM, Radin AR, Kamat V, Badithe A, Ben LH, Bennett BL, Zhong S, Birchard D, Limnander A, Rafique A, Bautista J, Kostic A, Newell D, Duan X, Franklin MC, Olson W, Huang T, Gandhi NA, Lipsich L, Stahl N, Papadopoulos NJ, Murphy AJ, Yancopoulos GD. Orengo JM, et al. Nat Commun. 2018 Apr 12;9(1):1421. doi: 10.1038/s41467-018-03636-8. Nat Commun. 2018. PMID: 29650949 Free PMC article. Clinical Trial.

References

    1. Larché M, Akdis CA, Valenta R. Immunological mechanisms of allergen-specific immunotherapy. Nat Rev Immunol. 2006;6(10):761–771. - PubMed
    1. Wambre E, et al. Differentiation stage determines pathologic and protective allergen-specific CD4+ T-cell outcomes during specific immunotherapy. J Allergy Clin Immunol. 2012;129(2):544–551, 551.e1–551.e7. - PMC - PubMed
    1. Akdis M, Akdis CA. Therapeutic manipulation of immune tolerance in allergic disease. Nat Rev Drug Discov. 2009;8(8):645–660. - PubMed
    1. Bedoret D, et al. Changes in antigen-specific T-cell number and function during oral desensitization in cow’s milk allergy enabled with omalizumab. Mucosal Immunol. 2012;5(3):267–276. - PMC - PubMed
    1. Burks AW, et al. NIAID-sponsored 2010 guidelines for managing food allergy: Applications in the pediatric population. Pediatrics. 2011;128(5):955–965. - PMC - PubMed

Publication types