. 2016 Feb 9;113(6):1564-9.
doi: 10.1073/pnas.1518000113. Epub 2016 Jan 25.

Proinflammatory signal suppresses proliferation and shifts macrophage metabolism from Myc-dependent to HIF1α-dependent

Affiliations

Proinflammatory signal suppresses proliferation and shifts macrophage metabolism from Myc-dependent to HIF1α-dependent

Lingling Liu et al. Proc Natl Acad Sci U S A. .

Abstract

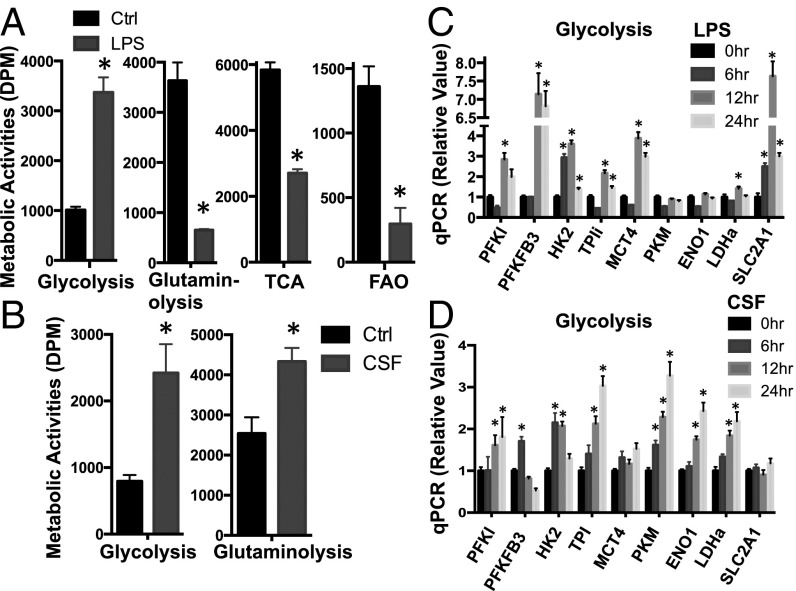
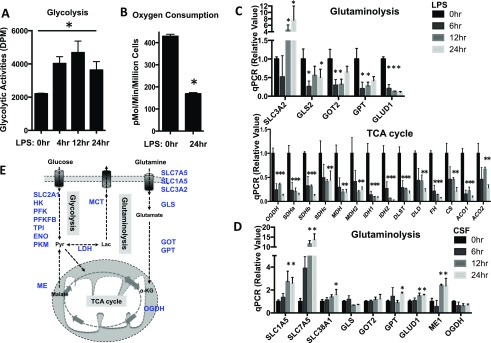
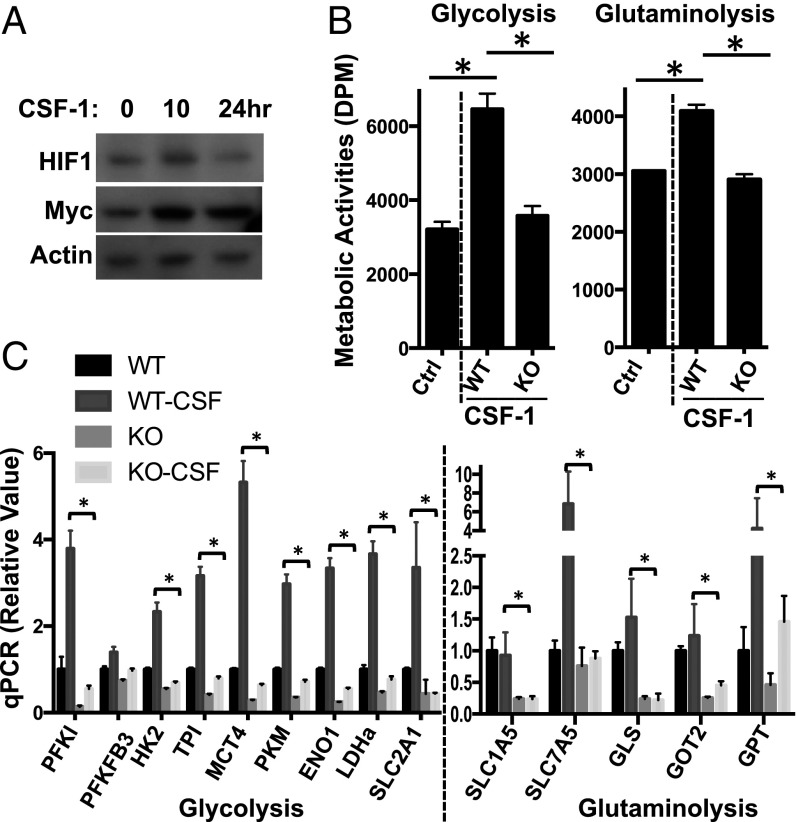
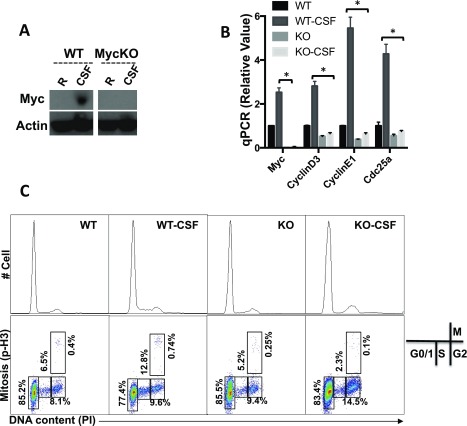
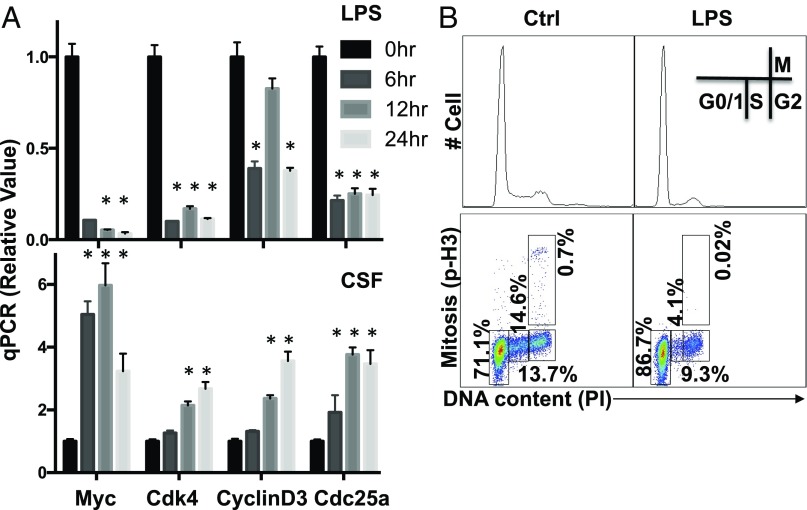
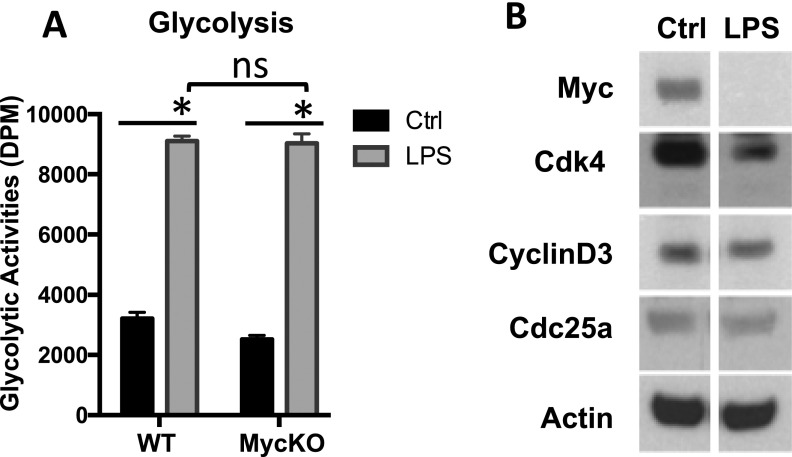
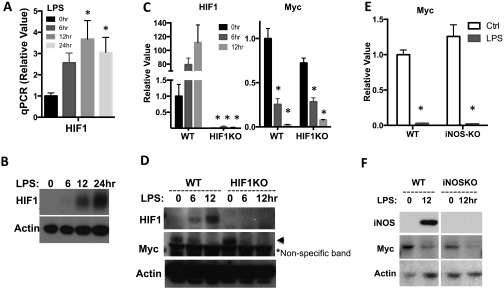
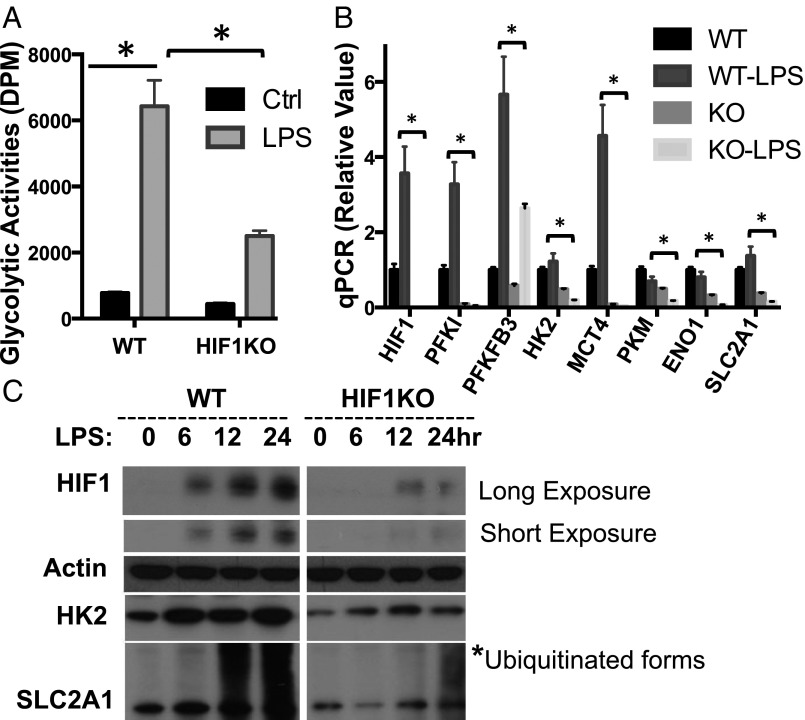
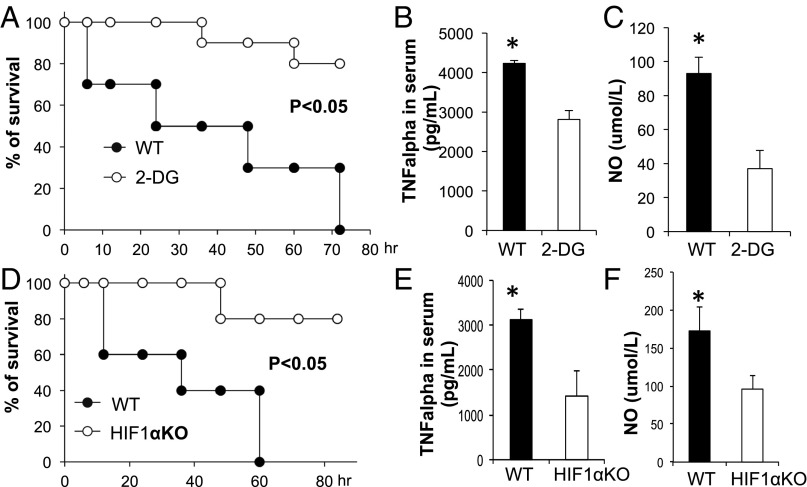
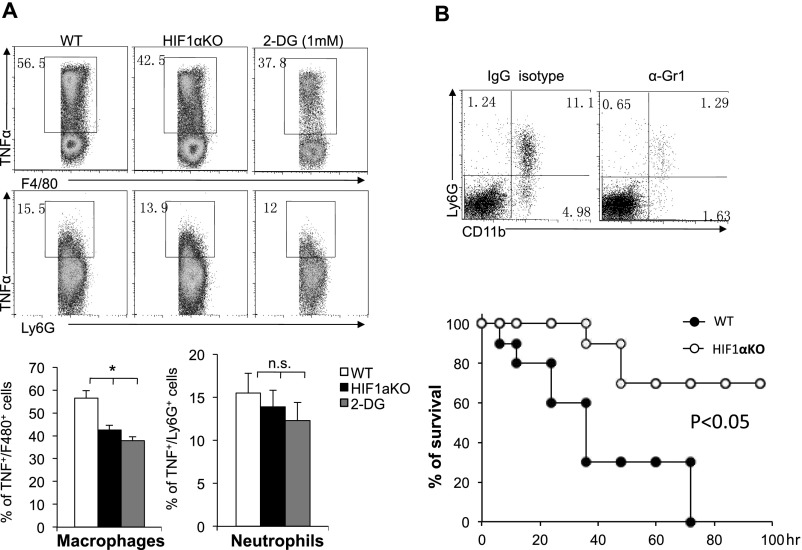
As a phenotypically plastic cellular population, macrophages change their physiology in response to environmental signals. Emerging evidence suggests that macrophages are capable of tightly coordinating their metabolic programs to adjust their immunological and bioenergetic functional properties, as needed. Upon mitogenic stimulation, quiescent macrophages enter the cell cycle, increasing their bioenergetic and biosynthetic activity to meet the demands of cell growth. Proinflammatory stimulation, however, suppresses cell proliferation, while maintaining a heightened metabolic activity imposed by the production of bactericidal factors. Here, we report that the mitogenic stimulus, colony-stimulating factor 1 (CSF-1), engages a myelocytomatosis viral oncogen (Myc)-dependent transcriptional program that is responsible for cell cycle entry and the up-regulation of glucose and glutamine catabolism in bone marrow-derived macrophages (BMDMs). However, the proinflammatory stimulus, lipopolysaccharide (LPS), suppresses Myc expression and cell proliferation and engages a hypoxia-inducible factor alpha (HIF1α)-dependent transcriptional program that is responsible for heightened glycolysis. The acute deletion of Myc or HIF1α selectively impaired the CSF-1- or LPS-driven metabolic activities in BMDM, respectively. Finally, inhibition of glycolysis by 2-deoxyglucose (2-DG) or genetic deletion of HIF1α suppressed LPS-induced inflammation in vivo. Our studies indicate that a switch from a Myc-dependent to a HIF1α-dependent transcriptional program may regulate the robust bioenergetic support for an inflammatory response, while sparing Myc-dependent proliferation.

Keywords: HIF1α; Myc; cell cycle; macrophage; metabolism.


Conflict of interest statement

The authors declare no conflict of interest.

Figures

Fig. 1.
Fig. 1.
Proinflammatory and mitogenic stimulation differentially drives macrophage metabolic reprogramming. (A and B) Untreated BMDMs (Ctrl) and LPS-stimulated (A) or CSF-stimulated BMDMs (B) were collected at 24 h after stimulation and were used for measuring the generation of 3H2O from [3-3H]-glucose (glycolysis) or from [9,10-3H]-palmitic acid (fatty acid beta-oxidation) and from [U-14C]-glutamine (glutaminolysis) or from [2-14C]-pyruvate (TCA). (C and D) RNAs were isolated from BMDMs collected at the indicated time after LPS (C) or CSF (D) stimulation and used for real-time PCR analyses of metabolic genes in the glycolytic pathway and in the glutaminolytic pathway. The relative gene expression was determined by the comparative CT method, also referred to as the 2−ΔΔCT method. Error bars represent SD from the mean of triplicate qPCR reactions. Data are representative of three independent experiments. P values were calculated with Student’s t test. P values of <0.05 were considered significant. An equal number of cells were used in the radioisotopic experiments. DPM, disintegrations per min.
Fig. S1.
Fig. S1.
Proinflammatory and mitogenic stimulation differentially drives macrophage metabolic reprogramming. (A and B) BMDMs collected at the indicated time after LPS stimulation were used for measure glycolysis (A) and oxygen consumption (B) by the Seahorse XF24 analyzer. Error bars represent SD from the mean of triplicate samples. Data are representative of two independent experiments. (C and D) RNAs were isolated from BMDMs collected at the indicated time after LPS (C) or CSF (D) stimulation and used for real-time PCR analyses of metabolic genes in the indicated pathways. The relative gene expression was determined as described in detail in Fig. 1. Error bars represent SD from the mean of triplicate qPCR reactions. Data are representative of two independent experiments. (E) Diagram of cell metabolic pathways, with key metabolic genes highlighted in blue (examined by qPCR in Fig. 1 and Fig. S1). Of note, α-KG represents alpha-ketoglutarate. P values were calculated with Student’s t test. P values of <0.05 were considered significant. An equal number of cells were used in the radioisotopic experiments.
Fig. 2.
Fig. 2.
Myc is required for CSF-driven proliferation and metabolic reprogramming in macrophage. (A) The protein levels of HIF1α and c-Myc in BMDMs collected at the indicated time after CSF stimulation were determined by Western blot. (B and C) BMDMs generated from either RosaCreERTam−, Mycflox/flox mice (WT) or RosaCreERTam+, Mycflox/flox mice (KO) were pretreated with 500 nM 4OHT (+4OHT). Untreated BMDMs (Ctrl) or CSF-stimulated BMDM (CSF) were used for measuring indicated metabolic activities (B) or the mRNA expression of indicated metabolic gene expression (C). The relative gene expression was determined as described in detail in Fig. 1. Error bars represent SD from the mean of triplicate qPCR reactions. Data are representative of two independent experiments. P values were calculated with Student’s t test. P values of <0.05 were considered significant. An equal number of cells were used in the radioisotopic experiments.
Fig. S2.
Fig. S2.
Myc is required for CSF-driven proliferation and metabolic reprogramming in macrophage. BMDMs generated from either RosaCreERTam−, Mycflox/flox mice (WT) or RosaCreERTam+, Mycflox/flox mice (KO) were pretreated with 500 nM 4OHT (+4OHT). Untreated BMDMs (Ctrl) or CSF-stimulated BMDM (CSF) were collected 24 h after stimulation. The protein level of c-Myc (A) and mRNA level of the indicated genes (B) were determined by Western blot and qPCR, respectively. Of note, the blots of Myc and Actin were from two gels, both of which were from the same batch of samples. The relative gene expression was determined as described in detail in Fig. 1. Error bars represent SD from the mean of triplicate qPCR reactions. Data are representative of two independent experiments. P values were calculated with Student’s t test. P values of <0.05 were considered significant. (C) The indicated BMDM groups were CSF-1 starved for 2 d before CSF-1 stimulation. The cell cycle profile was determined as the combinational staining of propidium iodide (PI) and p-Histone H3 antibody (p-H3) by flow cytometry.
Fig. 3.
Fig. 3.
Metabolic rewiring during macrophage M1 polarization is associated with cell cycle blockage. (A) BMDMs cultured in differentiation medium (with the presence of CSF-1) collected at the indicated time after LPS stimulation (Upper) and CSF stimulation (Lower) were used to determine the mRNA level of indicated genes by qPCR. The relative gene expression was determined as described in detail in Fig. 1. Error bars represent SD from the mean of triplicate qPCR reactions. Data are representative of two independent experiments. P values were calculated with Student’s t test. P values of <0.05 were considered significant. (B) Untreated BMDMs (Ctrl) and LPS-stimulated (LPS) were collected at 24 h after stimulation. The cell cycle profile in indicated groups was determined as the combinational staining of propidium iodide (PI) and p-Histone H3 antibody (p-H3) by flow cytometry.
Fig. S3.
Fig. S3.
Metabolic rewiring during macrophage M1 polarization is associated with cell cycle blockage. (A) BMDMs generated from either RosaCreERTam−, Mycflox/flox mice (WT) or RosaCreERTam+, Mycflox/flox mice (KO) were pretreated with 500 nM 4OHT (+4OHT). Untreated BMDMs (Ctrl) or LPS-stimulated BMDMs (LPS) were collected 24 h after stimulation and were used to determine glycolysis rate. An equal number of cells were used in the radioisotopic experiments. (B) Untreated BMDMs (Ctrl) and LPS-stimulated (LPS) were collected at 24 h after stimulation. The protein levels of the indicated genes were determined by Western blot. Of note, these blots were from two transferred membranes but from the same batch of samples (lysates). Each membrane was cut into two parts (on the 50-kDa marker), which were probed for targets based on their estimated molecular weights. The actin result was a representative result from reprobing of the stripped blot.
Fig. S4.
Fig. S4.
Induction of HIF1α mRNA and protein by LPS in macrophage. (AF) The mRNA (A, C, and E) and protein (B, D, and F) levels of the indicated genes in BMDMs collected at the indicated time after LPS stimulation were determined by qPCR and Western blot, respectively. The relative gene expression was determined as described in detail in Fig. 1. Error bars represent SD from the mean of triplicate qPCR reactions. Data are representative of two independent experiments. P values were calculated with Student’s t test. P values of <0.05 were considered significant.
Fig. 4.
Fig. 4.
HIF1α is required for LPS-driven glycolysis in macrophage. (A and B) BMDMs generated from either RosaCreERT2-, HIF1αflox/flox mice (WT) or RosaCreERT2+, HIF1αflox/flox mice (KO) were pretreated with 500 nM 4OHT (+4OHT). Untreated BMDMs (Ctrl) or LPS-stimulated BMDM (LPS) were collected 24 h after stimulation. The rate of glycolysis (A) and the expression of indicated mRNA (B) were determined by radioactive tracer-based assay and qPCR, respectively. The relative gene expression was determined as described in detail in Fig. 1. Error bars represent SD from the mean of triplicate qPCR reactions. Data are representative of two independent experiments. P values were calculated with Student’s t test. P values of <0.05 were considered significant. (C) BMDMs in indicated groups were collected at the indicated time after LPS stimulation. The protein levels of indicated genes were determined by Western blot. Of note, these blots were from two transferred membranes but from the same batch of samples (lysates). The actin result was a representative result from reprobing of a stripped blot. An equal number of cells were used in the radioisotopic experiments.
Fig. 5.
Fig. 5.
Genetic deletion of HIF1α or pharmacologic blockage of glycolysis reduces severity of LPS-induced sepsis. (AC) Age-matched BL6 mice were injected (i.p.) with PBS (solvent) or 2-DG (2 g/kg body weight) daily starting at 6 h before LPS (10 mg/kg) injection. The survival curve was plotted (A, n = 10). At 36 h, the serum was collected, and TNFα and NO levels were examined by ELISA and Greiss reagent, respectively (B and C). (DF) Age-matched BL6 mice (WT) or LysM-Cre, HIF-1αflox/flox (KO) mice were injected (i.p.) with LPS (10 mg/kg). The survival curve was plotted (D, n = 10). At 36 h, the serum was collected, and TNFα and NO levels were examined by ELISA and Greiss reagent, respectively (E and F). Data are representative of two independent experiments. P values were calculated with Student’s t test. P values of <0.05 were considered significant.
Fig. S5.
Fig. S5.
Characterization of LysM-Cre activities and LysM-Cre, HIF1αfl/fl mice. (A) The indicated organs were collected from LysM-Cre+LSL-YFP mice, the frequency of YFP+ cells was determined by FACS. (B) Age-matched BL6 mice (WT) or LysM-Cre, HIF-1αflox/flox (KO) mice were injected (i.p.) with solvent or LPS (10 mg/kg). At 36 h, the frequency of various immune populations in the indicated organ was determined by FACS. Data are representative of two independent experiments. P values were calculated with Student’s t test. P values of <0.05 were considered significant.
Fig. S6.
Fig. S6.
Genetic deletion of HIF1α or pharmacologic blockage of glycolysis reduces severity of LPS-induced sepsis. (A) Age-matched BL6 mice (WT), LysM-Cre, HIF-1αflox/flox (KO) mice, or WT mice pretreated with 2-DG (as indicated in Fig. 5A) were injected (i.p.) with LPS (10 mg/kg). At 36 h, the TNFα expression in liver F4/80+ macrophages or Ly6G+ neutrophils was determined by FACS. (B) Age-matched BL6 mice (WT) and LysM-Cre, HIF-1αflox/flox (KO) mice were injected with 0.25 mg of anti-Gr1 antibody or IgG2b isotype control antibody at day −1 and day 3. Sepsis was induced by injecting 2 mg⋅kg−1 LPS at day 0. The survival curve was plotted (n = 10). The frequency of CD11b+Ly6G+ neutrophils in liver was determined by FACS.

References

    1. Ginhoux F, Jung S. Monocytes and macrophages: Developmental pathways and tissue homeostasis. Nat Rev Immunol. 2014;14(6):392–404. - PubMed
    1. Sieweke MH, Allen JE. Beyond stem cells: Self-renewal of differentiated macrophages. Science. 2013;342(6161):1242974. - PubMed
    1. Newsholme EA, Crabtree B, Ardawi MS. The role of high rates of glycolysis and glutamine utilization in rapidly dividing cells. Biosci Rep. 1985;5(5):393–400. - PubMed
    1. DeBerardinis RJ, Lum JJ, Hatzivassiliou G, Thompson CB. The biology of cancer: Metabolic reprogramming fuels cell growth and proliferation. Cell Metab. 2008;7(1):11–20. - PubMed
    1. Shaw RJ. Glucose metabolism and cancer. Curr Opin Cell Biol. 2006;18(6):598–608. - PubMed

Publication types

MeSH terms