

Revisiting the contemporary sea-level budget on global and regional scales
- PMID: 26811469
- PMCID: PMC4760811
- DOI: 10.1073/pnas.1519132113
Revisiting the contemporary sea-level budget on global and regional scales
Abstract
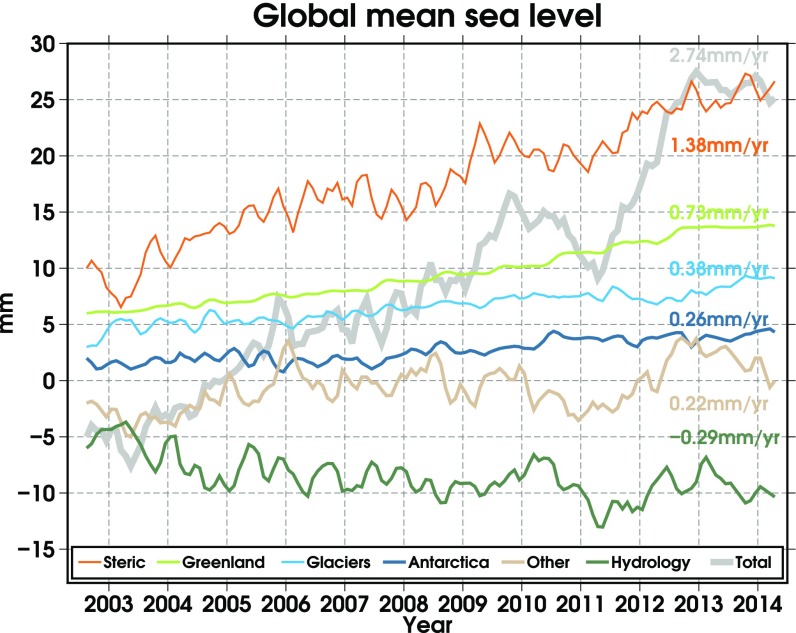
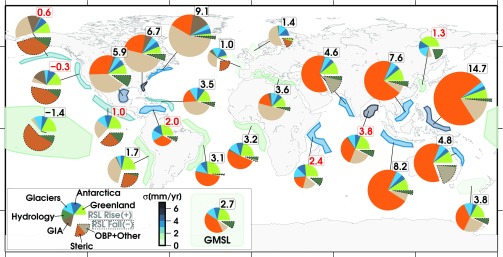
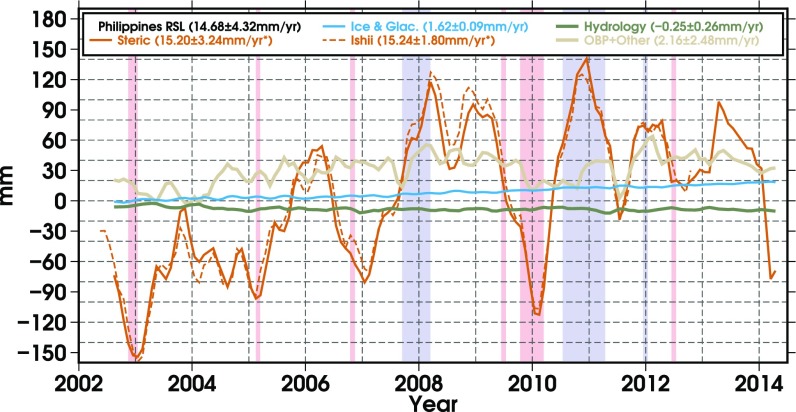
Dividing the sea-level budget into contributions from ice sheets and glaciers, the water cycle, steric expansion, and crustal movement is challenging, especially on regional scales. Here, Gravity Recovery And Climate Experiment (GRACE) gravity observations and sea-level anomalies from altimetry are used in a joint inversion, ensuring a consistent decomposition of the global and regional sea-level rise budget. Over the years 2002-2014, we find a global mean steric trend of 1.38 ± 0.16 mm/y, compared with a total trend of 2.74 ± 0.58 mm/y. This is significantly larger than steric trends derived from in situ temperature/salinity profiles and models which range from 0.66 ± 0.2 to 0.94 ± 0.1 mm/y. Mass contributions from ice sheets and glaciers (1.37 ± 0.09 mm/y, accelerating with 0.03 ± 0.02 mm/y(2)) are offset by a negative hydrological component (-0.29 ± 0.26 mm/y). The combined mass rate (1.08 ± 0.3 mm/y) is smaller than previous GRACE estimates (up to 2 mm/y), but it is consistent with the sum of individual contributions (ice sheets, glaciers, and hydrology) found in literature. The altimetric sea-level budget is closed by coestimating a remaining component of 0.22 ± 0.26 mm/y. Well above average sea-level rise is found regionally near the Philippines (14.7 ± 4.39 mm/y) and Indonesia (8.3 ± 4.7 mm/y) which is dominated by steric components (11.2 ± 3.58 mm/y and 6.4 ± 3.18 mm/y, respectively). In contrast, in the central and Eastern part of the Pacific, negative steric trends (down to -2.8 ± 1.53 mm/y) are detected. Significant regional components are found, up to 5.3 ± 2.6 mm/y in the northwest Atlantic, which are likely due to ocean bottom pressure variations.
Keywords: GRACE; altimetry; budget; sea level; steric.
Conflict of interest statement
The authors declare no conflict of interest.
Figures
References
-
- Stocker TF, et al. Intergovernmental Panel on Climate Change, Working Group I Contribution to the IPCC Fifth Assessment Report (AR5) Cambridge Univ Press; New York: 2013. Climate change 2013: The physical science basis.
-
- Nicholls RJ, Cazenave A. Sea-level rise and its impact on coastal zones. Science. 2010;328(5985):1517–1520. - PubMed
-
- Church JA, White NJ. Sea-level rise from the late 19th to the early 21st century. Surv Geophys. 2011;32(4):585–602.
-
- Hay CC, Morrow E, Kopp RE, Mitrovica JX. Probabilistic reanalysis of twentieth-century sea-level rise. Nature. 2015;517(7535):481–484. - PubMed
-
- Jevrejeva S, Moore J, Grinsted A, Woodworth P. Recent global sea level acceleration started over 200 years ago? Geophys Res Lett. 2008;35(8):L08715.
Publication types
LinkOut - more resources
Full Text Sources
Other Literature Sources
