

A simulation study of sample size for DNA barcoding
- PMID: 26811761
- PMCID: PMC4717336
- DOI: 10.1002/ece3.1846
A simulation study of sample size for DNA barcoding
Abstract
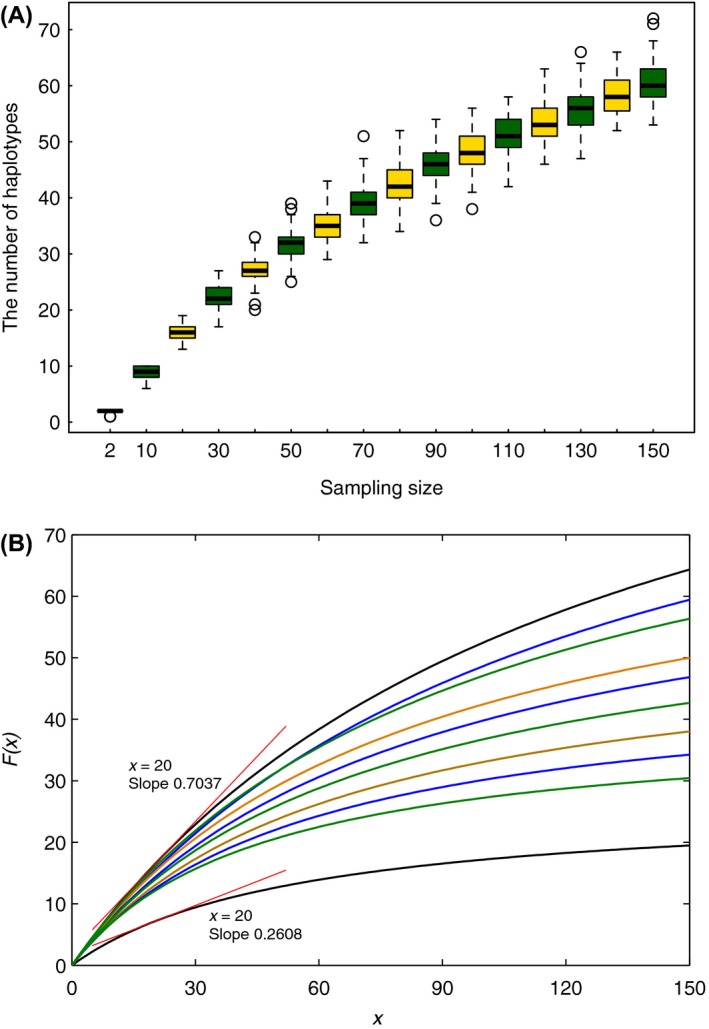
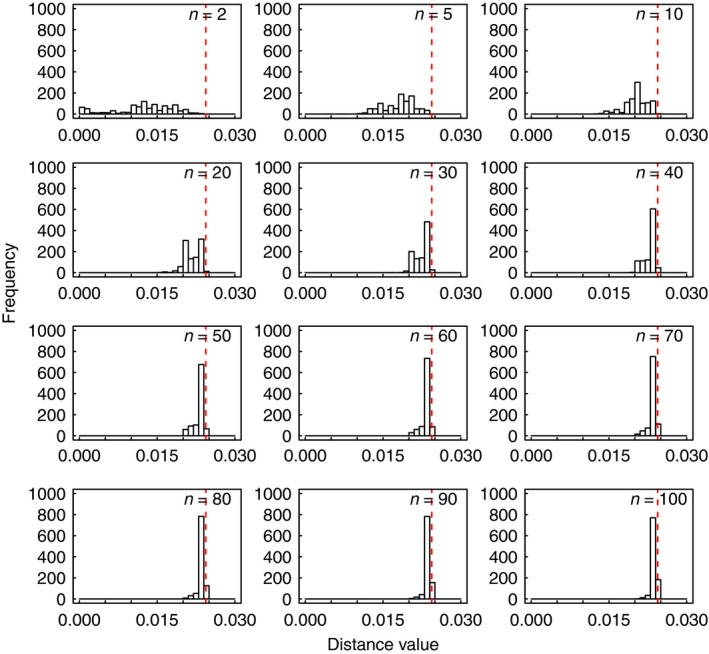
For some groups of organisms, DNA barcoding can provide a useful tool in taxonomy, evolutionary biology, and biodiversity assessment. However, the efficacy of DNA barcoding depends on the degree of sampling per species, because a large enough sample size is needed to provide a reliable estimate of genetic polymorphism and for delimiting species. We used a simulation approach to examine the effects of sample size on four estimators of genetic polymorphism related to DNA barcoding: mismatch distribution, nucleotide diversity, the number of haplotypes, and maximum pairwise distance. Our results showed that mismatch distributions derived from subsamples of ≥20 individuals usually bore a close resemblance to that of the full dataset. Estimates of nucleotide diversity from subsamples of ≥20 individuals tended to be bell-shaped around that of the full dataset, whereas estimates from smaller subsamples were not. As expected, greater sampling generally led to an increase in the number of haplotypes. We also found that subsamples of ≥20 individuals allowed a good estimate of the maximum pairwise distance of the full dataset, while smaller ones were associated with a high probability of underestimation. Overall, our study confirms the expectation that larger samples are beneficial for the efficacy of DNA barcoding and suggests that a minimum sample size of 20 individuals is needed in practice for each population.
Keywords: Coalescence; haplotype; maximum pairwise distance; mismatch distribution; nucleotide diversity.
Figures
References
-
- Aldous, D. J. 2001. Stochastic models and descriptive statistics for phylogenetic trees, from Yule to today. Stat. Sci. 16:23–34.
-
- Bortolussi, N. , Durand E., Blum M., and Francois O.. 2005. apTreeshape: statistical analysis of phylogenetic tree shape. Bioinformatics 22:363–364. - PubMed
-
- Colless, D. H. 1982. Review of “Phylogenetics: the theory and practice of phylogenetic systematics”. Syst. Zool. 31:100–104.
LinkOut - more resources
Full Text Sources
Other Literature Sources
