

Environmental controls on the distribution and diversity of lentic Chironomidae (Insecta: Diptera) across an altitudinal gradient in tropical South America
- PMID: 26811777
- PMCID: PMC4716524
- DOI: 10.1002/ece3.1833
Environmental controls on the distribution and diversity of lentic Chironomidae (Insecta: Diptera) across an altitudinal gradient in tropical South America
Abstract
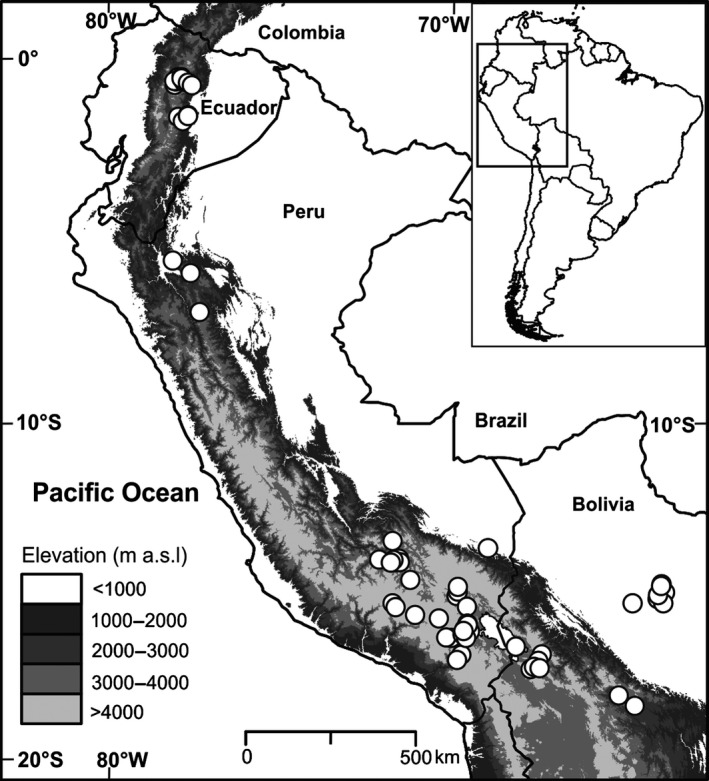
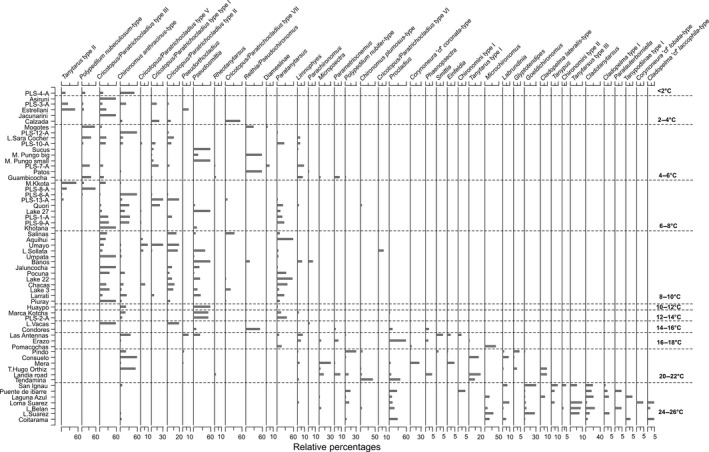
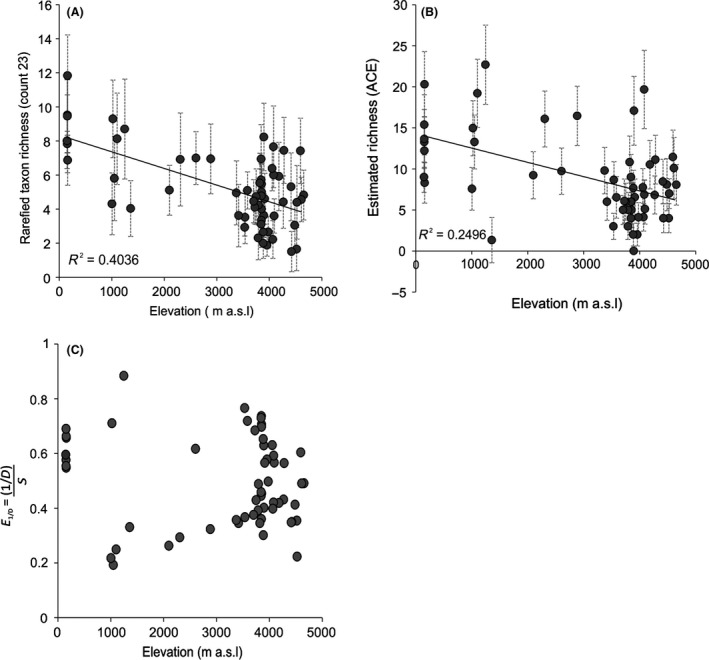
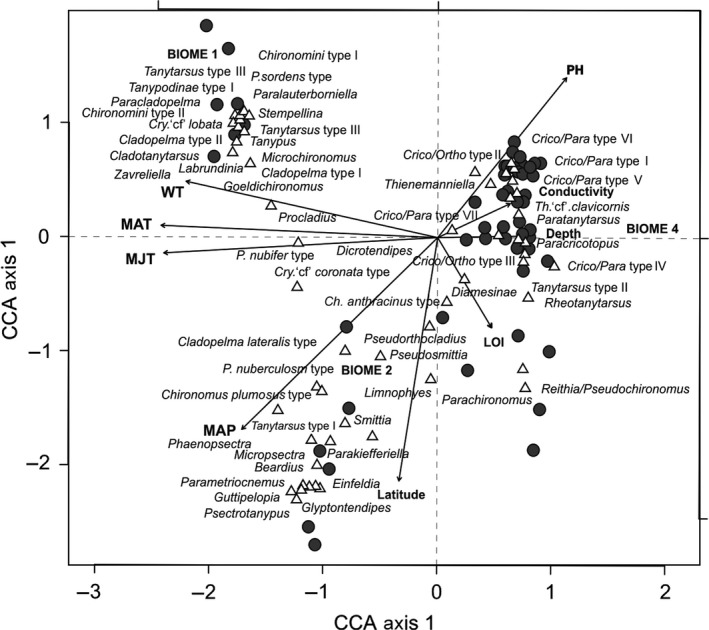
To predict the response of aquatic ecosystems to future global climate change, data on the ecology and distribution of keystone groups in freshwater ecosystems are needed. In contrast to mid- and high-latitude zones, such data are scarce across tropical South America (Neotropics). We present the distribution and diversity of chironomid species using surface sediments of 59 lakes from the Andes to the Amazon (0.1-17°S and 64-78°W) within the Neotropics. We assess the spatial variation in community assemblages and identify the key variables influencing the distributional patterns. The relationships between environmental variables (pH, conductivity, depth, and sediment organic content), climatic data, and chironomid assemblages were assessed using multivariate statistics (detrended correspondence analysis and canonical correspondence analysis). Climatic parameters (temperature and precipitation) were most significant in describing the variance in chironomid assemblages. Temperature and precipitation are both predicted to change under future climate change scenarios in the tropical Andes. Our findings suggest taxa of Orthocladiinae, which show a preference to cold high-elevation oligotrophic lakes, will likely see range contraction under future anthropogenic-induced climate change. Taxa abundant in areas of high precipitation, such as Micropsectra and Phaenopsectra, will likely become restricted to the inner tropical Andes, as the outer tropical Andes become drier. The sensitivity of chironomids to climate parameters makes them important bio-indicators of regional climate change in the Neotropics. Furthermore, the distribution of chironomid taxa presented here is a vital first step toward providing urgently needed autecological data for interpreting fossil chironomid records of past ecological and climate change from the tropical Andes.
Keywords: Andes; chironomids; climate change; diversity; lakes.
Figures


References
-
- Armitage, P.D. (1995) The behaviour and ecology of adults Pp. 194–224 in Armitage P.D., Cranston P.S. and Pinder L.C., eds. The Chironomidae: the biology and ecology of nonbiting midges. Chapman and Hall, London.
-
- Armitage, P. D. , Cranston P. S., and Pinder L. C. V.. 1995. The Chironomidae: the biology and ecology of nonbiting midges. Chapman and Hall, London.
-
- Bellard, C. , Leclerc C., Leroy B., Bakkenes M., Veloz S., Thuiller W., et al. 2014. Vulnerability of biodiversity hotspots to global change. Glob. Ecol. Biogeogr. 23:1376–1386.
-
- Benke, A. 1998. Production dynamics of riverine chironomids: extremely high biomass turnover rates of primary consumers. Ecology 79:899–910.
-
- Bradley, R. S. , Keimig F. T., and Diaz H. F.. 2004. Projected temperature changes along the American cordillera and the planned GCOS network. Geophys. Res. Lett. 31:2–5.
LinkOut - more resources
Full Text Sources
Other Literature Sources
Miscellaneous
