

Trends in Socioeconomic Inequalities in Body Mass Index, Underweight and Obesity among English Children, 2007-2008 to 2011-2012
- PMID: 26812152
- PMCID: PMC4727904
- DOI: 10.1371/journal.pone.0147614
Trends in Socioeconomic Inequalities in Body Mass Index, Underweight and Obesity among English Children, 2007-2008 to 2011-2012
Abstract
Background: Socioeconomic inequalities in childhood obesity have been reported in most developed countries, with obesity more common in deprived groups. Whether inequalities are found in the prevalence of underweight, the rest of the body mass index (BMI) distribution, or have changed across time is not clear.
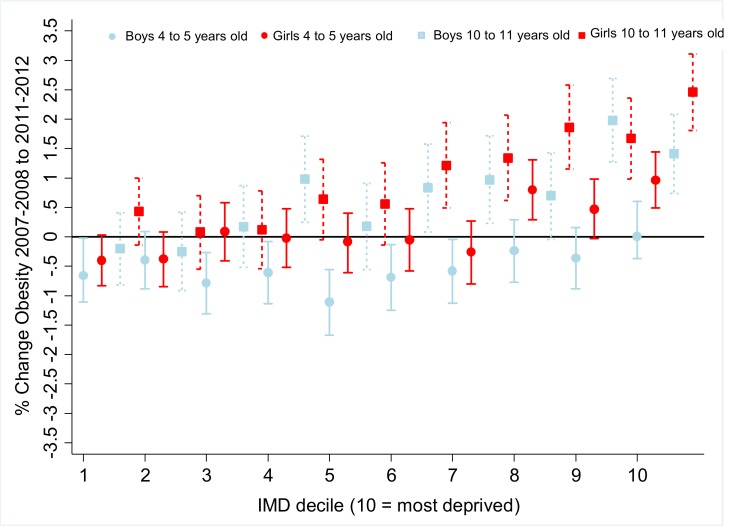
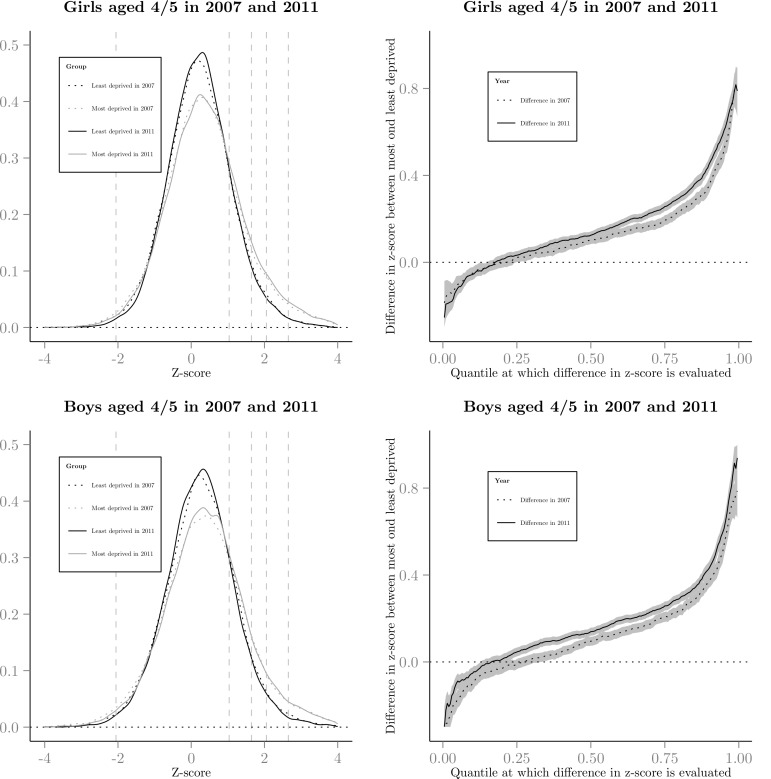
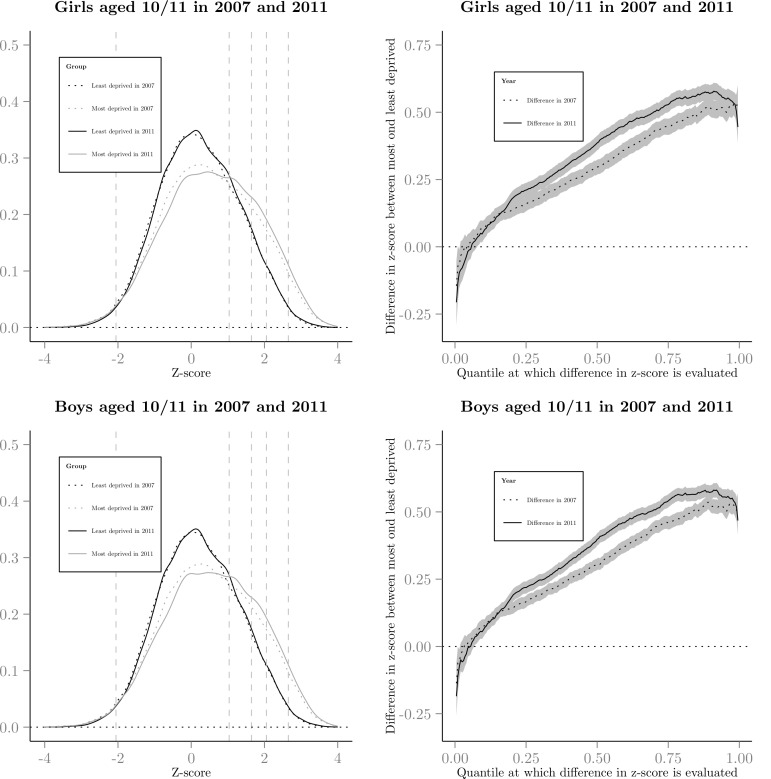
Methods and findings: The sample comprised 5,027,128 children on entry (4 to 5 years old) and leaving (10 to 11 years) state primary (elementary) school who participated in the National Child Measurement Programme (England, United Kingdom). We used area-level deprivation (Indices of Multiple Deprivation at the lower super output area) as a measure of socioeconomic deprivation. From 2007-2008 to 2011-2012 inequalities in obesity between the most compared to least deprived group increased (from 7.21% to 8.30%; p<0.001), whereas inequalities in the prevalence of underweight (1.50% to 1.21%; p = 0.15) were stable during this period. There were no differences by age group or by sex, but a three-way interaction suggested inequalities in obesity had increased at a faster rate for 10 to 11 year old girls, than 4 to 5 year old boys, (2.03% vs 0.07%; p<0.001 for interaction). Investigating inequalities across the distribution of zBMI showed increases in mean zBMI (0.18 to 0.23, p<0.001) could be attributed to increases in inequalities between the 50th and 75th centiles of BMI. Using the 2011 to 2012 population attributable risk estimates, if inequalities were halved, 14.04% (95% CI 14.00% to 14.07%) of childhood obesity could be avoided.
Conclusions: Socioeconomic inequalities in childhood obesity and zBMI increased in England between 2007-2008 and 2011-2012. Inequalities in the prevalence of underweight did not change. Traditional methods of examining inequalities only at the clinical thresholds of overweight and obesity may have led the magnitude of inequalities in childhood BMI to be underestimated.
Conflict of interest statement
Figures
Similar articles
-
Trends in socioeconomic inequalities in underweight and obesity in 5-year-old children, 2011-2018: a population-based, repeated cross-sectional study.BMJ Open. 2021 Mar 19;11(3):e042023. doi: 10.1136/bmjopen-2020-042023. BMJ Open. 2021. PMID: 33741661 Free PMC article.
-
Worldwide trends in body-mass index, underweight, overweight, and obesity from 1975 to 2016: a pooled analysis of 2416 population-based measurement studies in 128·9 million children, adolescents, and adults.Lancet. 2017 Dec 16;390(10113):2627-2642. doi: 10.1016/S0140-6736(17)32129-3. Epub 2017 Oct 10. Lancet. 2017. PMID: 29029897 Free PMC article.
-
Understanding local ethnic inequalities in childhood BMI through cross-sectional analysis of routinely collected local data.BMC Public Health. 2019 Nov 28;19(1):1585. doi: 10.1186/s12889-019-7870-2. BMC Public Health. 2019. PMID: 31779606 Free PMC article.
-
WHO European Childhood Obesity Surveillance Initiative 2008: weight, height and body mass index in 6-9-year-old children.Pediatr Obes. 2013 Apr;8(2):79-97. doi: 10.1111/j.2047-6310.2012.00090.x. Epub 2012 Sep 21. Pediatr Obes. 2013. PMID: 23001989
-
[Body mass index among children and adolescents: prevalences and distribution considering underweight and extreme obesity : Results of KiGGS Wave 2 and trends].Bundesgesundheitsblatt Gesundheitsforschung Gesundheitsschutz. 2019 Oct;62(10):1225-1234. doi: 10.1007/s00103-019-03015-8. Bundesgesundheitsblatt Gesundheitsforschung Gesundheitsschutz. 2019. PMID: 31529189 Review. German.
Cited by
-
Fast food proximity and weight gain in childhood and adolescence: Evidence from Great Britain.Health Econ. 2024 Mar;33(3):449-465. doi: 10.1002/hec.4770. Epub 2023 Nov 16. Health Econ. 2024. PMID: 37971895 Free PMC article.
-
Reversal of the Upward Trend of Obesity in Boys, but Not in Girls, in Spain.Int J Environ Res Public Health. 2021 Feb 14;18(4):1842. doi: 10.3390/ijerph18041842. Int J Environ Res Public Health. 2021. PMID: 33672817 Free PMC article.
-
Understanding America: Unequal Economic Returns of Years of Schooling in Whites and Blacks.World J Educ Res. 2020;7(2):78-92. doi: 10.22158/wjer.v7n2p78. World J Educ Res. 2020. PMID: 32582861 Free PMC article.
-
Early life risk factors and their cumulative effects as predictors of overweight in Spanish children.Int J Public Health. 2018 May;63(4):501-512. doi: 10.1007/s00038-018-1090-x. Epub 2018 Mar 16. Int J Public Health. 2018. PMID: 29549397
-
Modelling future trajectories of obesity and body mass index in England.PLoS One. 2021 Jun 2;16(6):e0252072. doi: 10.1371/journal.pone.0252072. eCollection 2021. PLoS One. 2021. PMID: 34077469 Free PMC article.
References
Publication types
MeSH terms
Grants and funding
LinkOut - more resources
Full Text Sources
Other Literature Sources
Medical
