

Review
doi: 10.1021/acs.chemrev.5b00484.
Epub 2016 Jan 26.
The Halogen Bond
Affiliations
- PMID: 26812185
- PMCID: PMC4768247
- DOI: 10.1021/acs.chemrev.5b00484
Item in Clipboard
Review
The Halogen Bond
Chem Rev.
.
Abstract
The halogen bond occurs when there is evidence of a net attractive interaction between an electrophilic region associated with a halogen atom in a molecular entity and a nucleophilic region in another, or the same, molecular entity. In this fairly extensive review, after a brief history of the interaction, we will provide the reader with a snapshot of where the research on the halogen bond is now, and, perhaps, where it is going. The specific advantages brought up by a design based on the use of the halogen bond will be demonstrated in quite different fields spanning from material sciences to biomolecular recognition and drug design.
Conflict of interest statement
The authors declare no competing financial interest.
Figures
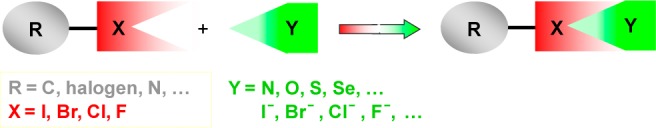
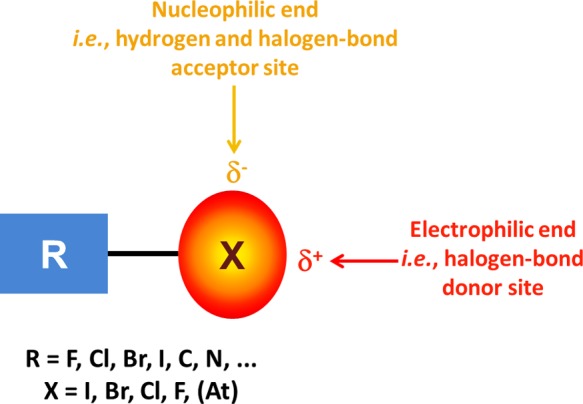
Schematic representation of the halogen bond.
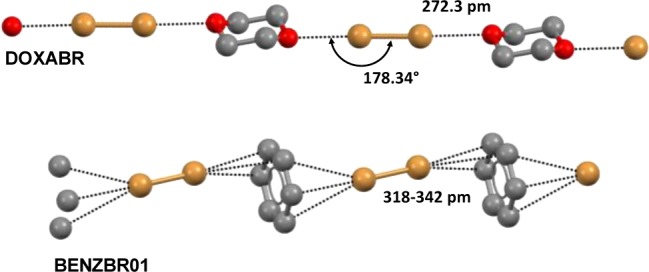
Ball-and-stick
representation (Mercury 3.3) of the Br2···O(CH2CH2)2O (top) and Br2···C6H6 (bottom) adducts.
Both adducts contain infinite chains formed by dibromine as the bidentate
XB donor and dioxane, or benzene, as the bidentate XB acceptor. Color
code: carbon, gray; oxygen, red; bromine, light brown. XBs are dotted
black lines. Hydrogen atoms are omitted for clarity. CSD Refcodes
are reported. Reprinted with permission from ref (63). Copyright 2015 Springer.
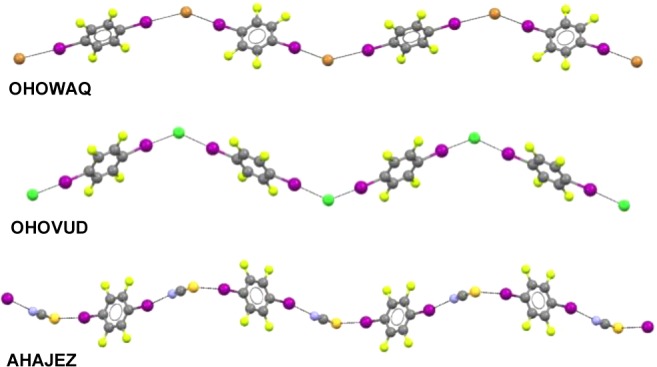
Ball-and-stick representation
(Mercury 3.3) of the halogen-bonded
infinite chains containing 1,4-diiodotetrafluorobenzene as the bidentate
XB donor and n-Bu4N+Br– (OHOWAQ),n-Bu4N+Cl– (OHOVUD), and n-Bu4N+SCN– (AHAJEZ) as XB
acceptors. Quite similar infinite chains are obtained when n-Bu4P+Br–, Me4N+Br–,n-Bu4P+Cl–, and Me4N+Cl– are used. Cations are omitted for clarity. Color code:
carbon, gray; nitrogen, blue; bromine, light brown; chlorine, light
green, sulfur, dark yellow; fluorine, yellow. XBs are dotted black
lines. CSD Refcodes are reported.
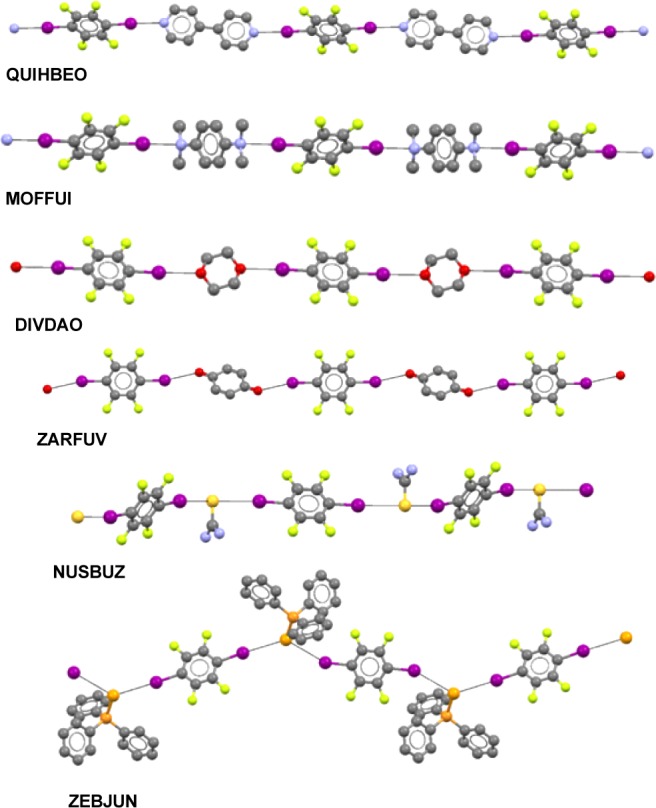
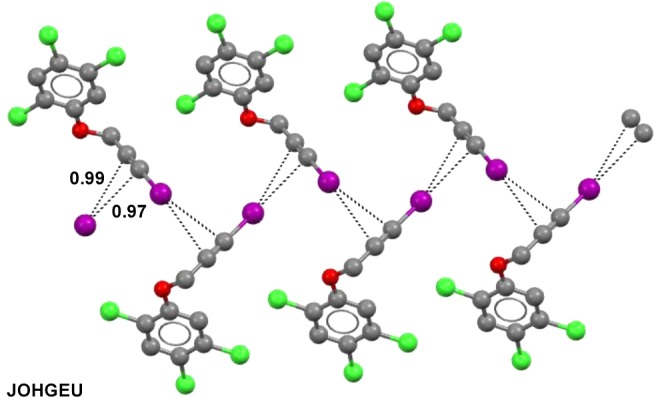
Ball-and-stick representation (Mercury 3.3) of the halogen-bonded
infinite chains containing 1,4-diiodotetrafluorobenzene as the bidentate
XB donor and neutral Lewis bases as bidentate XB acceptors. The selected
Lewis bases are 4,4′-dipyridine (QUIHBEO),N,N,N′,N′-tetramethyl-p-phenylendiamine (MOFFUI), dioxane (DIVDAO), 1,4-benzoquinone (ZARFUV), thiourea (NUSBUZ), and triphenylphosphine
selenide (ZEBJUN). Quite similar infinite
chains are obtained when other nitrogen-centered nucleophiles,−, oxygen-centered nucleophiles, and sulfur-centered nucleophiles are used. Color code: carbon, gray; nitrogen,
blue; oxygen, red; iodine, purple; sulfur, dark yellow; phosphorus,
orange; selenium, dark orange; fluorine, yellow. XBs are dotted black
lines. Hydrogen atoms are omitted for clarity. CSD Refcodes are reported.
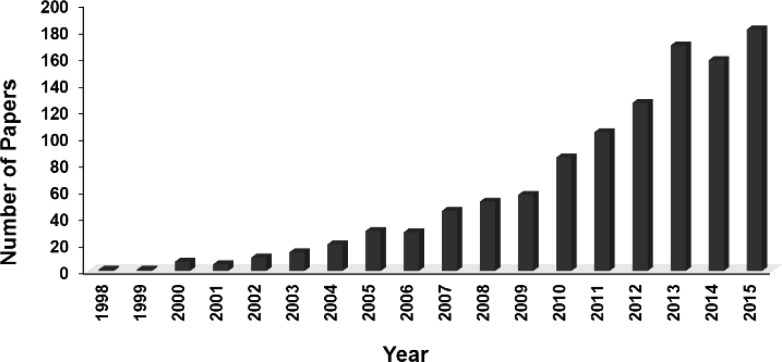
Number of papers per year having “halogen
bonding”
in the title and/or abstract (source SciFinder, search performed in
November 2015).
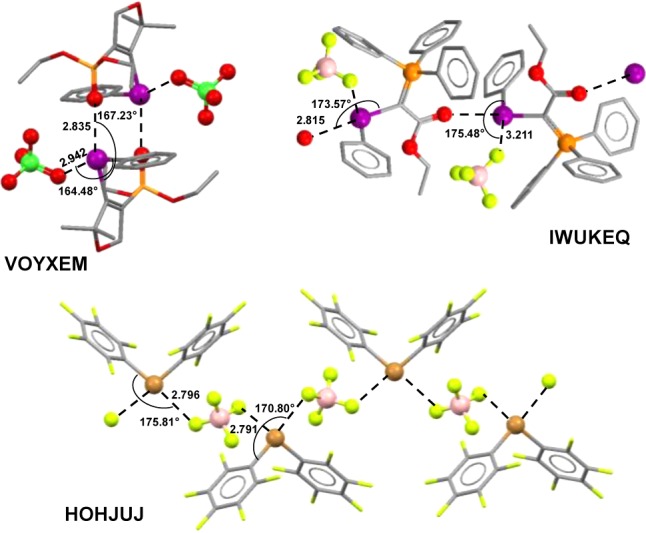
Short and directional XBs existing in halonium salts. Phenyl[2,2-dimethyl-4-(diethylphosphono)-2,5-dihydro-3-furyl]iodonium
perchlorate (VOYXEM): one oxygen of
the phosphonate residue and one oxygen of the perchlorate anion work
as XB acceptors. [2-Ethoxy-2-oxo-1-(triphenyl-λ5-phosphanylidene)ethyl]phenyliodonium
tetrafluoroborate (IWUKEQ): the carbonyl
oxygen of the carbethoxy residue and a fluorine atom of the fluoroborate
anion work as XB acceptors. Bis(pentafluorophenyl)bromonium tetrafluoroborate
(HOHJUJ): BF4– works as a bidentate XB acceptor as the XB donor ability of Br is
increased by strong electron-withdrawing residues. Hydrogen atoms
have been omitted, XBs are dashed lines, and the numbers are the C–X···nucleophile
angles (deg) and lengths of the halogen bonds (Å). Color code:
carbon, gray; oxygen, red; iodine, purple; chlorine, light green;
phosphorus, orange; fluorine, yellow; boron, pink. XBs are dotted
black lines. Hydrogen atoms are omitted for clarity. CSD Refcodes
are reported.
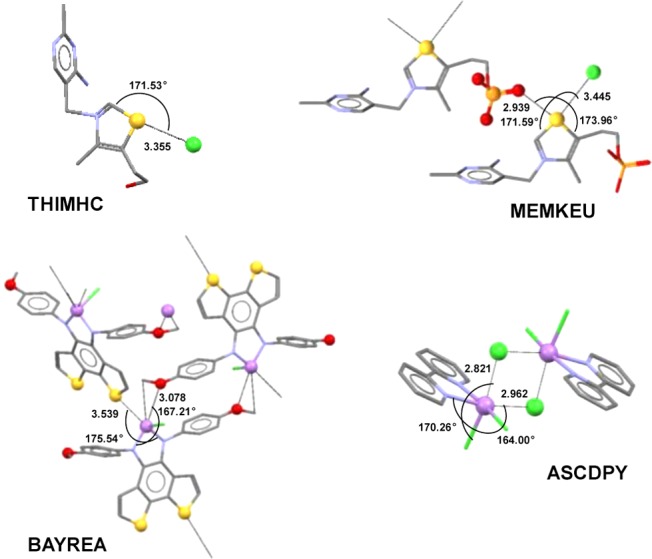
Selected examples
of σ-hole interactions. Short and directional
chalcogen bonds formed in the solid state by the sulfur atom of two
derivatives of thiamin, a vitamin of the B complex, on the elongation
of one (THIMHC) or both (MEMKEU) of its covalent bonds. Pnicogen bonds formed
by arsenic atoms in 2-chloro-1,3-bis(4-methoxyphenyl)-2,3-dihydro-1H-bisthieno[3,2-e:2′,3′-g][1,3,2]benzodiazarsole (BAYREA) and arsenic trichloride dipyridyl (ASCDPY). Hydrogen atoms are omitted for clarity, chalcogen and pnicogen
bonds are dotted lines, and the numbers are the angles (deg) and lengths
of the chalcogen and pnicogen bonds (Å). Color code: carbon,
gray; nitrogen, blue; oxygen, red; chlorine, light green; sulfur,
dark yellow; phosphorus, orange; arsenic, violet. CSD Refcodes are
reported.
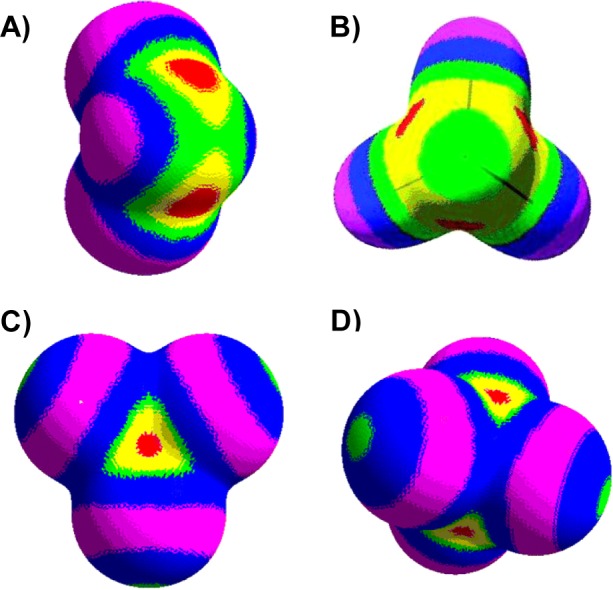
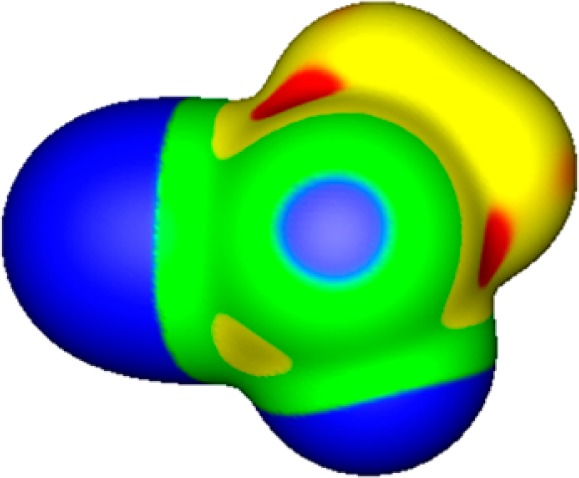
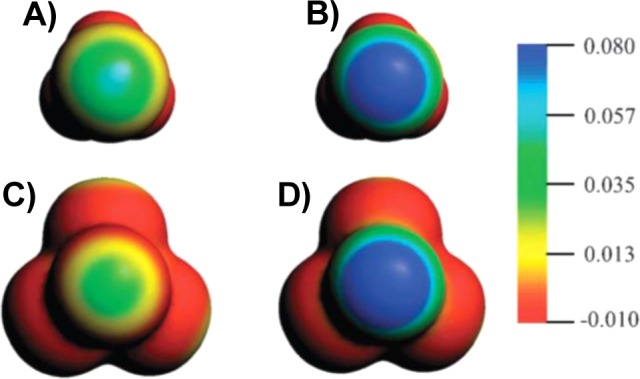
Calculated
B3PW91/6-31G** electrostatic potentials of SCl2 (A), As(CN)3 (B), and SiCl4 (C,
D) computed on the 0.001 electron/bohr3 contour
of the electronic density. (A) SCl2: the sulfur is in the
foreground, and the chlorines are at the back. Color ranges (kcal/mol):
purple, negative; blue, between 0 and 8; green, between 8 and 15;
yellow, between 15 and 20; red, more positive than 20. (B) As(CN)3: the arsenic is in the middle, toward the viewer. Color ranges
(kcal/mol): red, greater than 45; yellow, between 30 and 45; green,
between 15 and 30; blue, between 0 and 15; purple, less than 0 (negative).
(C, D) SiCl4: electron density views of different orientations
of the molecule. In the (C) view three chlorine atoms are toward the
viewer, and the σ-hole, due to the Cl–Si bond to the
fourth chlorine, is in red in the center and on the extension of that
Cl–Si bond. In the (D) view two chlorine atoms are toward the
viewer. Color ranges (kcal/mol): purple, negative; blue, between 0
and 8; green, between 8 and 11; yellow, between 11 and 18; red, more
positive than 18. Panel A adapted with permission from ref (143). Copyright 2008 Springer.
Panel B adapted with permission from ref (133). Copyright 2007 John Wiley and Sons. Panels
C and D adapted with permission from ref (6). Copyright 2008 Springer.
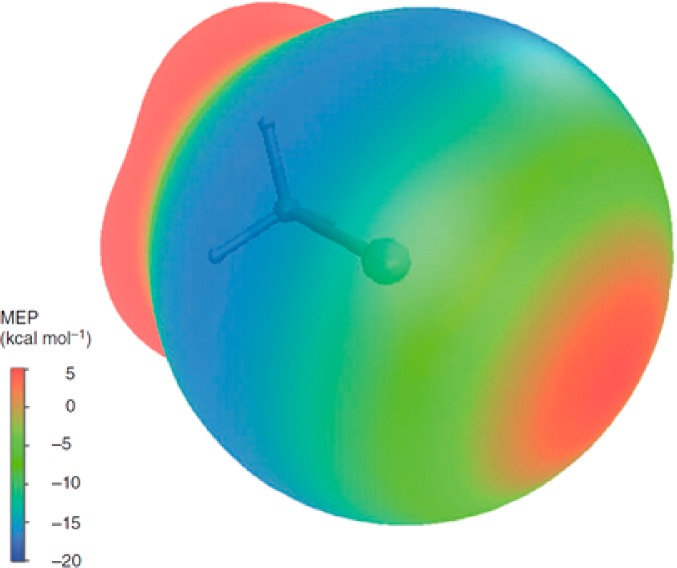
Electrostatic
potential calculated at the M06-2X/aug-cc-pVTZ computational
level on the 0.001 au molecular surface of PF(CH3)(CN). Phosphorus is in the middle facing the viewer, the cyano
group is to the left, the methyl group is to the top right, and fluorine
is to the bottom right. Color ranges: red, greater than 1.26 V; yellow,
from 1.26 to 0.65 V; green, from 0.65 to 0 V; blue, less than 0 V
(negative). Reprinted with permission from ref (144). Copyright 2015 Springer.
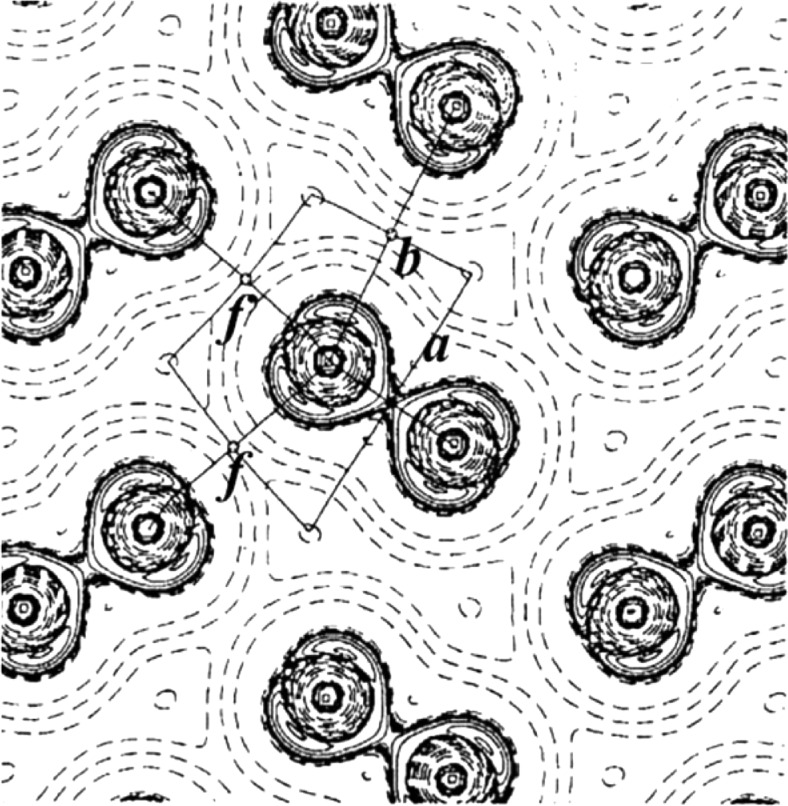
Laplacian distribution for the (100)
plane of solid chlorine, solid
contours denoting negative values for the gradient of electron density.
Reprinted with permission from ref (156). Copyright 1995 International Union of Crystallography.
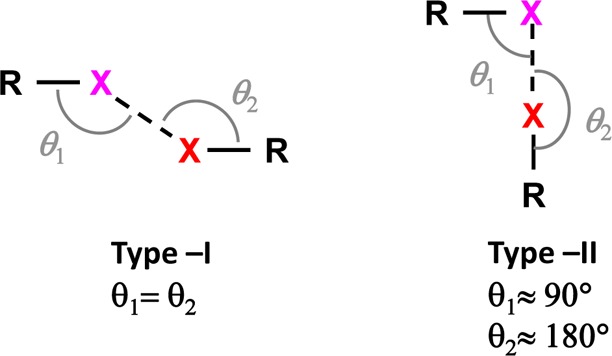
Structural
scheme for type I (left) and type II (right) halogen···halogen
short contacts. X = halogen atom, and R = C, N, O, halogen atom, etc.
Type II contacts are XBs.
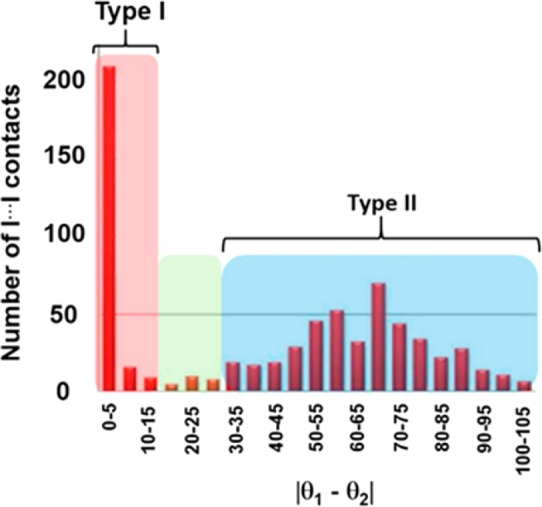
Histogram of I···I contacts and assignment of type
I and type II geometries. Adapted from ref (160). Copyright 2014 American Chemical Society.
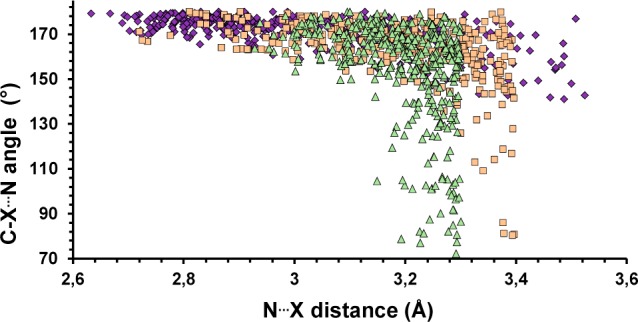
Scatterplot derived from a CSD search
reporting the C–X···N
angle (deg) versus the X···N distance (Å) for
crystal structures containing X···N contacts. Color
code: blue rhombuses, I···N contacts; pink squares,
Br···N contacts; green triangles, Cl···N
contacts. Only error-free and nonpolymeric structures containing single-bonded
I, Br, or Cl atoms and showing no disorder with R < 0.05 are considered.
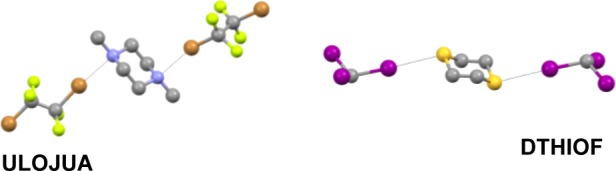
XBs around hexacyclic amines and thioethers feature axial
(left)
and equatorial (right) directions, respectively. XBs are dotted black
lines. Color code: carbon, gray; nitrogen, blue; iodine, purple; bromine,
light brown; sulfur, dark yellow. Hydrogen atoms are omitted for clarity.
CSD Refcodes are reported. In ULOJUA the disorder on 1,2-dibromotetrafluoroethane
is omitted.
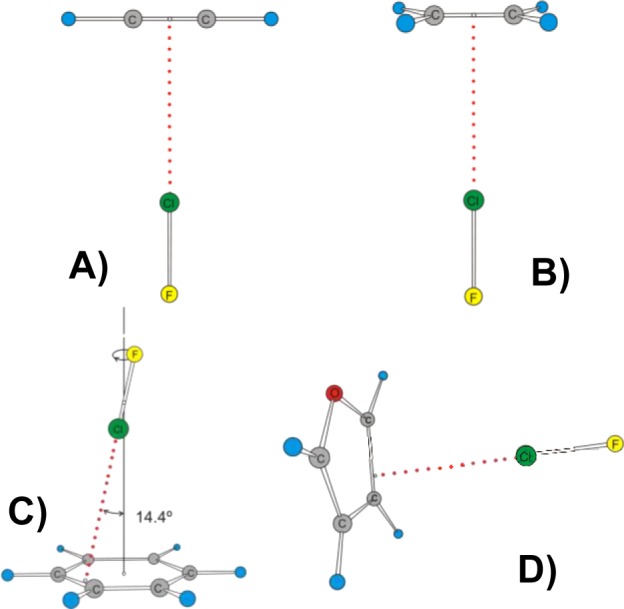
Angular geometries
of complexes formed by FCl with simple π-electron
donors (A) FCl···ethyne and (B) FCl···ethene
and with aromatic π-electron donors (C) FCl···benzene
and (D) FCl···furan.
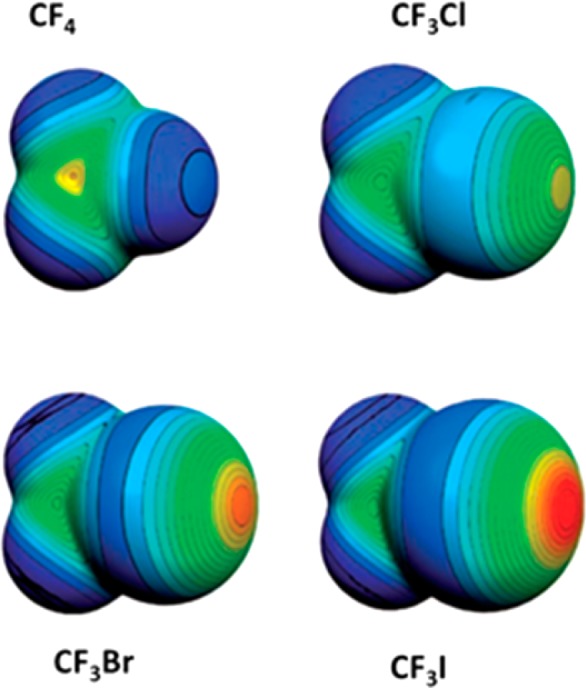
Molecular electrostatic potential at the isodensity
surface with
0.001 au for CF4, CF3Cl, CF3Br, and
CF3I. Color ranges: red, greater than 27 kcal/mol; yellow,
between 20 and 14 kcal/mol; green, between 12 and 6 kcal/mol; blue,
negative. Adapted with permission from ref (145). Copyright 2007 Springer.

Molecular electrostatic potential at the isodensity surface with
0.001 au of F2 and CF3SO2OCOF
(the CF3 group is on top). Color ranges: red, greater than
20 kcal/mol; yellow, between 20 and 9 kcal/mol; green, between 9 and
0 kcal/mol; blue, negative. The black hemispheres denote the positions
of the most positive potentials associated with the fluorine atoms.
Reprinted with permission from ref (195). Copyright 2011 Royal Society of Chemistry.
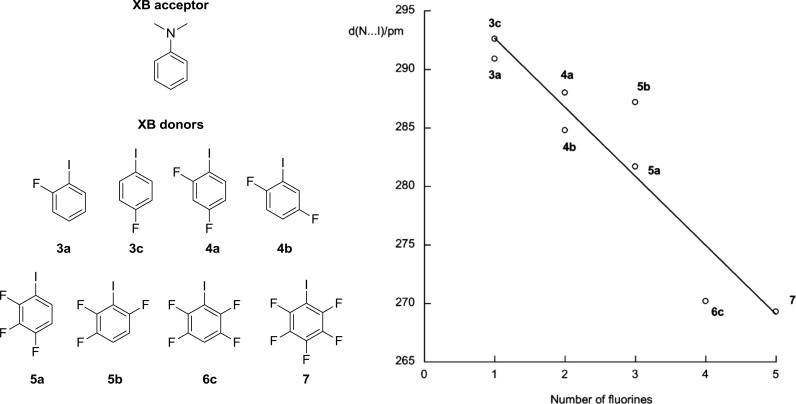
XB donors and XB acceptor and plot of the N···I
separation in the corresponding adducts as a function of the number
of fluorine atoms on the donor. N···I distances are
reported in picometers. Adapted from ref (202). Copyright 2009 American Chemical Society.
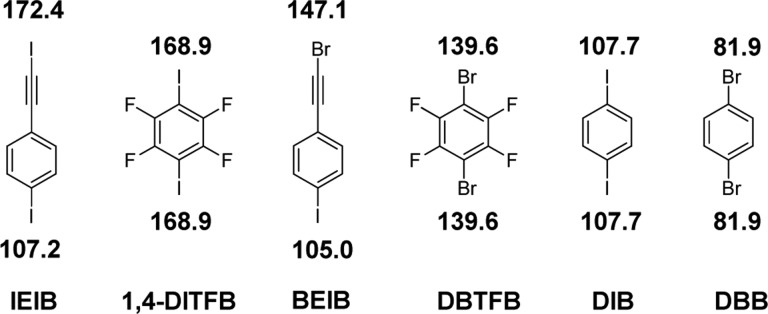
Chemical
structures of C(sp)-bonded XB donors (IEIB and BEIB),
activated C(sp2)-bonded donors (1,4-DITFB and DBTFB), and
nonactivated C(sp2)-bonded donors (DIB and DBB) cocrystallized
using a solvent-drop grinding methodology. The six XB donor molecules
are reported in order of decreasing VS,max values (from left to right) associated with the most positive σ-hole
on their halogen atoms. VS,max values
are the numbers reported near the corresponding atom and are given
in kilojoules per mole. Adapted with permission from ref (209). Copyright 2013 John
Wiley and Sons.
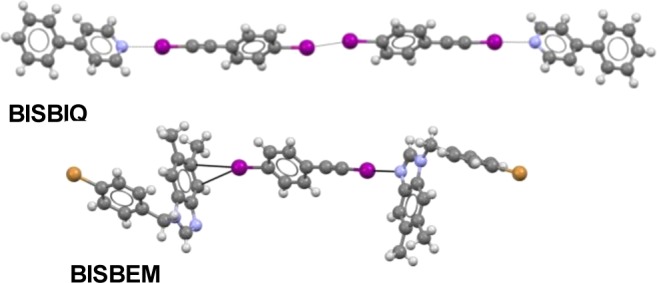
Ball-and-stick representation of the cocrystals
of 1-(iodoethynyl)-4-iodobenzene
with 4-phenylpyridine (BISBIQ) and (bromophenyl)benzimidazole (BISBEM).
XBs, type I iodine···iodine contacts, and iodine···π
interactions are represented as dotted black lines. Color code: carbon,
gray; nitrogen, blue; iodine, purple; bromine, light brown; hydrogen,
white. CSD Refcodes are reported.
Schematic representation of the anisotropic distribution of the
electron density around covalently bound halogen atoms and the pattern
of the resulting interactions.

Computed electrostatic
potentials on 0.001 au molecular surfaces
of (A) chlorobenzene, (B) pentafluorochlorobenzene, (C) bromobenzene,
(D) pentafluorobromobenzene, (E) iodobenzene, and (F) pentafluoroiodobenzene.
Color range (kcal/mol): red, greater than 20; yellow, between 20 and
10; green, between 10 and 0; blue, negative. Black hemispheres denote
the positions of the halogen VS,max. Adapted
with permission from ref (205). Copyright 2011 Springer.

Computed electrostatic potential VS(r) on the 0.001 au surface of F3C–Br
(top) and NC–Br (bottom). For each molecule bromine is at the
right. Color range (kcal/mol): red, more positive than 35; yellow,
20–35; green, 0–20; blue, negative. The position of
the bromine VS.max is indicated as a black
dot. In F3C–Br, the σ-hole is an area of positive
(yellow and green) VS(r) on the outer surface of the bromine; the lateral sides of bromine
are negative (blue) because of the two pairs of electrons in the 4px and 4py orbitals.
In NC–Br the presence on bromine of an electron-withdrawing
substituent stronger than CF3 causes such a polarization
of the charge in the doubly occupied 4px and 4py orbitals of Br that the potential VS(r) becomes positive over
the entire surface of the halogen atom. Adapted with permission from
ref (254). Copyright
2010 John Wiley and Sons.
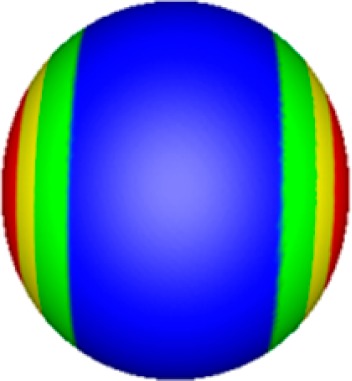
Calculated electrostatic potential on the 0.001
au molecular surface
of a chlorine atom in the s2px2py2pz1 valence state configuration. Color ranges
(V): red, greater than 0.43; yellow, from 0.43 to 0.22; green, from
0.22 to 0; blue, less than 0 (negative). The most positive potentials
on the chlorine surface, shown in red at the left and right, have
a VS,max of 0.95 V. Computational level:
M06-2X/aug-cc-pVTZ. Reprinted with permission from ref (144). Copyright 2015 Springer.
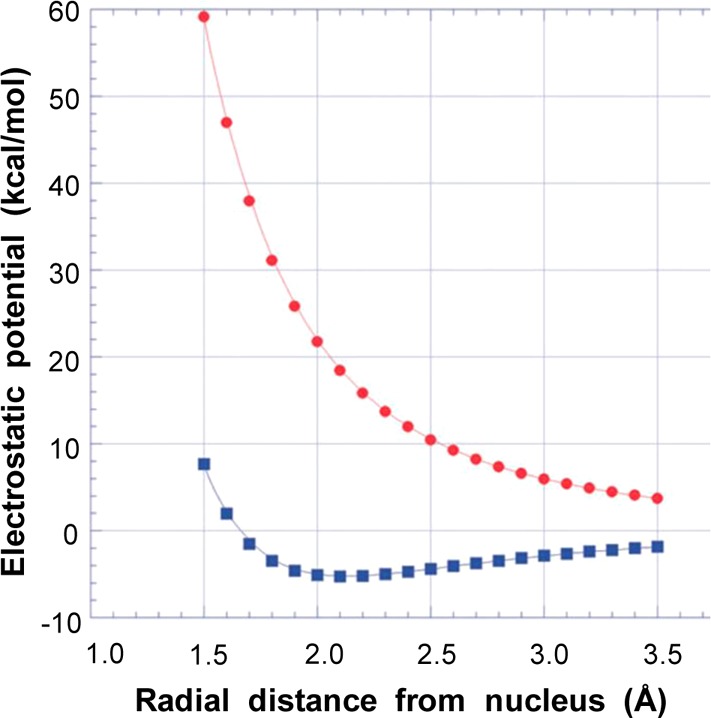
Computed electrostatic potential, B3PW91/6-311G(3d),
of the chlorine
atom in its valence state, 3s23px23py23pz1, as a function of the radial
distance from the nucleus. The upper and red curve corresponds to
the z-axis, the lower and blue curve to the x- and y-axes. In this valence state, V(r) is still positive at all radial distances
along the z-axis, corresponding to the half-filled
pz orbital. Along the x- and y-axes, however, V(r) is positive near the nucleus but then becomes negative,
reflecting the doubly occupied px and
py orbitals. Reprinted with permission
from ref (26). Copyright
2010 Royal Society of Chemistry.
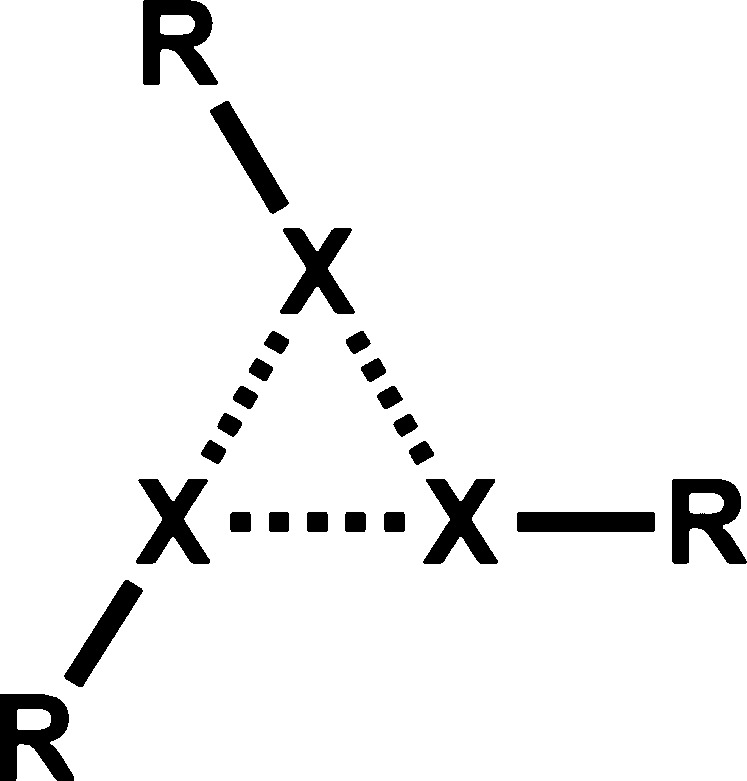
Triangular structure for the (R–X)3 trimer.
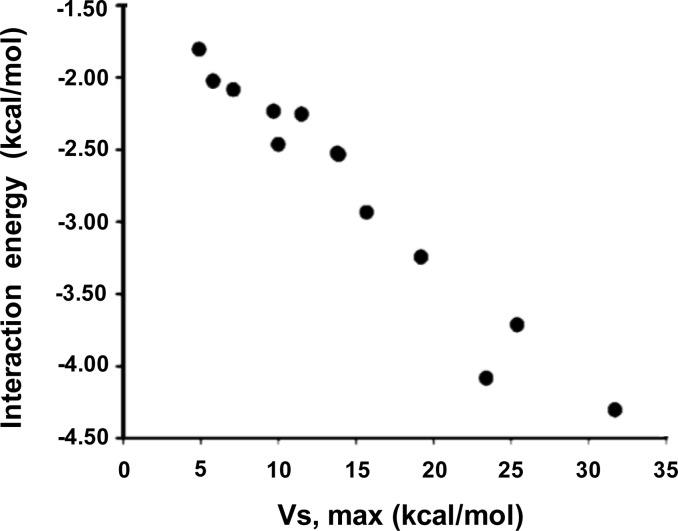
Interaction energy vs
bromine VS,max for 13 Ar—Br···O=C(CH3)2 complexes, where Ar = substituted benzene or
pyrimidine (R = 0.976). Reprinted from ref (257) Copyright 2009 American
Chemical Society.
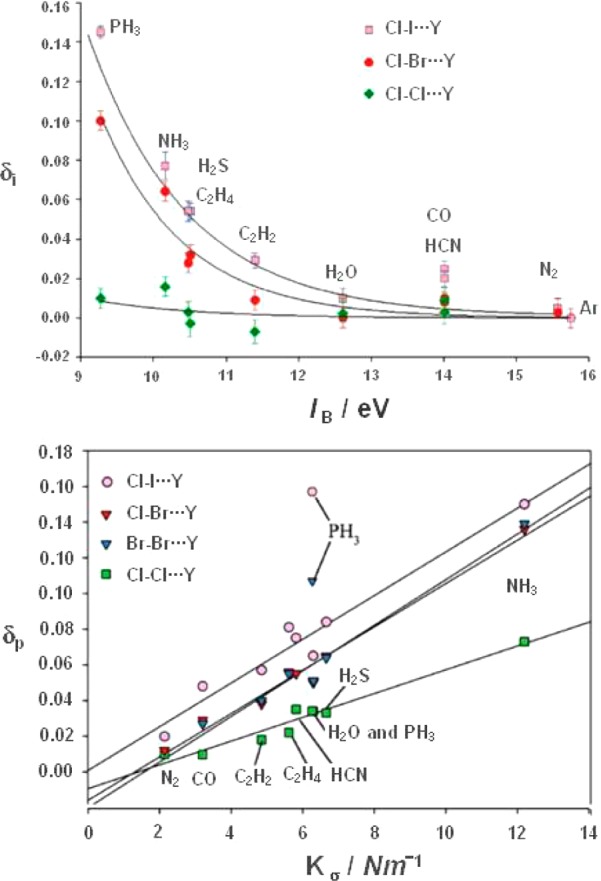
Top: variation of the fraction δi of
an electronic
charge transferred from B to YX on formation of the YX···B
complex with the ionization energy IB of
B for the series YX = Cl2, ClBr, and ClI. Each set of points
can be fitted reasonably well by the function δi = A exp(−aIB), which is
represented as a solid curve on the graph. It is evident that there
is a family relationship among the curves. Bottom: variation of the
fraction δp of an electronic charge transferred from
X to Y on formation of the YX···B complex plotted against
the intermolecular stretching force constant kσ for the series YX = Cl2, Br2,
ClBr, and ClI. The solid line represents the least-squares fit of
the points for each YX···B series for a given YX, and
δp is an approximately linear function of kσ and hence of the strength of the interaction.
Moreover, for a given B δp increases with the polarizabilities
of the interacting atoms X in YX···B.
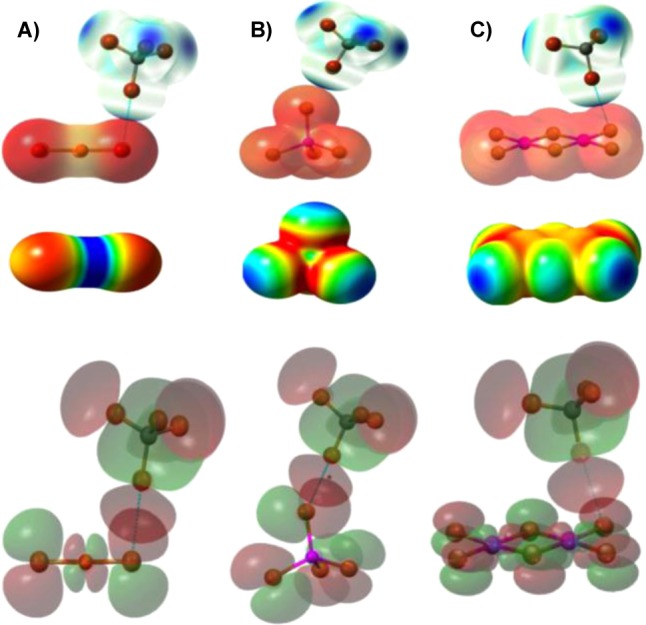
(Top) VS(r) (calculated
at the B3LYP/6-311+G(dp) level on the 0.001 electron/bohr3 molecular surfaces) of the XB donors and acceptors superimposed
onto X-ray structures of their complexes: (A) CBr4/[CuBr2]−; (B) CBr4/[ZnBr4]2–; (C) CBr4/[Pt2Br6]2–. Blue and red colors
depict positive and negative potentials, respectively. (Middle) The
electrostatic potentials of bromometalate anions are negative everywhere,
but noticeable variations of their values are also observed and depicted
with a color gradient from the most negative (red) to the least negative
(blue) values (kcal/mol): (A) [CuBr2]−, from −100 (red) to −80 (blue); (B) [ZnBr4]2–, from −170 (red) to −150 (blue);
(C) [Pt2Br6]2–, from −155
(red) to −125 (blue). (Bottom) MO shapes (B3LYP/6-311+G(dp)
level) of CBr4 and halometalates, superimposed onto crystal
structures of their complexes. HOMOs of bromometalates are mostly
located on the bromide ligands. Adapted from ref (218). Copyright 2012 American
Chemical Society.
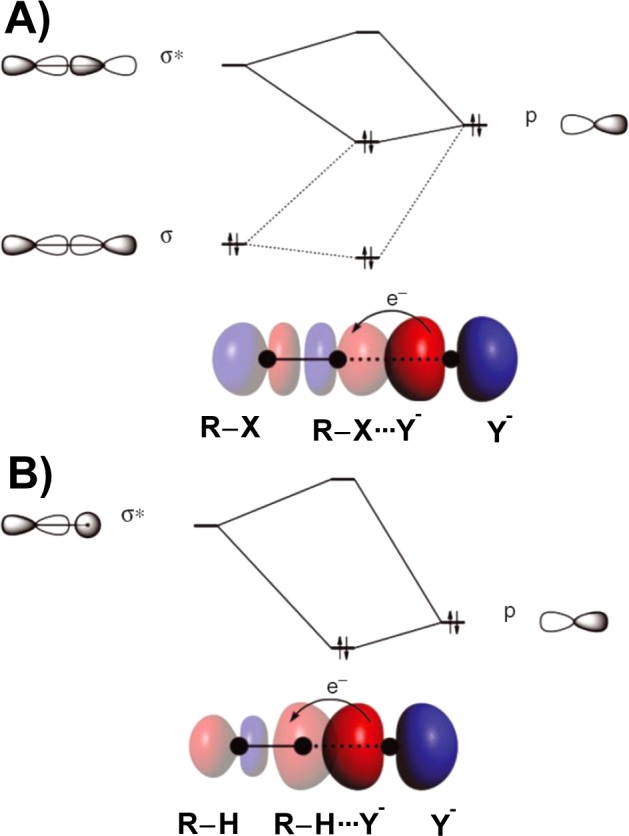
Orbital interaction diagrams for (A) XB and (B) HB arising
in R–X···Y– and R–H···Y– complexes. Only the σ interactions are shown.
Adapted with
permission from ref (219). Copyright 2014 John Wiley and Sons.
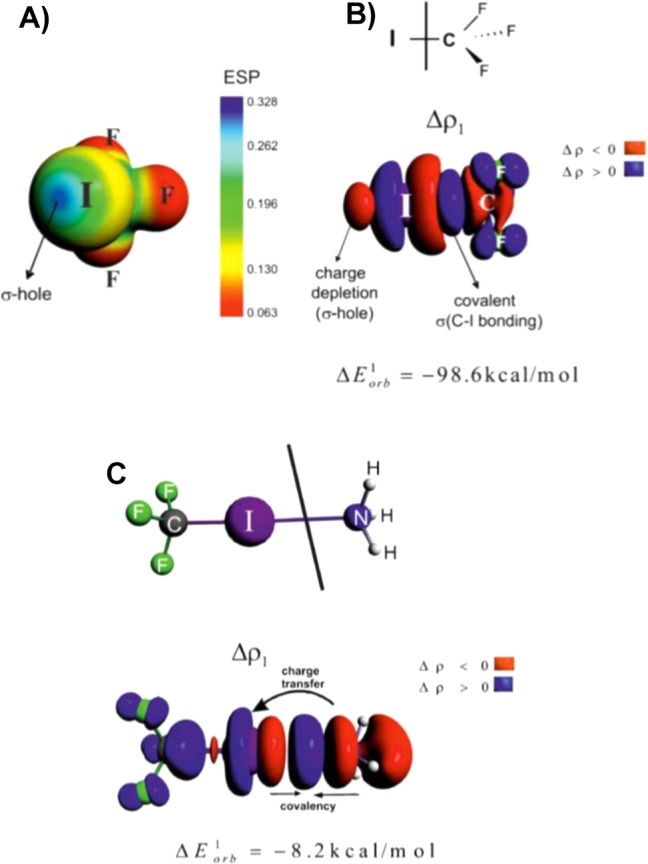
(A) VS(r) of the CF3I molecule and represented in blue
the σ-hole. (B) Visualization
of σ-hole formation using the deformation density contributions
originating from NOCV. The contour of the deformation density contribution
Δρ1 describes the formation of the C–I
bond in the CF3I molecule starting from an iodine atom
and the CF3 radical (each carrying one unpaired electron
with opposite spin polarization). A charge accumulation at iodine
is observed due to formation of the C–I bond, which confirms
significant charge anisotropy around this atom. An outflow of electron
density emerges from the outer area of the iodine atom, which clearly
corresponds to the formation of the σ-hole. The corresponding
ETS-NOCV-based energy is shown. The numerically smallest contour values
are ±0.0006 au. (C) Contour of the deformation density contribution Δρ1 describing the formation of the XB in the CF3I···NH3 complex.
Molecular electrostatic potential at the isodensity surface
of
CF3–I (A) and CI4 (C) at the same contour
value of 0.001 electron/bohr3. The red color shows the
most negative potential, while the blue color represents the most
positive one. The σ-holes of CF3–I (B) and
CI4 (D) in the presence of a 1.0 point charge are also
depicted. Energies are expressed in atomic units. Reprinted with permission
from ref (217). Copyright
2012 Royal Society of Chemistry.
Molecular
electrostatic potential (MEP) calculated at the MP2/aug-cc-pVDZ
level on the 0.001 au isodensity surface of CH3Cl in the
presence of a charge of −0.2692 at a distance of 3.0 Å
from the chlorine atom along the extension of the C–Cl bond.
The MEP on the chlorine reflects the polarization caused by the electric
field of the negative charge, and a region of positive electrostatic
potential (σ-hole) appears on the chlorine surface. Reprinted
with permission from ref (231). Copyright 2015 Wiley and Sons.
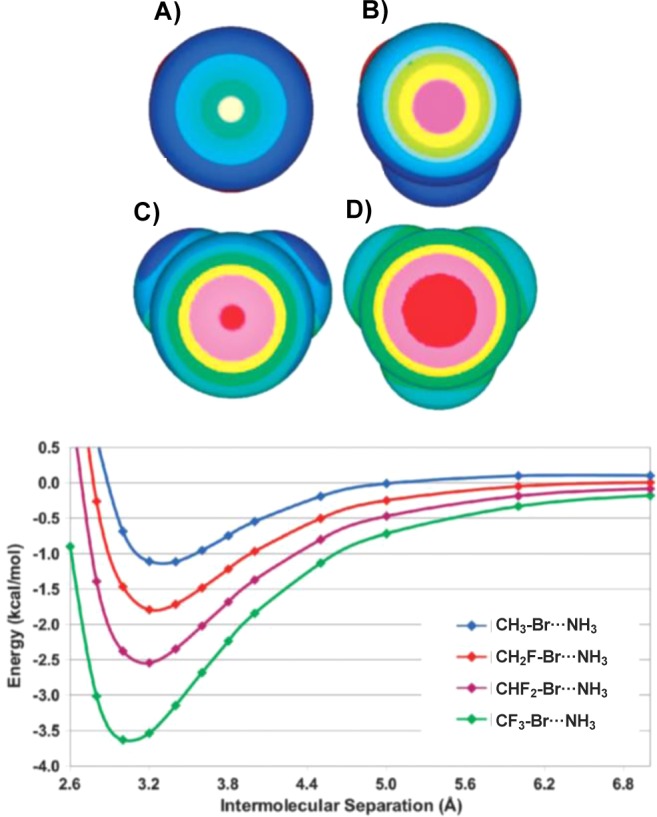
Top: electrostatic potentials of H3C–Br (A),
H2FC–Br (B), HF2C–Br (C), and
F3C–Br (D). Color code: lightest blue, <−5
kcal/mol; intermediate blue, between −5 and −2.5 kcal/mol;
dark blue, between −2.5 and 0 kcal/mol; green, between 0 and
4 kcal/mol; yellow, between 4 and 8 kcal/mol; pink, between 8 and
16 kcal/mol; red, >16 kcal/mol. Bottom: potential energy curves
calculated
at the CCSD(T)/aug-cc-pVTZ level for the four complexes HnF3–nCBr···NH3. Reprinted with permission from ref (278). Copyright 2013 Royal
Society of Chemistry.
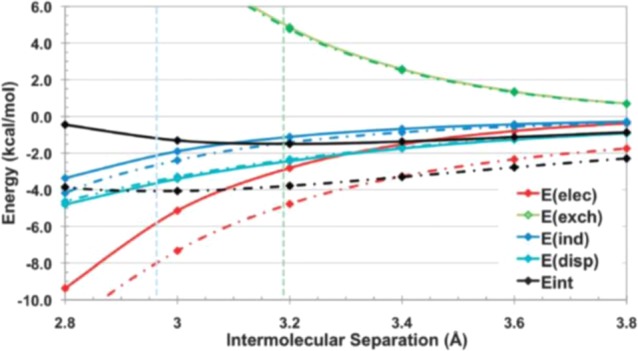
DFT-SAPT components,
electrostatics (E(elec)),
induction or polarization (E(ind)), dispersion (E(disp)), and exchange (E(exch)), and total
binding energies (E(int)T), for the H3CBr···NH3 (solid lines) and F3CBr···NH3 complexes (dashed lines)
(kcal/mol). Potential energy minima are shown as vertical dashed lines.
H3CBr···NH3 is green, and F3CBr···NH3 is light blue. Reprinted
with permission from ref (278). Copyright 2013 Royal Society of Chemistry.
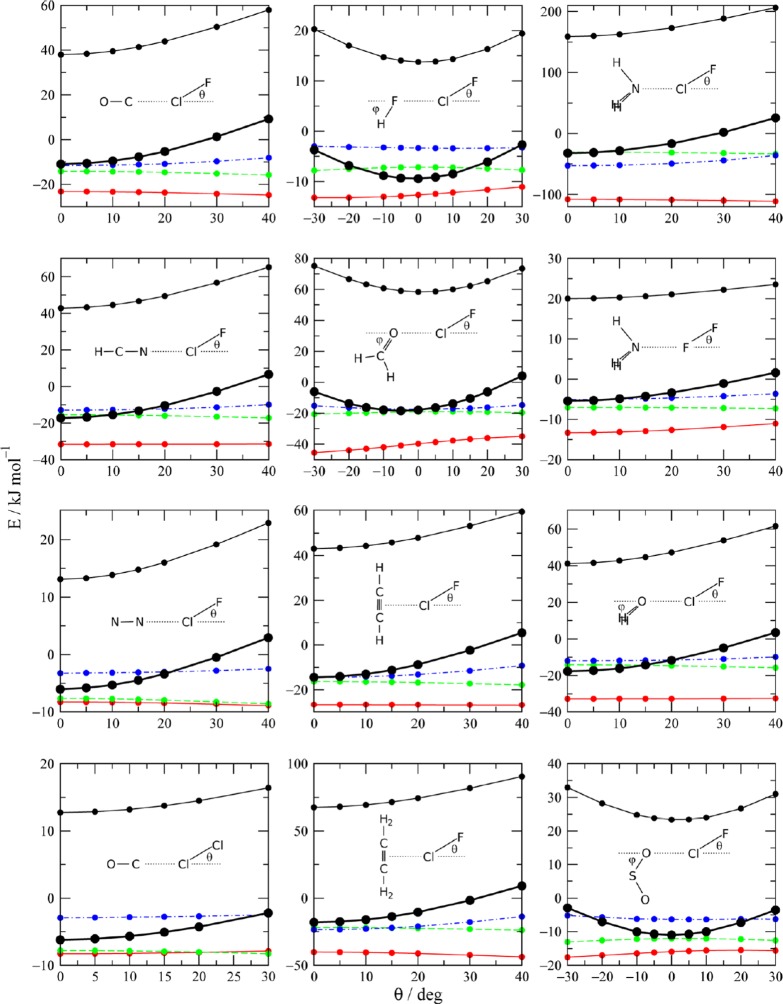
Variation
of energy components with the tilt angle θ of FCl···B
complexes away from linearity (B is the electron donor). The angle
φ was held at 55° for FCl···FH, 69°
for FCl···O=CH2, 0° for FCl···OH2, and 48° for FCl···O2S. The
components are (black solid) exchange repulsion, (red solid) electrostatics,
(green dashed) dispersion, and (blue dashed–dotted) induction.
The heavy black line represents the total. Reprinted from ref (279). Copyright 2013 American
Chemical Society.
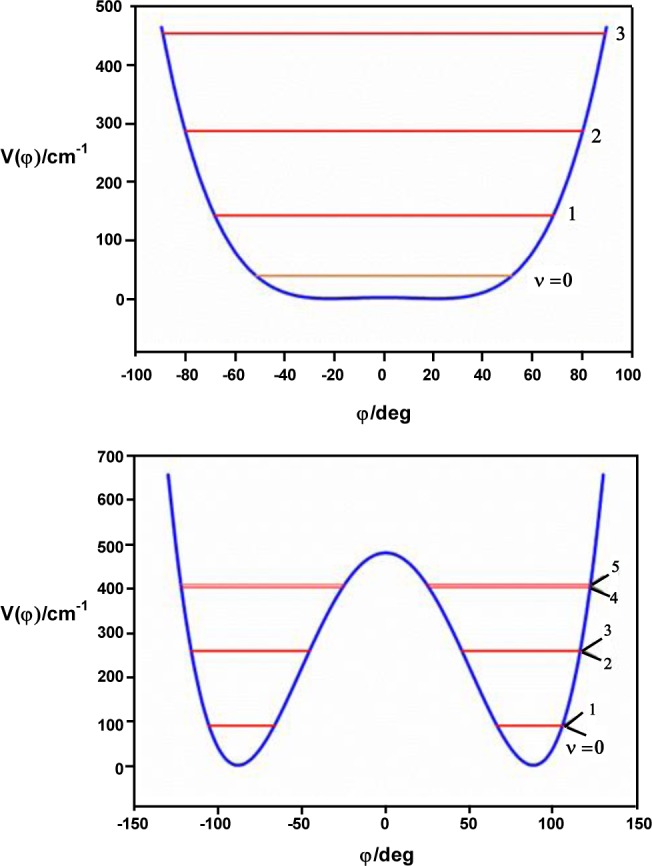
Potential energy V(φ)
of the molecules ClI···OH2 (top) and ClI···SH2 (bottom) as
a function of the angle φ made by the extension of the C2 axis of the H2O and H2S molecules with the I···O and I···S
internuclear axes (as defined in Table 2). Reprinted with permission from ref (188). Copyright 2015 Springer.
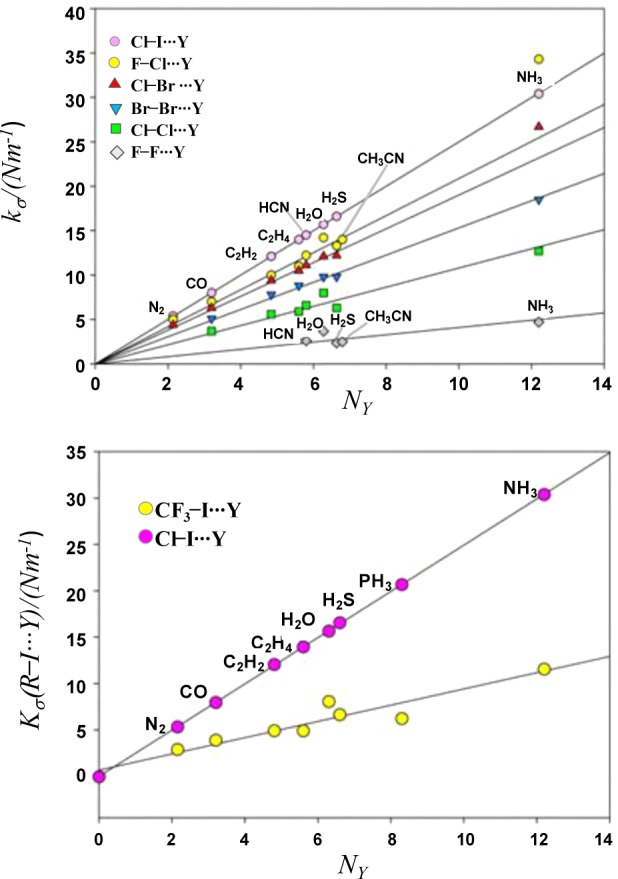
Intermolecular force constant kσ against the nucleophilicity NY of Lewis
bases Y for six series of halogen-bonded complexes RX···Y
(top) and the two series ClI···Y and CF3–I···Y (bottom). The slope of each line yields
the electrophilicity ERX by means of the
expression kσ = cNYERX, and the value c = 0.25 N m–1. Reprinted with permission
from ref (188). Copyright
2015 Springer.
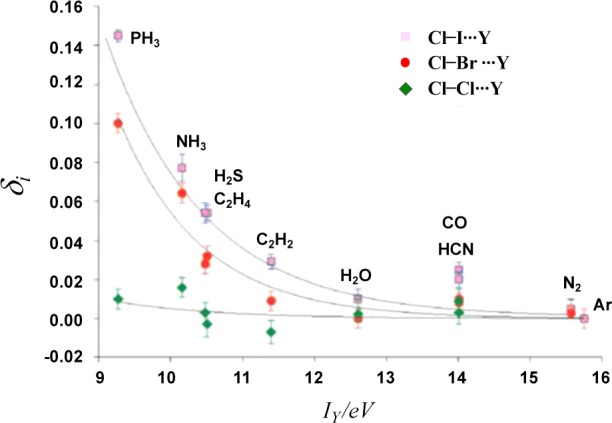
Fraction δi of an electronic charge transferred
from Y to RX upon complexation, plotted versus the ionization energy IY of Y for a series of dihalogen molecules and
fitted with negative exponential curves. Adapted with permission from
ref (273). Copyright
2010 Royal Society of Chemistry.
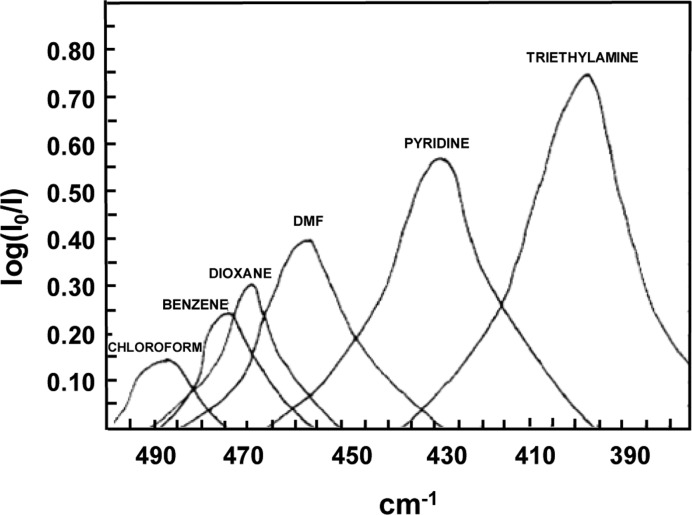
Infrared absorption of the C–I fundamental
stretching frequency
for NC–I and its complexes with the compound reported above
the respective bands. Reprinted from ref (374). Copyright 1959 American Chemical Society.
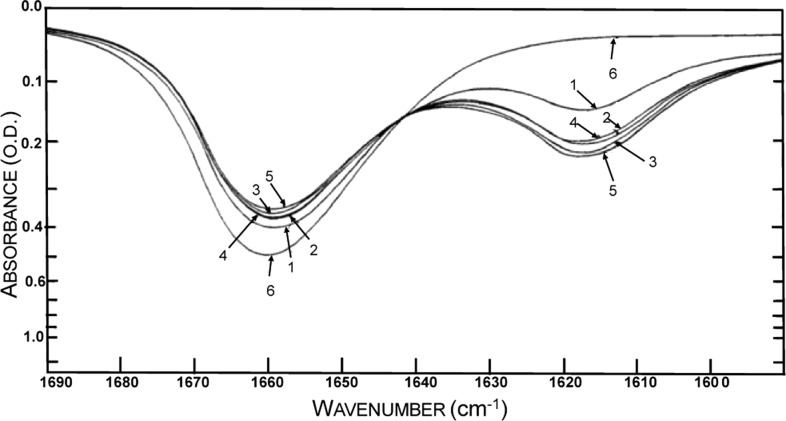
Infrared spectrum of the dimethylacetamide/iodine
complex. As the
I2 concentration increases, the intensity of the free amide
peak (1662 cm–l) decreases, while the intensity
of the complex peak (1619 cm–l) increases. Reprinted
from ref (394). Copyright
1960 American Chemical Society.
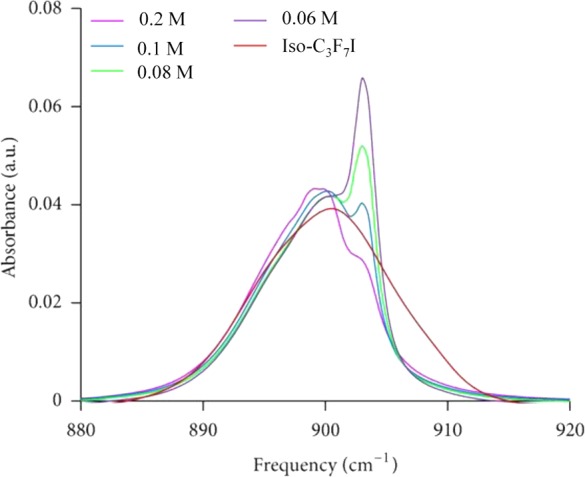
FTIR absorbance of Cα–F bending for heptafluoro-2-iodopropane
in cyclohexane at various dilutions. Reprinted with permission from
ref (408). Copyright
2013 Hindawi Publishing Corp.
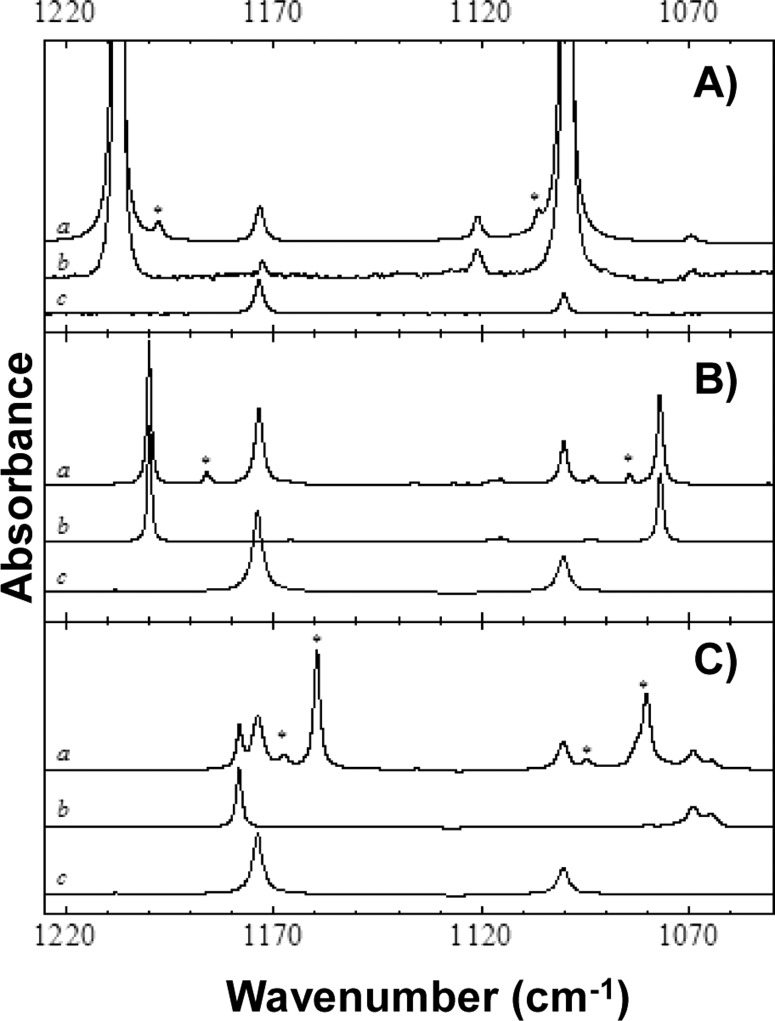
Infrared spectra in
the 1225–1050 cm–1 region for solutions of
mixtures of CF3Cl (A), CF3Br (B), and CF3I (C) with dimethyl ether dissolved
in liquid Ar (89 K). Tracs a in each panel represents the spectrum
of the mixed solutions, while traces b and c are the spectra of the
monomers CF3X and dimethyl ether, respectively. The new
bands assigned to the complex are marked with an asterisk. Reprinted
with permission from ref (410). Copyright 2013 John Wiley & Sons, Inc.
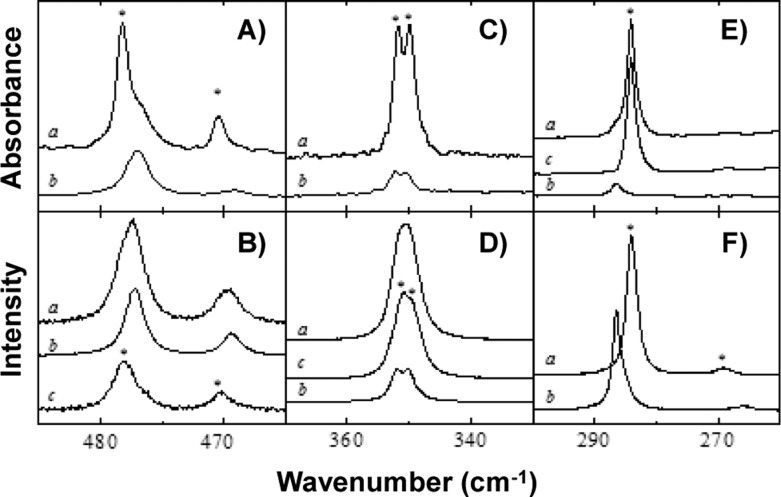
Infrared (A, C, and E) and Raman (B, D, and F) spectra
of the ν3(CF3X) region for solutions of
mixtures of CF3Cl (A, B), CF3Br (C, D), and
CF3I (E,
F) with dimethyl ether dissolved in liquid Ar (89 K). Trace a represents
the spectrum of the mixed solution, trace b is the spectrum of the
monomer CF3X, and trace c is the spectrum of the complex,
obtained by subtracting trace b from trace a. The new bands assigned
to the complex are marked with an asterisk. Reprinted with permission
from ref (410). Copyright
2013 John Wiley & Sons, Inc.
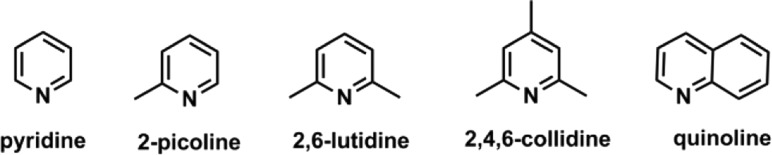
Pyridyl compounds used in the study of
Schuster and Roberts.
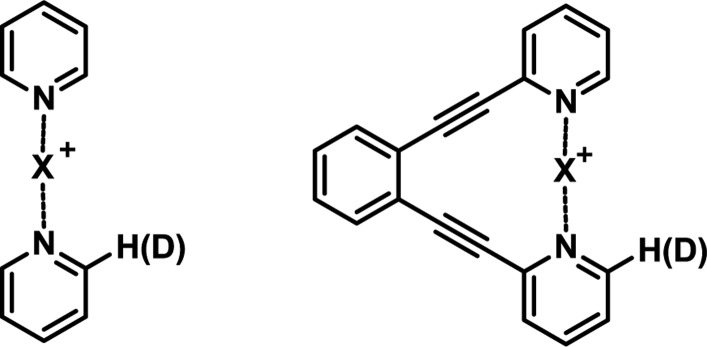
Structure
of [bis(pyridine)iodine]+ complexes used to
study the symmetry of halonium XBs in solution. The bis(pyridinylethynyl)benzene
was exploited to introduce a restraint to the complex geometry.
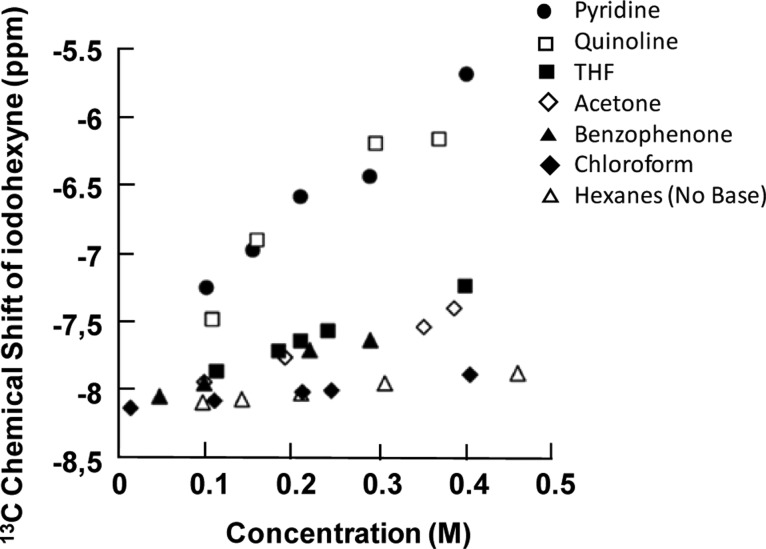
13C chemical
shift of the C–I carbon of 1-iodo-1-hexyne
as a function of the concentration of an n-donor compound in hexanes.
The concentrations of the iodohexyne and the n-donor were kept approximately
equal. Reprinted from ref (398) Copyright 2004 American Chemical Society.
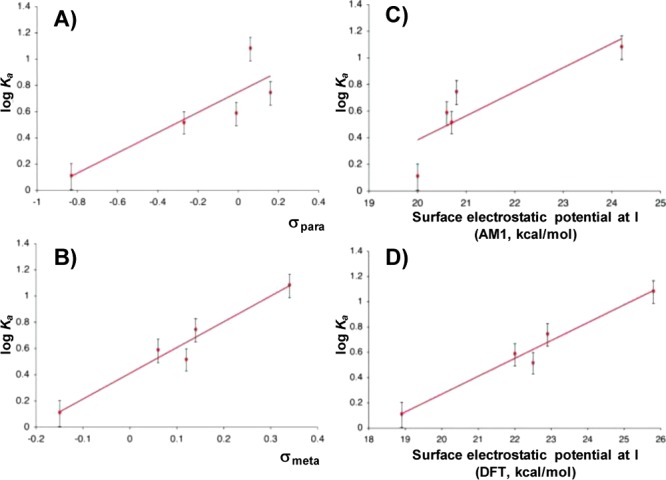
Correlation
of the log Ka for the halogen-bonded
adducts 4-X-C6F4—I···O=PBu3 with the (A) σpara and
(B) σmeta substituent constants
of X and with the electrostatic potential at the iodine atom, calculated
with the (C) AM1 and (D) DFT (B3LYP/6-31+G**-LANLdp) computational
methods. Adapted from ref (454). Copyright 2010 American Chemical Society.
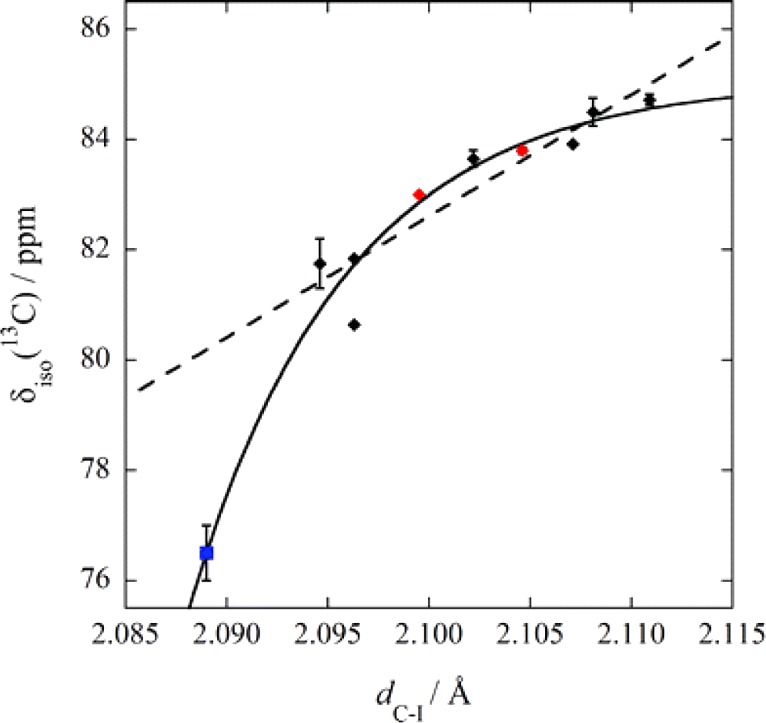
13C SSNMR chemical shift as a function of the
C–I
distance for several diiodotetrafluorobenzene complexes with ammonium
and phosphonium salts. The solid line represents the best exponential
fit, while the dashed line represents a linear fit. Reproduced with
permission from ref (74). Copyright 2013 Royal Society of Chemistry.
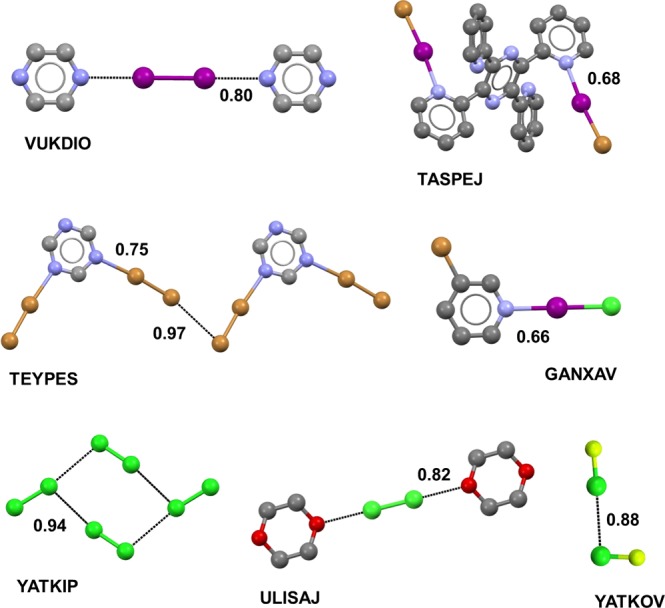
Representation of halogen-bonded crystal structures
involving I2 (VUKDIO), BrI (TASPEJ), Br2 (TEYPES),
ClI (GANXAV),
Cl2 (YATKIP and ULISAJ), and FCl (YATKOV). XBs are represented
as solid lines, similar to covalent bonds, when their length is as
short as a covalent bond, or as dotted black lines, when their length
is close to the sum of the vdW radii of the involved atoms. Hydrogen
atoms are omitted for clarity. Color code: carbon, gray; nitrogen,
blue; oxygen, red; iodine, purple; bromine, light brown; chlorine,
light green, fluorine, yellow. CSD Refcodes are reported.
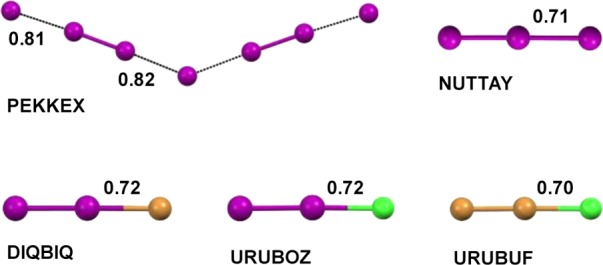
Representation of halogen-bonded crystal structures involving
dihalogen
molecules as XB donors and anionic XB acceptors. XBs are represented
as solid lines, similar to covalent bonds, when their length is as
short as a covalent bond, or as dotted black lines, when their length
is close to the sum of the vdW and Pauling radii of the involved species.
Cations are omitted for clarity. Color code: iodine, purple; bromine,
light brown; chlorine, light green. CSD Refcodes are reported.
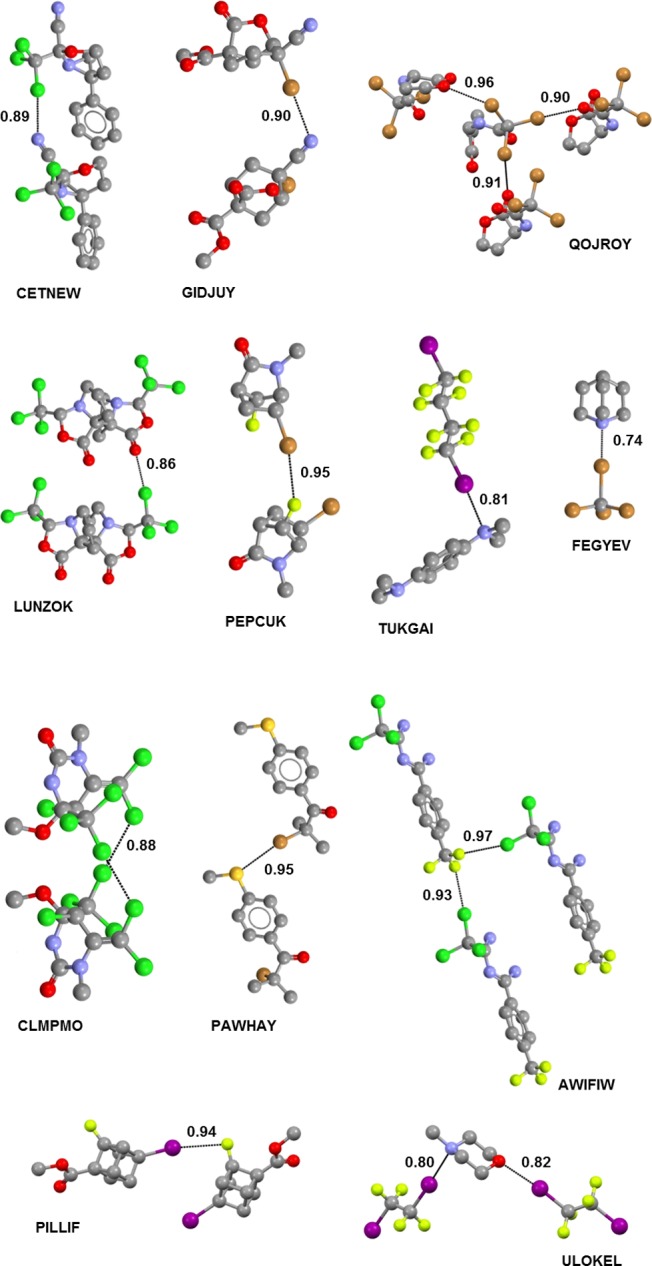
Library
of halogen-bonded cocrystals involving haloalkanes as XB
donors. Color code: carbon, gray; nitrogen, blue; oxygen, red; iodine,
purple; sulfur, dark yellow; chlorine, light green; fluorine, yellow.
XBs are dotted black lines. Hydrogen atoms are omitted for clarity.
CSD Refcodes are reported: CETNEW, (2R,6S)-6-phenyl-2-(trichloromethyl)-3-oxa-1-azabicyclo[4.1.0]heptane-2-carbonitrile;
GIDJUY, methyl 4-bromo-4-cyano-6-oxabicyclo(3.2.1)octan-7-one-1-carboxylate;
QOJROY, N-tribromoacetylhomoserine lactone; LUNZOK,
3,3′-bis(trichloromethyl)tetrahydro-5H,5′H-7a,7a′-bipyrrolo[1,2-c][1,3]oxazole-1,1′-dione;
PEPCUK, 6-bromo-7-fluoro-2-methyl-2-azabicyclo[2.2.1]heptan-3-one;
TUKGAI, N,N,N′,N′-tetramethylbenzene-1,4-diamine–1,4-diiodoperfluorobutane;
FEGYEV, quinuclidine carbon tetrabromide; CLMPMO, 5-chloro-6-(dichloromethylene)-4-methoxy-1-methyl-4-(trichloromethyl)hexahydropyrimidin-2-one;
PAWHAY, 2-bromo-2-methyl-1-[4-(methylsulfanyl)phenyl]propan-1-one;
AWIFIW, 4-(trifluoromethyl)-N′-(2,2,2-trichloroethanimidoyl)benzene-1-carboximidamide;
PILLIF, methyl 2-fluoro-4-iodocubane-1-carboxylate; ULOKEL, N-methylmorpholine–1,2-diiodotetrafluoroethane.
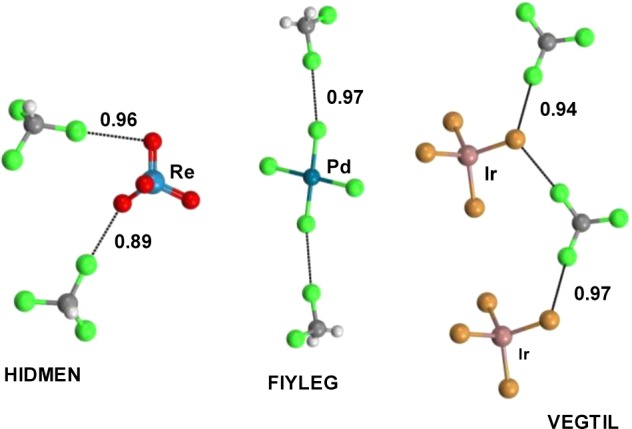
Examples of solvates
wherein the chlorinated solvents are pinned
by XBs. For the sake of clarity, only the supramolecular anion is
reported. Metal atoms are labeled. Color code: carbon, gray; oxygen,
red; bromine, light brown; chlorine, light green, hydrogen, white.
XBs are dotted black lines. CSD Refcodes are reported: HIDMEN, trichloro(tripyrazolylmethane-N,N′,N″)rhenium(IV)
perrhenate chloroform solvate; FIYLEG, [μ2-1,1′-bis[(1,3-dimethylimidazolidin-2-ylidene)amino]ferrocene]chloropalladium
hemi(tetrachloropalladium) dichloromethane solvate; VEGTIL, [N,N′-bis(2,6-diisopropylphenyl)triptycenylimidoformamidium]tetrabromoindium(II)
chloroform solvate.
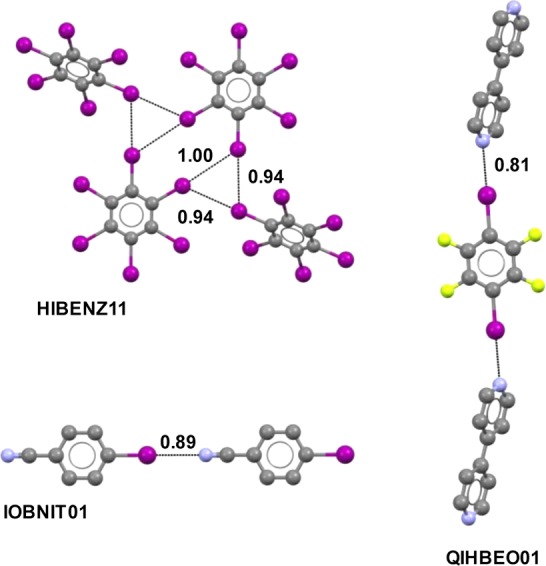
Representation of halogen-bonded crystal structures
involving neutral
haloarenes and haloperfluoroarenes: HIBENZ11, XB trigonal synthon
present in the hexaiodobenzene structure; QIHBEO01, repeating unit
in the infinite chain where 4,4′-bipyridine and 1,4-DITFB alternate;
IOBNIT01, repeating unit in the 4-iodobenzonitrile infinite chain.
Hydrogens are omitted for clarity. Color code: carbon, gray; nitrogen,
blue; iodine, purple; fluorine, yellow. XBs are dotted black lines.
CSD Refcodes are reported.
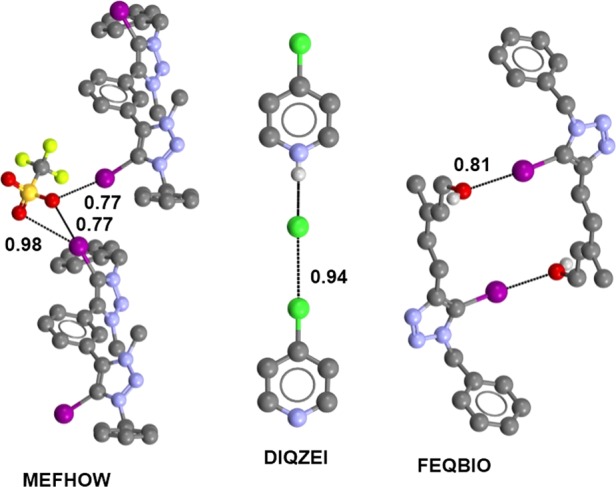
Representation of halogen-bonded
crystal structures involving neutral
and positively charged haloheteroarenes as XB donors. Hydrogen atoms
are omitted for clarity, escept for acidic ones in DIQZEI and FEQBIO.
Color code: carbon, gray; nitrogen, blue; oxygen, red; iodine, purple;
sulfur, dark yellow; chlorine, light green, fluorine, yellow. XBs
and HBs are dotted black lines. CSD Refcodes are reported: MEFHOW,
trimeric unit present in 5,5′-(1,3-phenylene)bis(3-benzyl-4-iodo-1-methyl-1H-1,2,3-triazol-3-ium) bis(trifluoromethanesulfonate); DIQZEI,
repeating unit in the infinite chain formed by 4-chloropyridinium
chloride; FEQBIO, dimer formed by 5-(1-benzyl-5-iodo-1H-1,2,3-triazol-4-yl)-3-methylpent-2-en-1-ol.
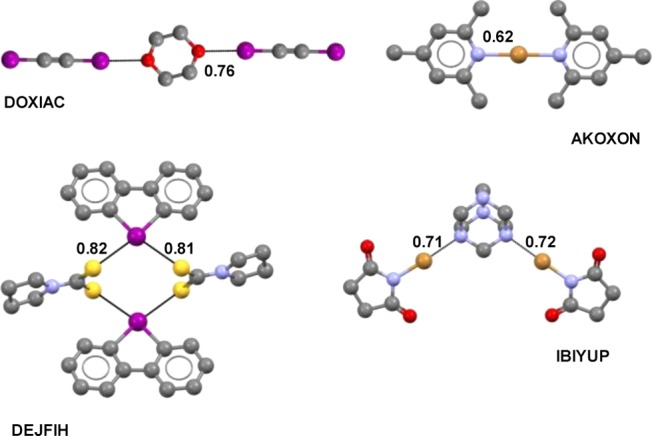
Representation of halogen-bonded crystal structures
involving highly
polarized halogen atoms. Hydrogen atoms are omitted for clarity. Color
code: carbon, gray; nitrogen, blue; oxygen, red; iodine, purple; bromine,
light brown; sulfur, dark yellow. XBs are dotted black lines. CSD
Refcodes are reported: DOXIAC, 1,4-dioxane and diiodoacetylene; AKOXON,
bis(2,4,6-collidine)bromonium perchlorate; DEJFIH, dibenzoiodolyl
pyrrolidinedithiocarbamate; IBIYUP, hexamethylenetetramine and N-bromosuccinimide.
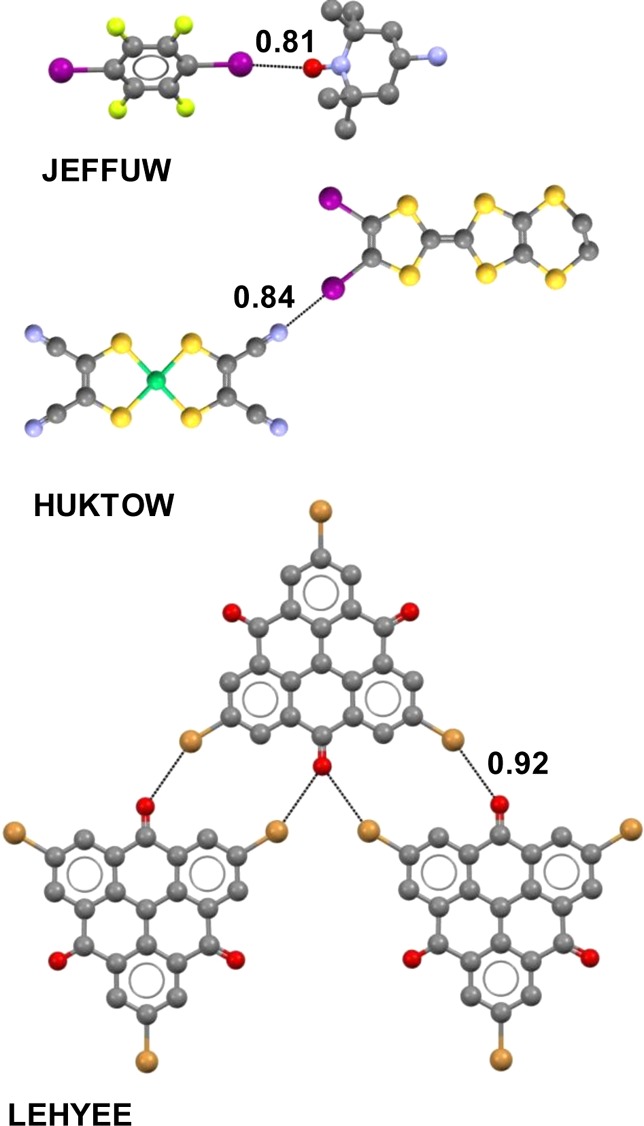
Representation of halogen-bonded crystal structures
involving radicals
as XB acceptors. Hydrogen atoms are omitted for clarity. Color code:
carbon, gray; nitrogen, blue; oxygen, red; iodine, purple; bromine,
light brown; sulfur, dark yellow; fluorine, yellow. In HUKTOW, Ni
is green. XBs are dotted black lines. CSD Refcodes are reported: JEFFUW,
(4-amino-2,2,6,6-tetramethylpiperidin-1-yl)oxy radical, 1,4-DITFB;
HUKTOW, bis[3,4-bisiodo-3′,4′-(ethylenedithio)tetrathiafulvalene)
bis(cis-1,2-dicyanoethylene-1,2-dithiolato-S,S′)nickel; LEHYEE, 2,6,10-tribromo-12-hydroxy-4H,8H-dibenzo[cd,mn]pyrene-4,8-dione.
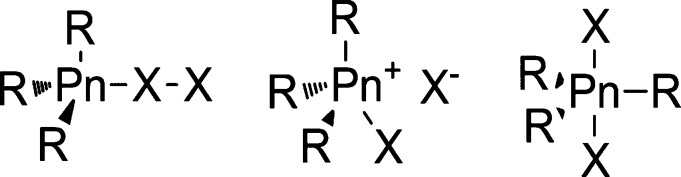
Three main structural types of R3PnX2 adducts:
the halogen-bonded adduct (left), the phosphonium halide (center),
the pentacoordinated addition product (right).
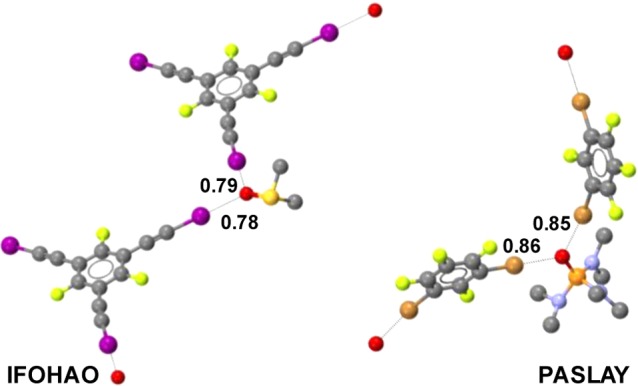
Partial view of the
halogen-bonded infinite chains formed by dimethyl
sulfoxide with 1,3,5-trifluoro-2,4,6-tris(iodoethynyl)benzene (IFOHAO)
and hexamethylphosphoric triamide with 1,3-dibromotetrafluorobenzene
(PASLAY). Hydrogen atoms are omitted for clarity. Color code: carbon,
gray; nitrogen, blue; oxygen, red; iodine, purple; bromine, light
brown; sulfur, dark yellow; fluorine, yellow. XBs are dotted black
lines. CSD Refcodes are reported.
Partial view of the infine chain formed by XBs between
iodine atoms
and the π-electrons of the triple bonds in one of the polymorphs
of haloprogin, the active pharmaceutical ingredient used in antimycotic
topical drugs. Hydrogens are omitted for clarity. Color code: carbon,
gray; nitrogen, blue; oxygen, red; iodine, purple; chlorine, light
green. XBs are dotted black lines. The CSD Refcode is reported.
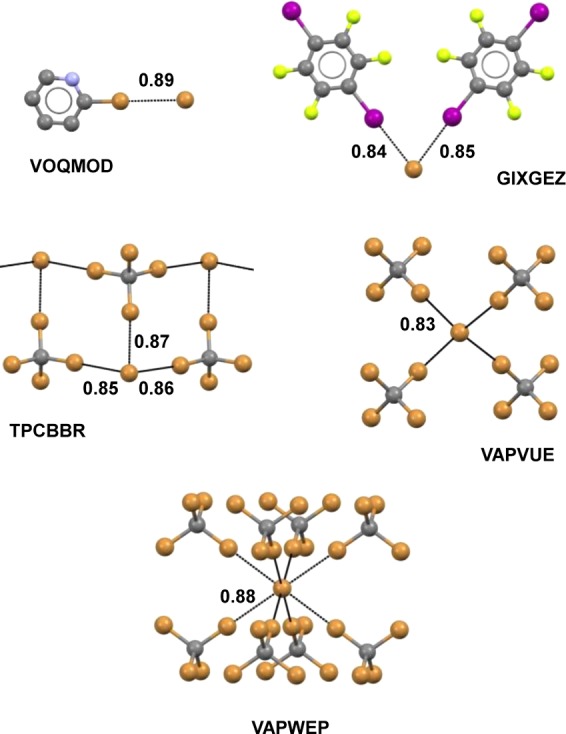
Bromide anions can form
from one to eight XBs: VOQMOD, 2-bromopyridinium
bromide; GIXGEZ, part of the infinite chain formed by tetramethylammonium
bromide and 1,4-DITFB; TPCBBR, part of the ribbon formed by tetraphenylphosphonium
bromide and tetrabromomethane; VAPVUE, part of the adamantanoid network
formed by tetraethylammonium bromide and tetrabromomethane; VAPWEP,
supramolecular anion formed by tetramethylammonium bromide and tetrabromomethane.
For the sake of clarity, cations have been omitted, except in the
first adduct. Color code: carbon, gray; iodine, purple; bromine, light
brown; fluorine, yellow. XBs are dotted black lines. CSD Refcodes
are reported.
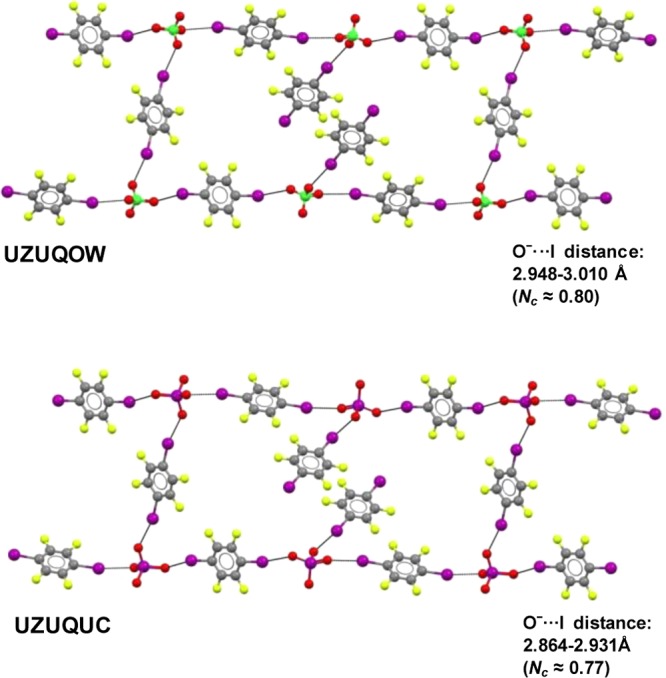
Isomorphous
(6,3) networks where perchlorate (UZUQOW) and periodate
(UZUQUC) anions are the nodes and 1,4-DITFB is the spacer. Cations
were omitted for clarity. Color code: carbon, gray; oxygen, red; iodine,
purple; chlorine, light green, fluorine, yellow. XBs are dotted black
lines. CSD Refcodes are reported.
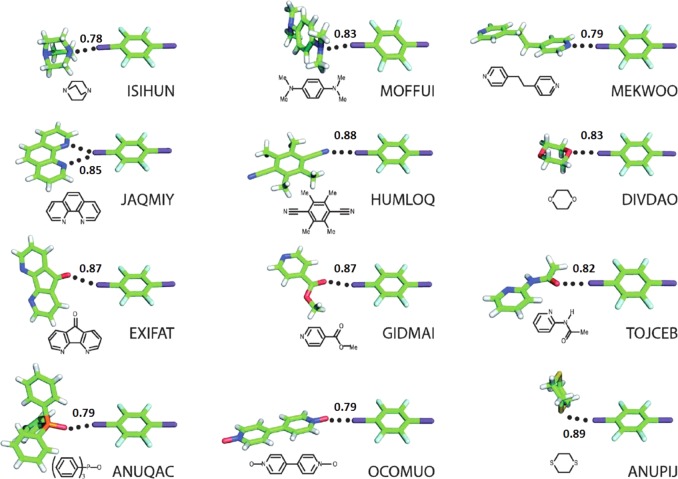
Crystal structures of
1,4-DITFB with various XB acceptors. Nc values and Refcodes are reported. XBs are
dotted black lines. Adapted with permission from ref (674). Copyright 2013 Royal
Society of Chemistry.
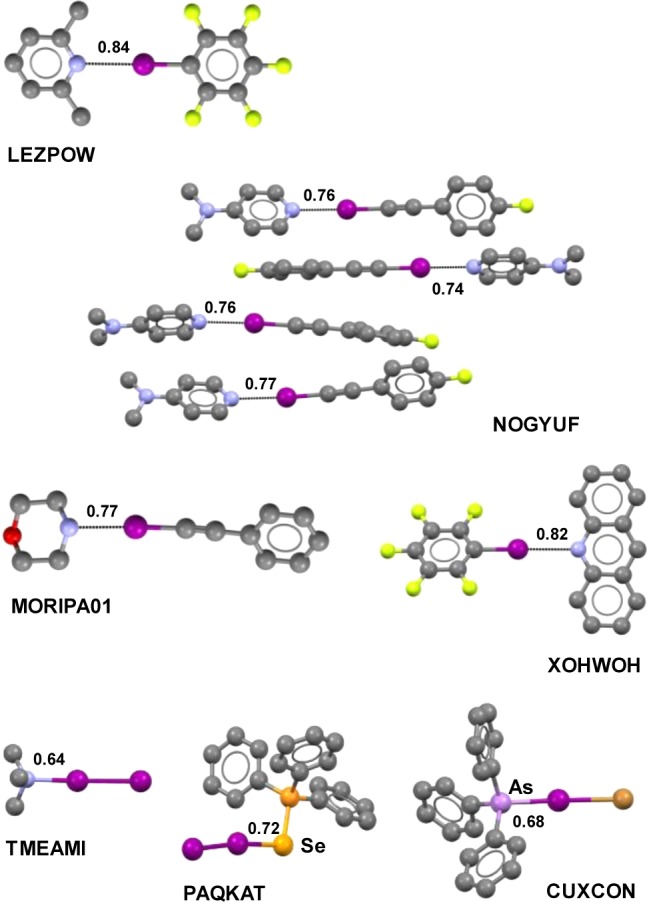
Crystal
structures of selected discrete halogen-bonded dimers.
Color code: carbon, gray; nitrogen, blue; oxygen, red; iodine, purple;
bromine, light brown; fluorine, yellow. XBs are shown as dotted black
lines or as colored solid lines. CSD Refcodes are reported: LEZPOW,
2,6-dimethylpyridine–pentafluoroiodobenzene; NOGYUF, N,N,N-Dimethylpyridin-4-amine–1-fluoro-4-(iodoethynyl)benzene;
MORIPA01, morpholine–1-iodo-2-phenylacetylene; XOHWOH, acridine–iodopentafluorobenzene;
TMEAMI, trimethylamine–diiodine; PAQKAT, triphenylphosphineselenido–diiodine;
CUXCON, triphenylarsine–iodine monobromine.
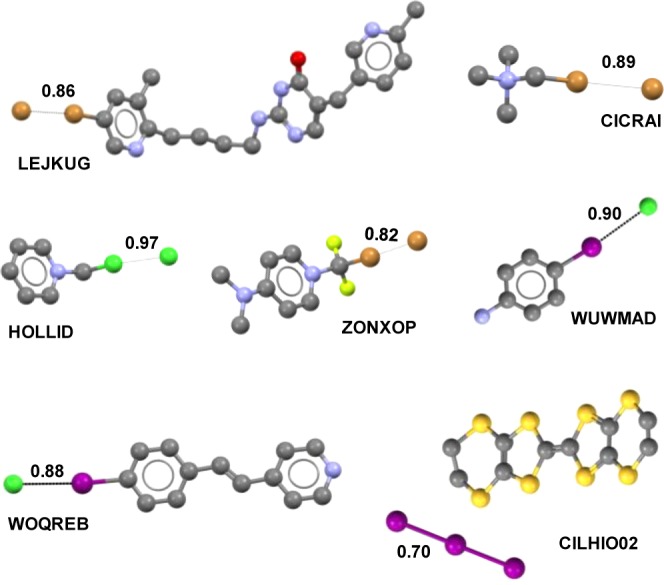
From LEJKUG to WUWMAD: representation
of crystal structures of
0D dimeric adducts involving halogen atoms activated by positively
charged scaffolds and halide anions. CILHIO22: crystal structure of
a TTF derivative containing the triiodide anion. Hydrogen atoms are
omitted for clarity. Color code: carbon, gray; nitrogen, blue; iodine,
purple; bromine, light brown; chlorine, light green, sulfur, dark
yellow; fluorine, yellow. XBs are dotted black lines and colored solid
lines. CSD Refcodes are reported: LEJKUG, 2-[[4-(5-bromo-3-methyl-2-pyridyl)butyl]amino]-5-(6-methyl-3-pyridylmethyl)-4-pyrimidone
trihydrobromide; CICRAI, (bromomethyl)trimethylammonium bromide; HOLLID,
1-(chloromethyl)pyridinium chloride; ZONXOP, 1-(bromodifluoromethyl)-4-(dimethylamino)pyridinium
bromide; WUWMAD, 4-iodoanilinium chloride; WOQREB, trans-4-[2-(4-iodophenyl)ethenyl]pyridinium chloride; CILHIO02, bis[bis(ethylenedithio)tetrathiafulvalene]
triiodide.
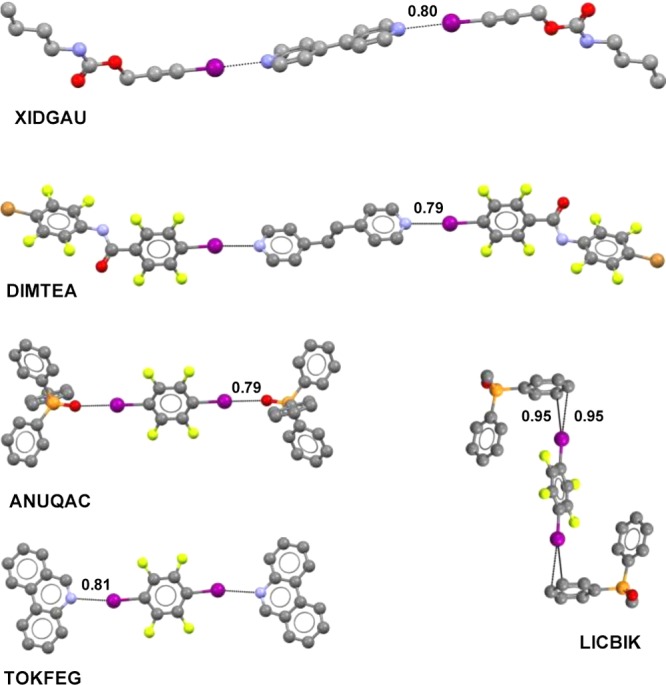
Trimeric discrete complexes
formed by 1,4-DITFB with phenanthridine
(TOKFEG), triphenylphosphine oxide (ANUQAC), and methyl(diphenyl)phosphine oxide (LICBIK). Trimeric complexes assembled by N-(4-bromo-2,3,5,6-tetrafluorophenyl)-2,3,5,6-tetrafluoro-4-iodobenzamide
with t-BPE (DIMTEA) and by 3-iodoprop-2-yn-1-ylbutyl carbamate with 4,4′-bipyridine
(XIDGAU). Color code: carbon, gray;
nitrogen, blue; oxygen, red; iodine, purple; bromine, light brown;
chlorine, light green; phosphorus, orange; fluorine, yellow. XBs are
dotted black lines. CSD Refcodes are reported.
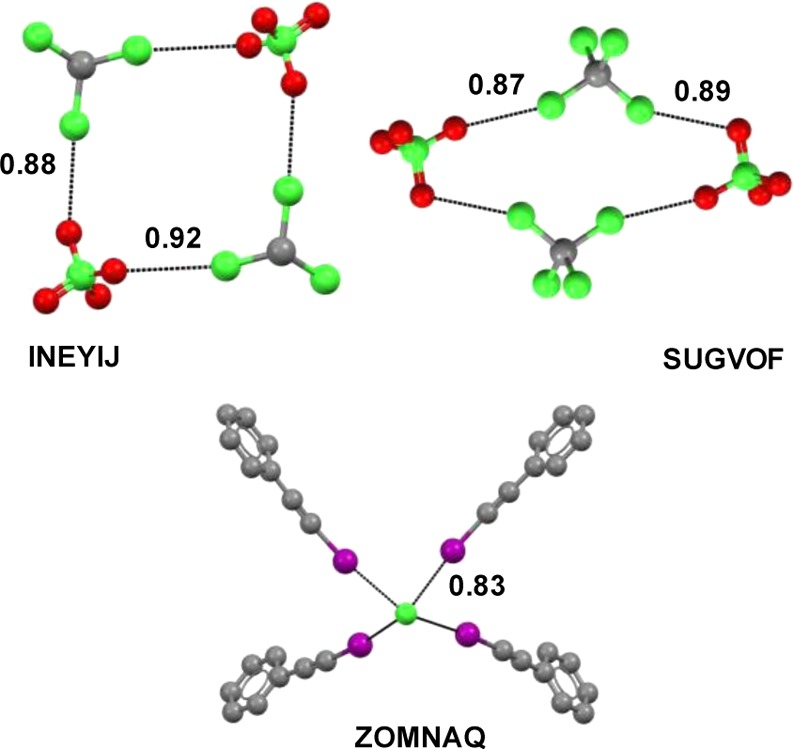
Representation of the cyclic tetrameric
superanions formed by CHCl3 and the perchlorate anion of
bis[μ2-8-[(2-pyridylsulfanyl)methyl]quinoline]disilver(I)
diperchlorate (INEYIJ) and CCl4 and the perchlorate anion
of (cis-2,6,9,13-tetrathiabicyclo(12.4.0)octadecane)nickel(II)
diperchlorate (SUGVOF). Representation of the pentameric superanion
assembled thanks to Il···Cl– XBs
in tetraphenylphosphonium chloride–tetrakis(1-iodo-2-phenylacetylene)
(ZOMNAQ). Cations are omitted for clarity. Color code: carbon, gray;
oxygen, red; iodine, purple; chlorine, light green. XBs are dotted
black lines. CSD Refcodes are reported.
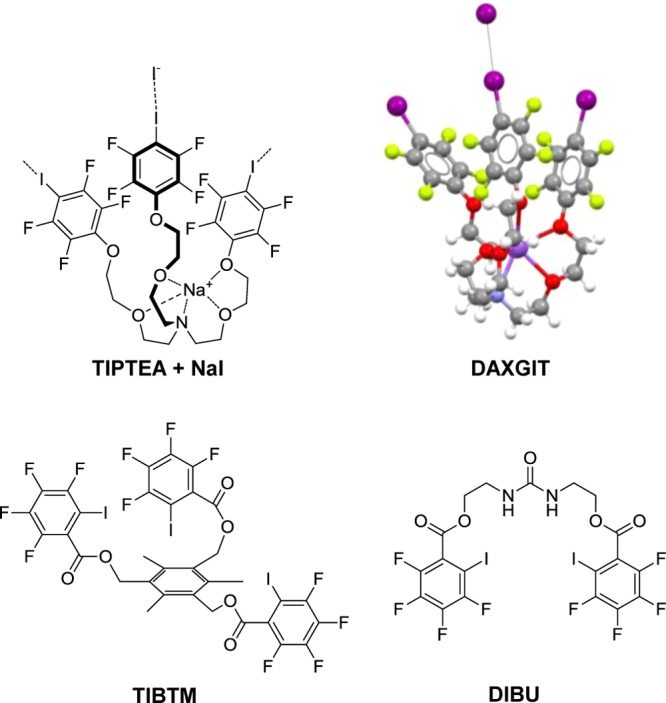
Top: molecular formula of TIPTEA (left) and
representation of the
single-crystal X-ray structure of the complex of TIPTEA with NaI (right).
The I···I– XB is shown as a black
dotted line. Bottom: molecular formulas of TIBTM and of DIBU. Color
code: carbon, gray; nitrogen, blue; oxygen, red; iodine, purple; fluorine,
yellow; sodium, light purple. XBs are dotted black lines. The CSD
Refcodes are reported.
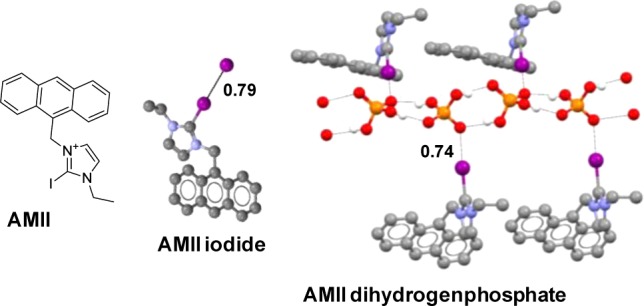
Left: molecular formula
of AMII. Middle: single-crystal X-ray structure
of the AMII iodide salt. Right: single-crystal X-ray structure of
the AMII dihydrogen phosphate salt. Color code: carbon, gray; nitrogen,
blue; oxygen, red; iodine, purple; phosphorus, orange; hydrogen, white.
XBs and HBs are dotted black lines. CSD Refcodes are reported.
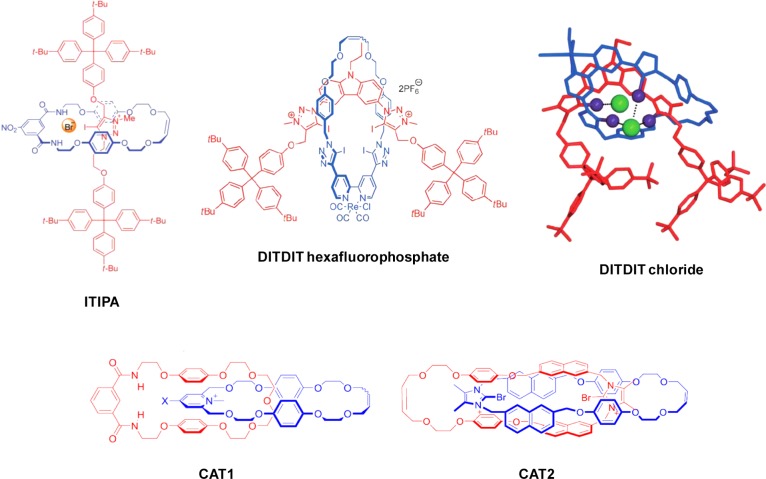
Top: molecular formula of ITIPA, molecular formula of DITDIT hexafluorophosphate
salt, and single-crystal X-ray structure of DITDIT chloride salt.
Adapted with permission from ref (551). Copyright 2014 John Wiley and Sons. Bottom:
molecular formulas of CAT1 (left) and CAT2 (right). Adapted with permission
from refs (719) and (659). Copyright 2014 and 2012,
respectively, John Wiley and Sons.

Left: cartoon representing the binding
of the tris(iododifluoroacetate)
guest to the folded structure of HTF by multiple I···N
XBs, which further fastens the folded state and leads to an increase
of the excimer emission of the appended pyrene units. Adapted with
permission from ref (720). Copyright 2012 John Wiley and Sons. Right: molecular structure
of BITN bound to the HP2O73– anion. Here, too, the recognition event leads to an increase of
the excimer emission of the appended pyrene units. Adapted from ref (721). Copyright 2014 American
Chemical Society.

Representation of single-crystal
structures of halogen-bonded 1D
infinite chains assembled via self-complementary modules. Color code:
carbon, gray; nitrogen, blue; oxygen, red; iodine, purple; fluorine,
yellow. XBs are dotted black lines. CSD Refcodes are reported: PAPRIJ,
4-[2-[1-hexyl-5-[2-(tetrafluoro-4-iodophenyl)vinyl]-1H-pyrrol-2-yl]vinyl]pyridine; ACOKIM, 4-iodo-2,3,5,6-fluorobenzonitrile;
PADHUY, 4-iodotetrafluorobenzaldehyde; JALLEO, 1-iodo-4-(phenylethynyl)tetrafluorobenzene;
JEHREU, N,N-dimethyl-4-(E)-[2-(tetrafluoro-4-iodophenyl)vinyl]aniline.
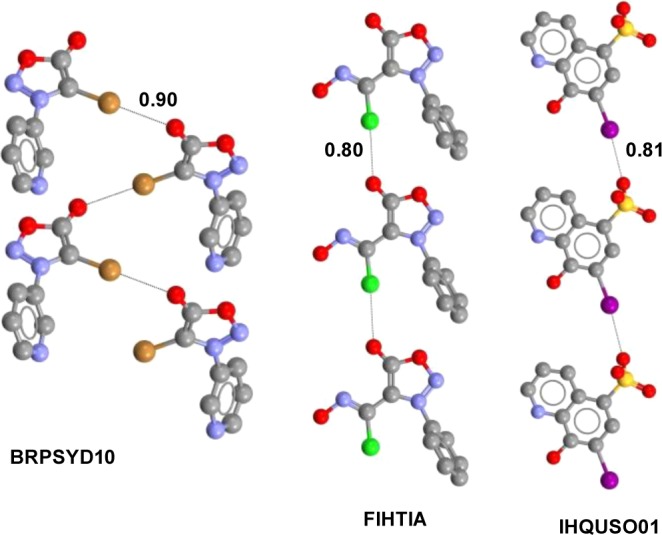
1D infinite chains of halogen-substituted zwitterions: 4-bromo-3-(3-pyridyl)sydnone
(BRPSYD10), (Z)-3-phenylsydnone-4-hydroximic acid
chloride (FIHTIA), and 7-iodo-8-hydroxyquinolinium 5-sulfonate (IHQUSO01).
Color code: carbon, gray; nitrogen, blue; oxygen, red; iodine, purple;
bromine, light brown; chlorine, light green; sulfur, dark yellow.
XBs are dotted black lines. CSD Refcodes are reported.
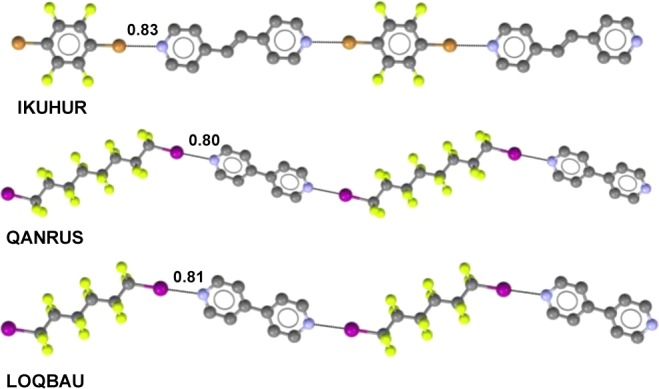
Partial representation of the 1D chain: linear chain formed by t-BPE and 1,4-dibromotetrafluorobenzene (IKUHUR), stepped
chains formed on self-assembly of 4,4′-dipyridyl and DIPFH
(QANRUS) and DIPFO (LOQBAU). Hydrogen atoms are omitted for clarity.
Color code: carbon, gray; nitrogen, blue; iodine, purple; bromine,
light brown; fluorine, yellow. XBs are dotted black lines. CSD Refcodes
are reported.
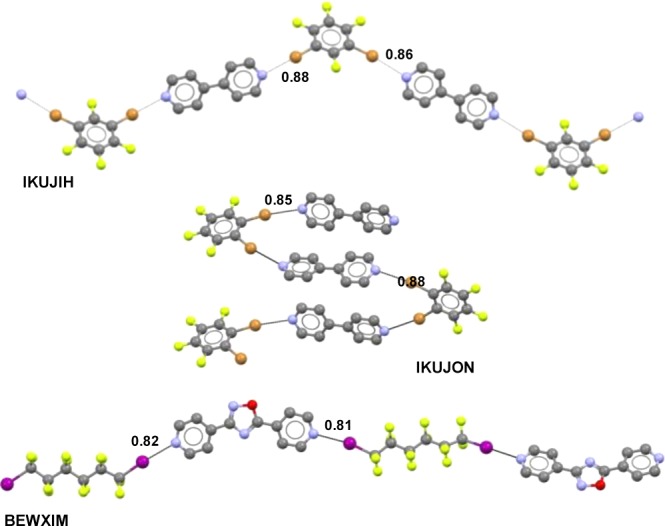
Representation of a part of the infinite chains
between 4,4′dipyridyl
and 1,3-dibromotetrafluorobenzene (IKUJIH)) and 1,2-dibromotetrafluorobenzene
(IKUJON) and between 3,5-bis(pyrid-4′-yl)-1,2,4-oxadiazole
and 1,6-diiodoperfluorohexane (BEWXIN). In BEWXIN the angle between
the two pyridyl pendants of the XB acceptor (149.1°) is quite
similar to the angle between the two formed XBs (141.5°). Hydrogen
atoms are omitted for clarity. Color code: carbon, gray; nitrogen,
blue; oxygen, red; iodine, purple; bromine, light brown; fluorine,
yellow. XBs are dotted black lines. CSD Refcodes are reported.
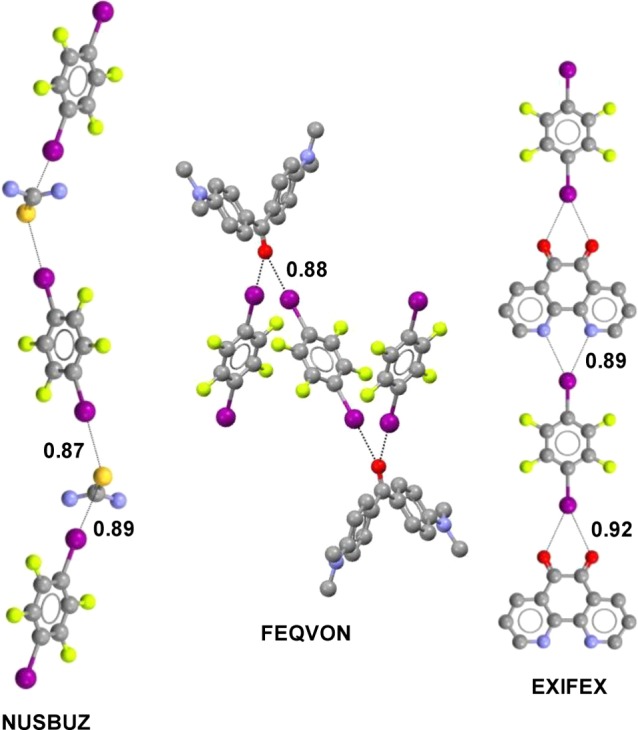
Representation of heteromeric 1D chains where 1,4-DITFB self-assembles
with thiourea (NUSBUZ) and Michler’s ketone (FEQVON), both
functioning as monotopic XB acceptors where the heteroatom is a bifurcated
site, and with 1,10-phenanthroline-5,6-dione (EXIFEX), forcing the
iodine atoms of 1,4-DITFB to work as a bifurcated XB donor. Color
code: carbon, gray; nitrogen, blue; oxygen, red; iodine, purple; bromine,
light brown; sulfur, dark yellow; fluorine, yellow. XBs are dotted
black lines. CSD Refcodes are reported.

Infinite
chains produced on C–Br···Cl– XB formation in bis(2-bromoimidazole)boronium chloride
(IKUXER), C–Br···Br– XB formation in (−)-sparteine hydrobromide/1,2-dibromohexafluoropropane
(BOCGAB), C–I···Cl– XB formation in bis[bis(ethylenedithio)tetrathiafulvalene]
chloride/diiodoacetylene (PAVZIV), and
C–I···Cl– XB formation in
tris[bis(ethylenedithio)tetraselenafulvalene] chloride/1,4-bis(iodoethynyl)benzene
(AHULEU). Cations and hydrogen atoms
are omitted for simplicity. “Rings and sticks” (UGULAK)
and comblike (DOXTOA) architectures form when iodide anions (tridentate
nodes) self-assemble with α,ω-diiodoperfluoroalkanes.
Halogen-bonded ribbons form when iodide anions (tridentate nodes)
self-assemble with 1,4-DITFB (GIXGOJ), or with a triiodobenzene derivative (NUZKIC). Color code: carbon, gray; nitrogen, blue; iodine, purple;
chlorine, light green; boron, pink; fluorine, yellow. XBs are dotted
black lines. CSD Refcodes are reported.
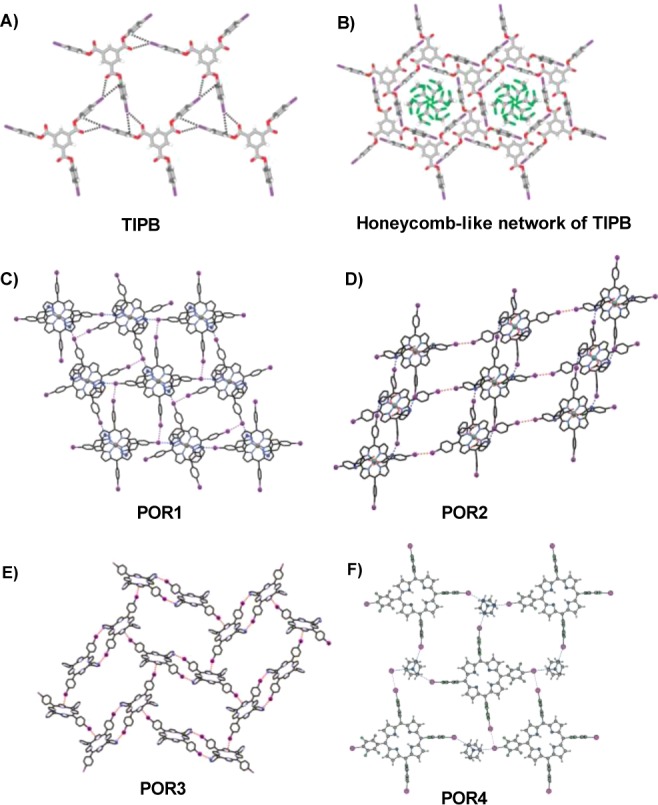
(A) Triangular motif sustained by bifurcated
I···O
and I···π XBs in the packing of TIPB. (B) Honeycomb-like
network in TIPB. Hexagonal channels are filled by chloroform molecules
(in green). (C) Two-dimensional array (sql) of tin tetrakis(iodophenyl)porphyrin
with nicotinic acid (POR1) aligned parallel to the ac plane of the crystal. (D) Square-grid-type network in the crystal
of tetrakis(iodophenyl)porphyrin assembled with 1-hydroxybenzotriazole
(POR2). Every porphyrin unit is involved in eight XB contacts. (E)
View parallel to the crystal ab plane of bis(iodoaryl)dipyridylporphyrin
free base (POR3). (F) Representative section of the halogen-bonded
layer in POR4, viewed within the crystal ac plane.
XBs are dotted lines. Panels A and B reprinted with permission from
ref (746). Copyright
2008 Royal Society of Chemistry. Panels C and D reprinted with permission
from ref (748). Copyright
2013 John Wiley and Sons. Panel E reprinted from ref (749). Copyright 2015 American
Chemical Society. Panel F reprinted with permission from ref (750). Copyright 2014 Royal
Society of Chemistry.
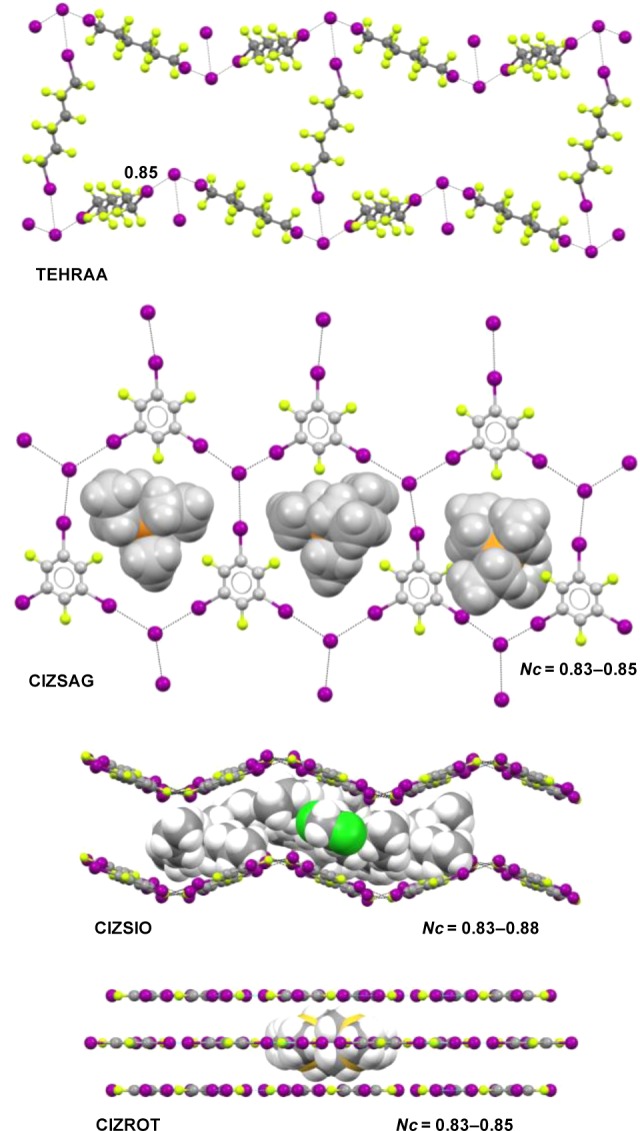
TEHRAA: side
view of the (6,3) superanion network in the halogen-bonded
adduct K.2.2.2/KI/DIPFH. Cations are omitted for clarity. CIZSAG:
front view of the (6,3) network of tetraethylphosphonium iodide–1,3,5-triodo-2,4,6-trifluorobenzene.
Cations are shown in space-filling style. CIZSIO: side view showing
the undulated (6,3) anionic net of tetra-n-butylammonium
iodide–1,3,5-triodo-2,4,6-trifluorobenzene dichloromethane
solvate. Cations and dichloromethane are shown in space-filling style.
CIZROT, side view showing the planarity of the (6,3) anionic network
of trimethylsulfonium iodide–1,3,5-triodo-2,4,6-trifluorobenzene.
Cations are shown in space-filling style. Color code: carbon, gray;
nitrogen, blue; iodine, purple; phosphorus, orange; sulfur, dark yellow;
fluorine, yellow. XBs are dotted black lines. CSD Refcodes are reported.
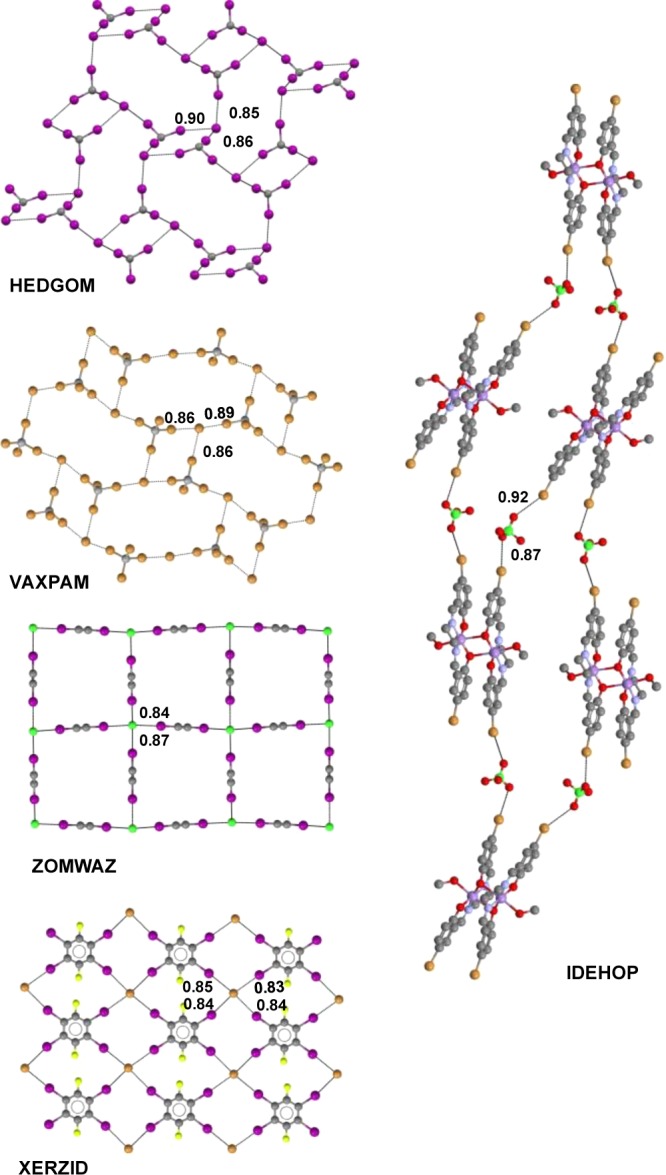
Tilings formed by octagons and rhombs and resulting on self-assembly
of iodoform with benzyltrimethylammonium iodide (HEDGOM) and carbon
tetrabromide with 1-aza-8-azoniabicyclo(5.4.0)undec-7-ene bromide
(VAXPAM). (4,4) networks are obtained on self-assembly of diiodoacetylene
with chloride anions (ZOMWAZ), 1,4-difluoro-2,3,5,6-tetraiodobenzene
with bromide anions (XERZID), and [bis[[μ2-N,N′-bis(5-bromosalicylaldehyde)ethylenediamino]methanol]manganese(III)]
perchlorate (IDEHOP). Hydrogen atoms and cations are omitted. Color
code: carbon, gray; nitrogen, blue; oxygen, red; iodine, purple; bromine,
light brown; chlorine, light green; fluorine, yellow. Mn atoms in
IDEHOP are shown in gray-violet. XBs are dotted black lines. CSD Refcodes
are reported.
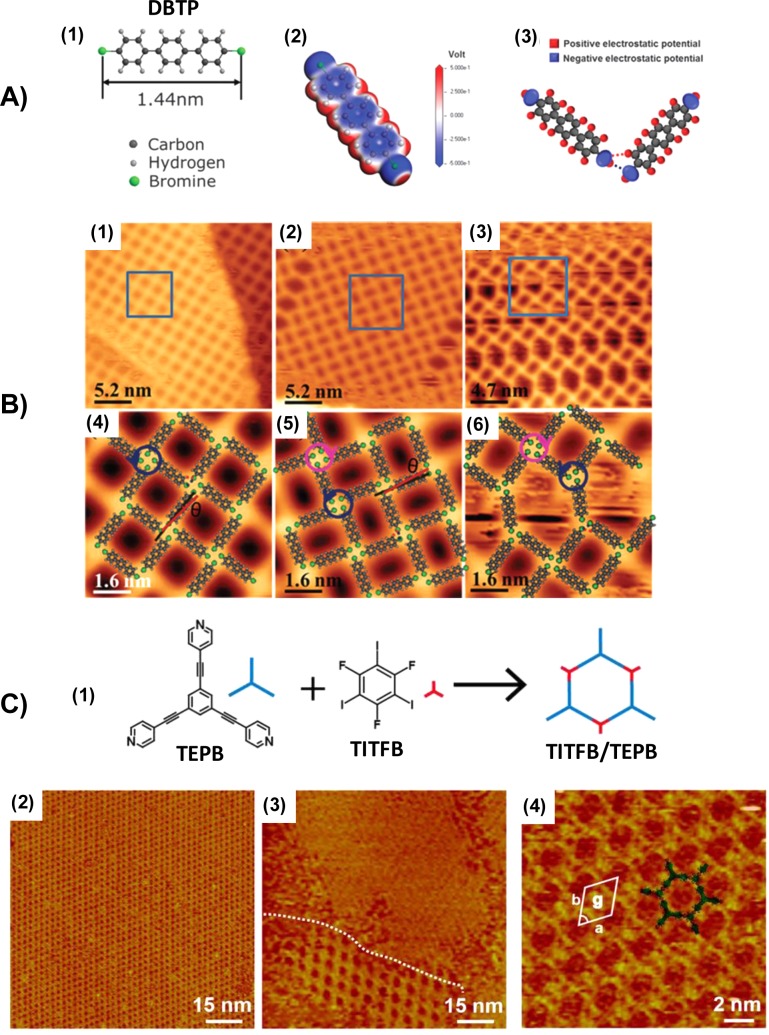
(A) (1) Chemical
structure of DBTP. (2) Calculated molecular electrostatic
potential distribution of DBTP at the isodensity surface shown in
red (positive) and blue (negative). (3) Cartoon of two DBTP molecules
with simplified electrostatic potential distributions around H and
Br atoms (same color code as in (2)). Dotted blue lines indicate Br···Br
XBs, and dotted red lines indicate Br···H HBs. (B)
(1–3) STM topography images of three porous networks obtained
after DBTP was deposited on Ag(111) at 80 K. (4–6) High-resolution
STM images from the square-marked areas in (1), (2), and (3), respectively,
with superimposed molecular models of DBTP. Adapted with permission
from ref (756). Copyright
2011 Royal Society of Chemistry. (C) (1) Scheme of the self-assembly
of tritopic XB acceptor TEPB and XB donor TITFB affording the TITFB/TEPB
honeycomb-like network where the two modules alternate at the nodes.
(2) Large-scale STM image of the TITFB/TEPB honeycomb-like structure.
(3) The STM image shows the coexistence of a TEPB close-packed structure
and the TITFB/TEPB honeycomb-like network. (4) High-resolution STM
image of the TITFB/TEPB honeycomb-like structure. Adapted from ref (755). Copyright 2015 American
Chemical Society.
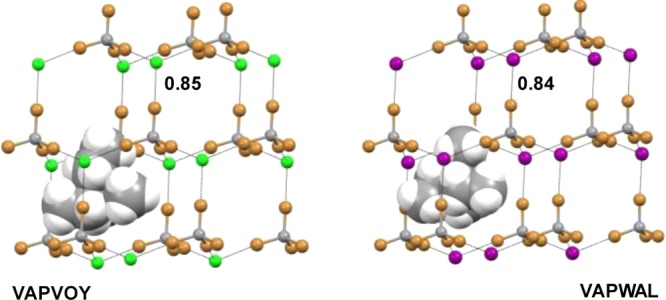
Isomorphous adamantanoid networks formed when tetrabromomethane
(the tetradentate XB donor) alternates at the network nodes with chloride
(VAPVOY) or iodide (VAPWAL) anions, which function as tetradentate
XB acceptors. Cations at the center of the cage are shown in space-filling
style. Only one (C2H5)4N+ is drawn for clarity. Color code: carbon, gray; iodine, purple;
bromine, light brown; chlorine, light green; hydrogen, white. XBs
are dotted black lines. CSD Refcodes are reported.
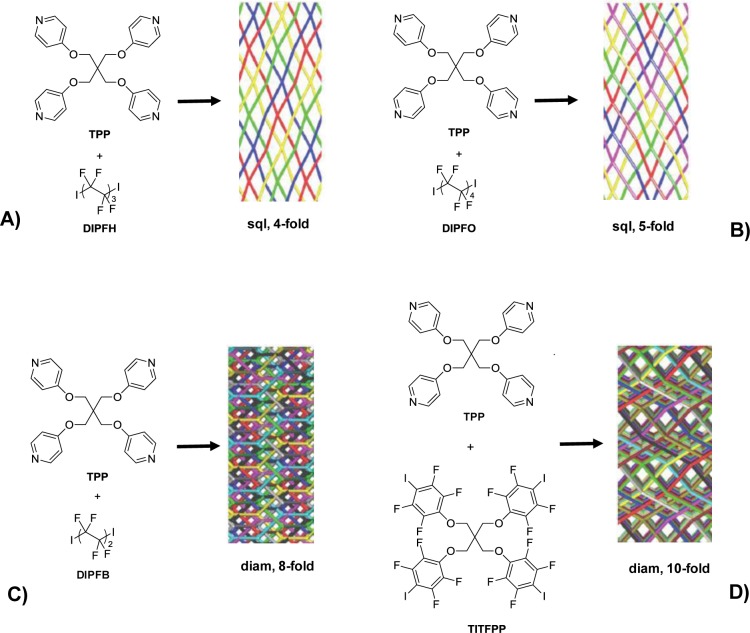
Structures of starting tectons and schematic views, obtained with
TOPOS, of the corresponding interpenetrated
networks: (A) DIPFH/TPP (sql, 4-fold interpenetration); (B) DIPFO/TPP
(sql, 5-fold interpenetration); (C) DIPFB/TPP (dia, 8-fold interpenetration);
(D) TITFPP/TPP (dia, 10-fold interpenetration).
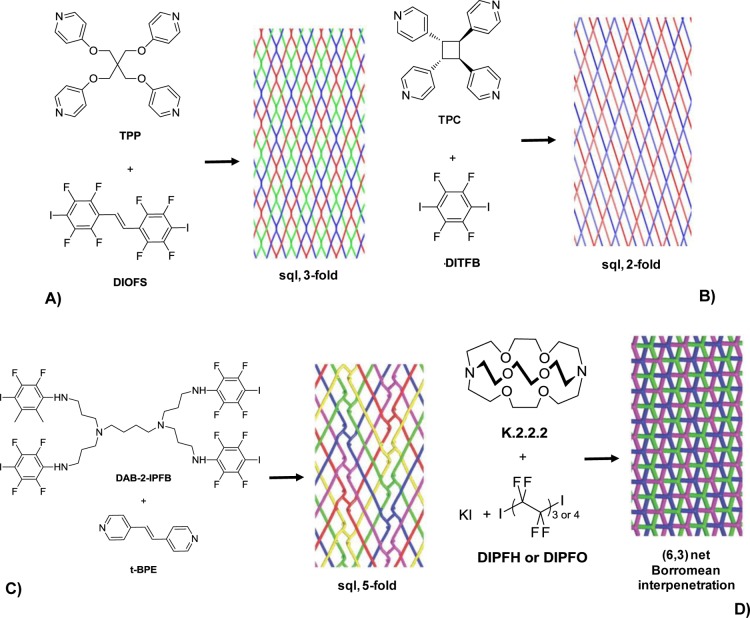
Structures of starting tectons and schematic views, obtained
with
TOPOS, of the corresponding interpenetrated
networks: (A) DIOFS/TPP adduct (sql, 3-fold interpenetration); (B)
DITFB/TPC (sql, 2-fold interpenetration); (C) DAB-2-IPFB/t-BPE (sql, 5-fold interpenetration); (D) K.2.2.2/KI/DIPFH or DIPFO
((6,3) net, Borromean interpenetration).

Structures of starting tectons and schematic
views, obtained with
TOPOS, of the corresponding interpenetrated
networks. (A) [Co(1IP)(1,4-BIMB)]n (3-fold interpenetration). Adapted from ref (764). Copyright 2011 American
Chemical Society. (B) HFTIPB/Ph4PCl or Ph4PBr
(8-fold interpenetrated net of class Ia). Adapted from ref (765). Copyright 2011 American
Chemical Society. (C) TITFB/Et3MeN+I– (4-fold interpenetration of class IIIa). Adapted from ref (766). Copyright 2013 American
Chemical Society. (C) [Zn2(BMIB)(TBTP)2·2H2O]n (4-fold
interpenetration dia of class IIIa). Adapted with permission from
ref (767). Copyright
2014 Royal Society of Chemistry.
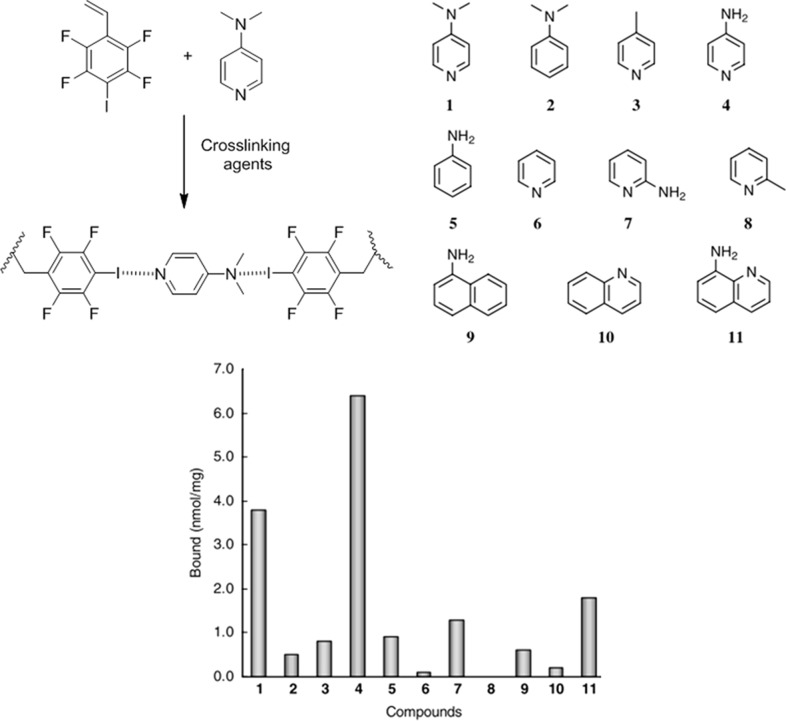
Top: possible structure of the molecularly
imprinted polymer obtained
using 2,3,5,6-tetrafluoro-4-iodostyrene as the monomer and 4-(dimethylamino)pyridine
as the template. Bottom: binding affinities of different XB acceptors
for the imprinted polymer. Adapted with permission from ref (768). Copyright 2005 Elsevier
Ltd.
(A) Packing of bis(trimethylammonium)decane
diiodide dihydrate
(XOVBIU) viewed along the a-axis. (B) Complex bis(trimethylammonium)decane
diiodide/diiodoperfluorobutane (XOVBAM) showing the molecular cavity
defined by four alkyl dications, with encapsulated disordered guest
molecules (space-filling style). This molecule is halogen-bonded to
I– ions at the top and the bottom. (C) Crystal packing
of the same complex viewed along the c-axis. The
α,ω-DIPFA molecules are disordered over two positions.
In (A) only the water H atoms are reported. In (B) no hydrogen atoms
are reported. Color code: carbon, gray; nitrogen, blue; oxygen, red;
iodine, purple; fluorine, yellow; hydrogen, white. XBs and HBs are
dotted black lines.
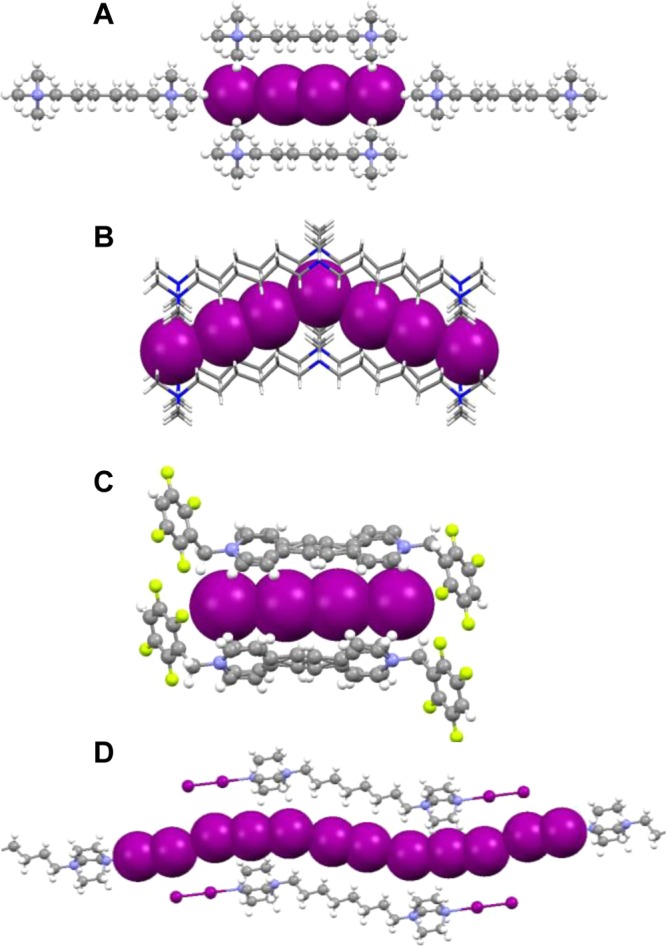
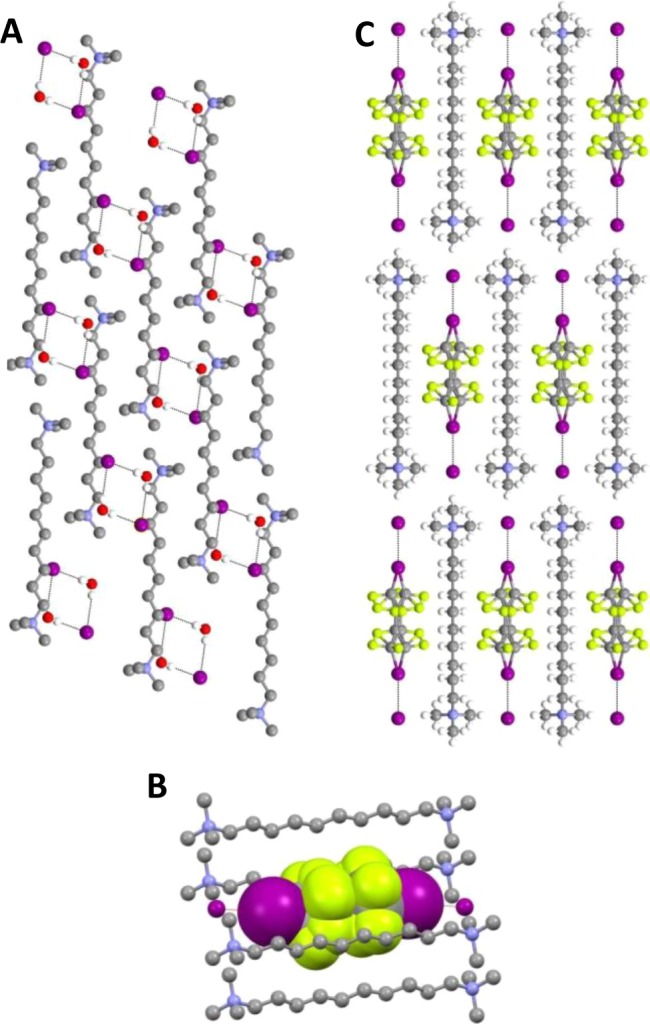
Partial view (ball-and-stick representation)
of the crystal packing
of (A) the discrete I42– anion
hosted in a size-matched cavity formed by four HMET units, (B) the
discrete I73– anion surrounded
by four trication units, (C) the discrete I42– anion caged between two N,N′-bis(tetrafluorobenzyl)-(E)-1,2-bis(4,4′-bipyridinium)ethylene
units (the cations are disordered over two positions), and (D) the
complex containing the discrete pseudolinear dodecaiodide species.
Polyiodide anions are represented in space-filling style. Color code:
carbon, gray; nitrogen, blue; iodine, purple; fluorine, yellow; hydrogen,
white.
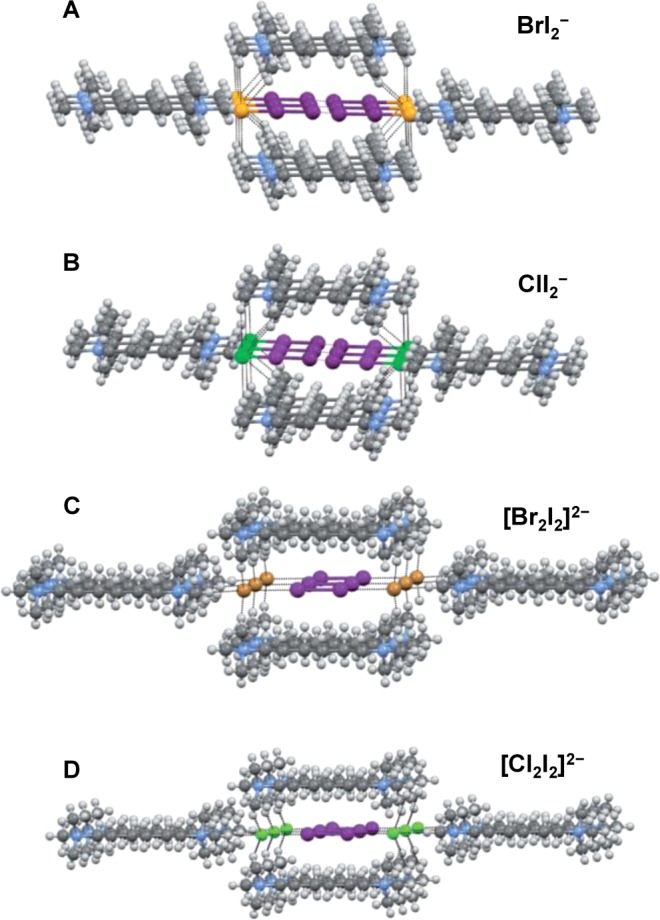
Partial view (ball-and-stick representation)
of the crystal packing
of (A, B) the mixed trihalide adducts HMET·2XI2– (A, X = Br; B, X = Cl) and (C, D) the mixed tetrahalides
[Br2I2]2– (C) and [Cl2I2]2– (D), obtained upon heating
of the corresponding trihalides from (A) and (B). These mixed polyhalides
are held together by XBs and are pinned by HBs in the cavities formed
by four dication units. Color code: carbon, gray; nitrogen, blue;
iodine, purple; bromine, light brown; chlorine, light green; fluorine,
yellow; hydrogen, white. XBs and HBs are dotted black lines.
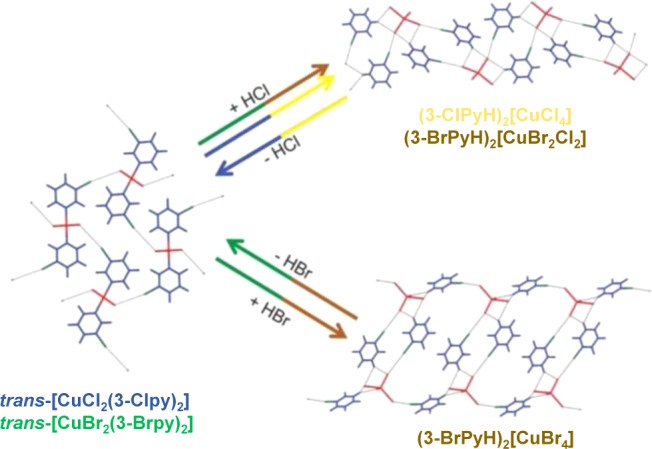
Different structural arrangements observed
in the products of the
reaction between crystalline trans-[CuX2(3-Xpy)2] and HCl or HBr gases. The colors of the arrows
and of the chemical formulas are associated. Metal and halide ligands
are shown in red, organic halogens in green, and all other atoms in
blue (C, H, N). Black dotted lines represent HBs and XBs. Reprinted
with permission from ref (778). Copyright 2011 Royal Society of Chemistry.
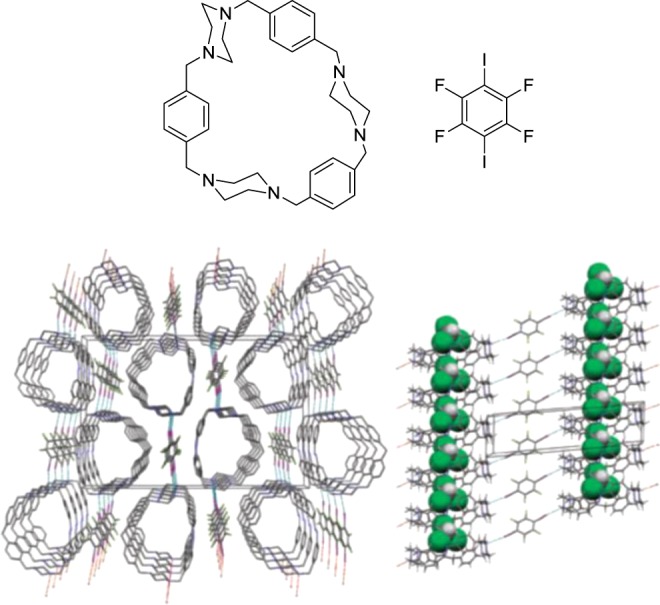
Top: molecular structures
of the used XB donor and acceptor. Bottom:
crystal packing of the halogen-bonded complex showing the ciclophane
tubes. The XB is represented by dotted lines. The included chloroform
molecules are omitted in the left plot and are shown in space-filling
style in the right plot. Reprinted from ref (184). Copyright 2009 American
Chemical Society.
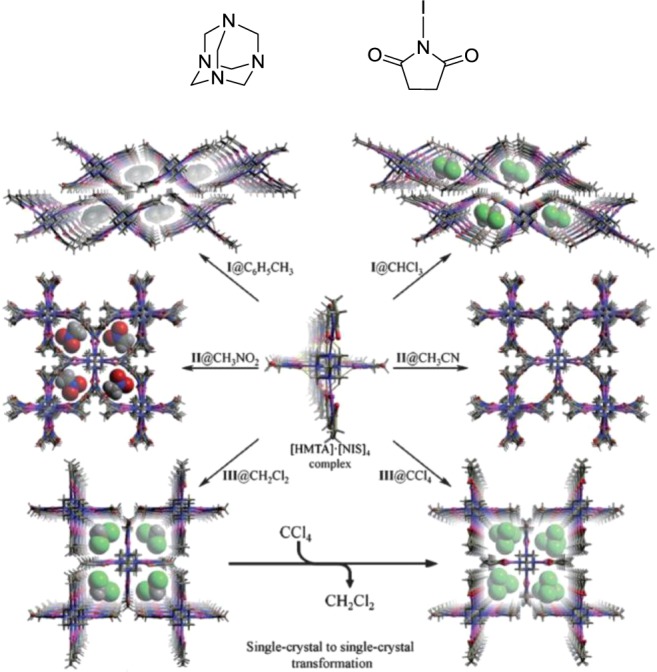
Top: molecular structures of the used XB acceptor
and donor. Bottom:
crystal structures of the [NIS]4···[HMTA]
complexes obtained upon crystallization from different solvents. Crystal
structures of [NIS]4···[HMTA]@C6H5CH3 and [NIS]4···[HMTA]@CHCl3 as well as [NIS]4···[HMTA]@CH3CN and [NIS]4···[HMTA]@CH3NO2 are isomorphs, whereas [NIS]4···[HMTA]@CH2Cl2 and [NIS]4···[HMTA]@CCl4 are different, but can be interconverted via guest molecule
exchange. Adapted with permission from ref (781). Copyright 2012 Royal Society of Chemistry.
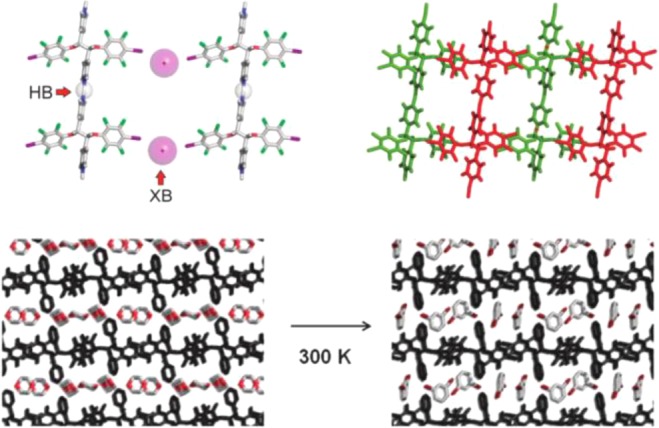
Top left: partial view
(stick representation) of one layer of the
ligand···HI adduct assembled by orthogonal HB and XB.
I– and H+ ions are shown in space-filling
representation. Top right: two adjacent layers (red and green) stack
along the a-axis, resulting in the partitioning of
the void in the rectangular grids. Dioxane molecules have been omitted
for clarity. Bottom: partial views (stick representation) of the single-crystal
X-ray structures of the ligand···HI adducts containing
dioxane (left) and 1,3-dibromobenzene (right). The latter system is
obtained when a crystal of the former is divided into 1,3-dibromobenzene
at room temperature. Reprinted with permission from ref (782). Copyright 2012 Royal
Society of Chemistry.
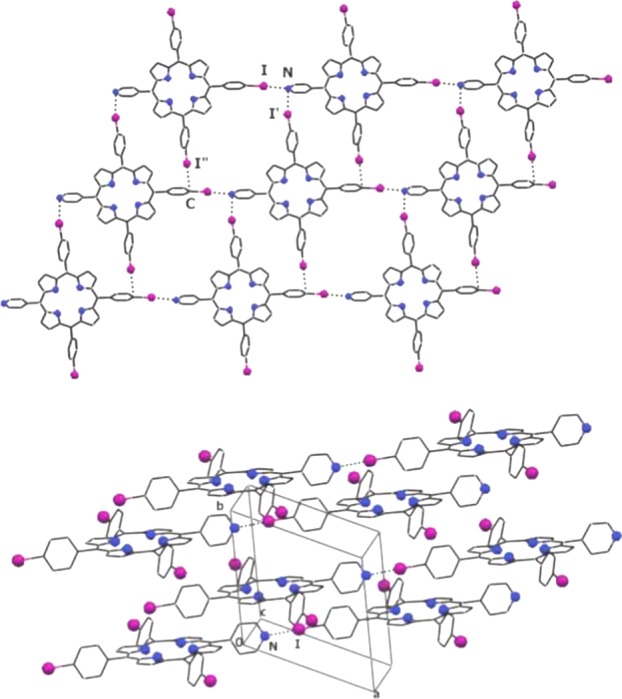
Top: partial view of
a layer formed on assembly of the self-complementary
porphyrin. XBs are in black dotted lines. Bottom: unidirectional arrangement
of two successive layers. Adapted with permission from ref (784). Copyright 2008 Royal
Society of Chemistry.
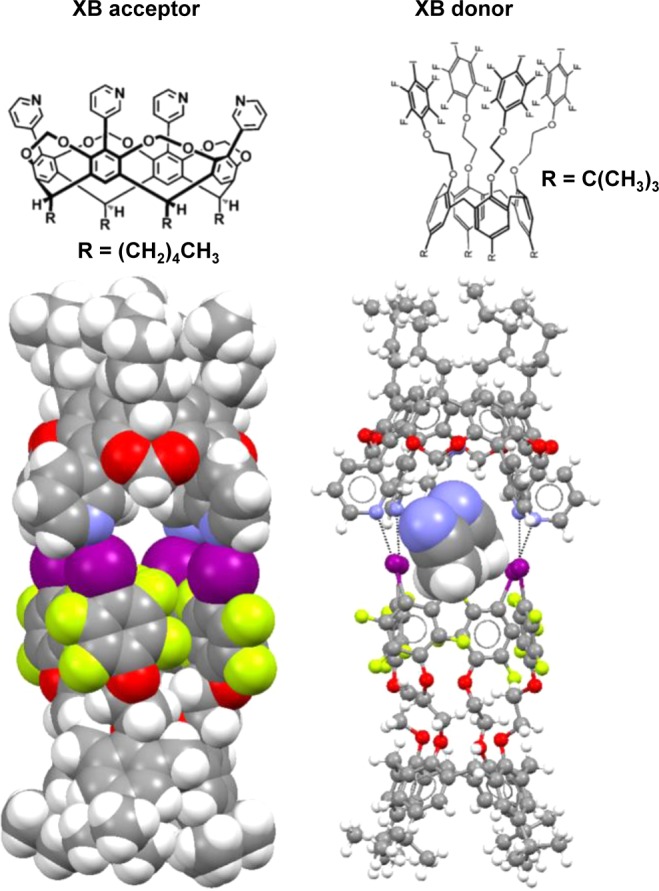
Top: molecular structures of the XB acceptor
(left) and donor (right)
used for the construction of the capsule. Bottom left: space-filling
representation of the molecular capsule assembled via XB. The solvent
molecule are omitted to show the cavity inside the capsule. Bottom
right: ball-and-stick representation of the molecular capsule where
the solvent molecules are shown in space-filling style and I···N
XBs are shown as dotted black lines. Color code: carbon, gray; nitrogen,
blue; oxygen, red; iodine, purple; fluorine, yellow; hydrogen, white.
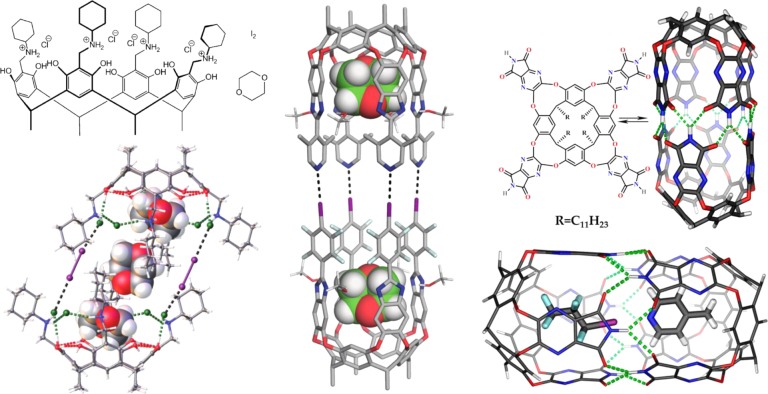
Left: molecular structures
of the XB donor, XB acceptor, and guest
molecule used for the assembly of N. K. Beyeh’s capsule (top)
and ball-and-stick representation of the halogen-bonded dimeric capsule
with three 1,4-dioxane molecules in the cavity as space-filling CPK
models (bottom). The XBs are shown in black and HBs as green and red
dotted lines. Adapted with permission from ref (787). Copyright 2015 John
Wiley and Sons. Middle: calculated model for the capsule developed
by F. Diederich et al. with two 1,4-dioxane guests and four MeOH bridging
units to stabilize intramolecular HB between imidazole walls (nearly
optimized at the DFT:B3LYP/cc-pVDZ-LANL2DZ level of theory). Adapted
with permission from ref (789). Copyright 2015 John Wiley and Sons. Right: chemical formula
of the cavitand used by J. Rebek and co-workers and its computer-modeled
dimeric capsule (top; HBs are shown as green dotted lines) and calculated
model for the capsule with the encapsulated and halogen-bonded dimer
(bottom). Full geometry optimization was carried out, including the
capsule; the basis set for all atoms except iodine is 6-31G(d,p),
and that for I is LANL2DZdp ECP. Adapted from ref (790). Copyright 2013 American
Chemical Society.
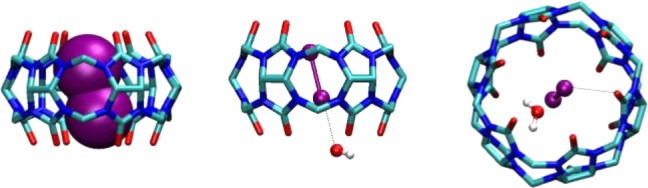
Stick-style views of the single-crystal X-ray
structure of the
cucurbit[6]uril–I2 complex. Encapsulated diiodine,
in space-filling style (left), is halogen-bonded with a water molecule
(middle) and is bound to the carbonyl oxygen at the upper portal (right).
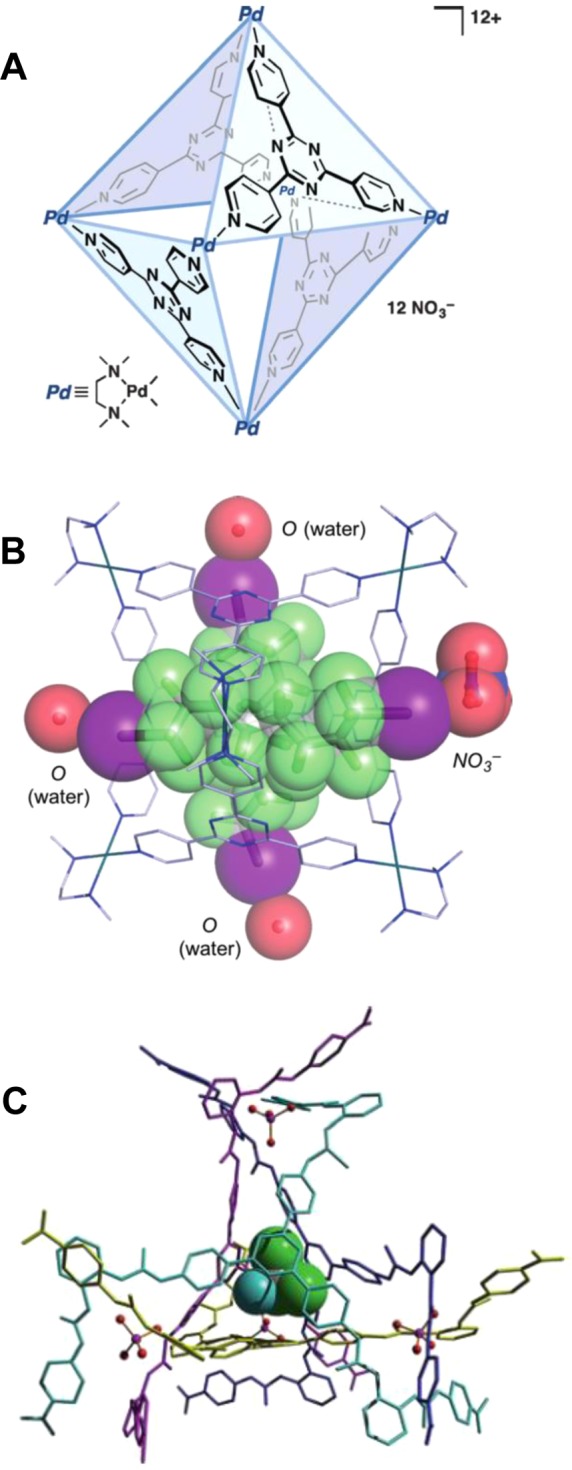
(A) Molecular structure of the self-assembled coordination
cage
by Fujita. (B) Single-crystal X-ray structure of the inclusion complex
between Fujita’s cage (stick representation) and 1,8-diiodoperfluorooctane
(space-filling representation). Two molecules of the XB acceptor are
hosted inside the cage. NO3– anions and
H2O molecules halogen-bonded to diiodoperfluorooctane molecules
are shown as space-filling models. H atoms, NO3– anions, and H2O moleculs that are not involved in XB
have been omitted for clarity. Adapted with permission from ref (795). Copyright 2015 John
Wiley and Sons. (C) Crystal structure of the inclusion complex between
the anion-coordination-based tetragonal cage (stick representation)
and CFCl3. CFCl3 is shown as a space-filling
model. Adapted with permission from ref (796). Copyright 2015 John Wiley and Sons.
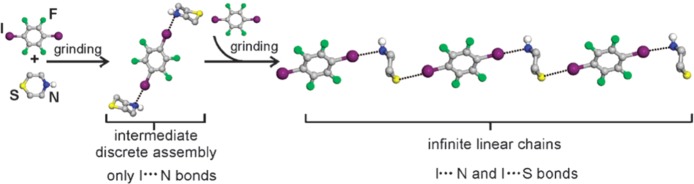
Schematic representation showing that on griding
1,4-diiodotetrafluorobenzene
and thiomorpholine the 1:2 discrete adduct forms initially, which
then evolves into 1:1 infinite chains on further grinding. Adapted
with permission from ref (798). Copyright 2012 Royal Society of Chemistry.
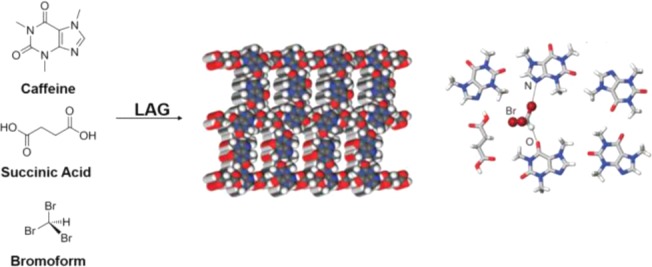
Left: structural formulas of tectons
assembled via LAG methodology.
Middle: (succinic acid)·(caffeine)4 host framework
with guests omitted. Right: view of the hydrogen C–H···O
and halogen Br···N bonds involving the bromoform included
in the (succinic acid)·(caffeine)4 host framework.
Adapted with permission from ref (798). Copyright 2012 Royal Society of Chemistry.
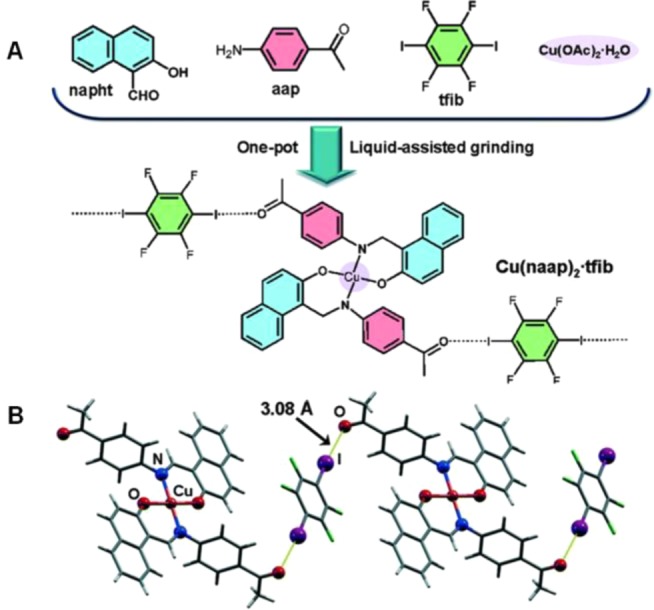
(A) Molecular structures of single compounds
(top) employed in
LAG synthesis of a halogen-bonded MOF (bottom). (B) Partial representation
of the crystal structure resulting from a combination of covalent
bond formation, coordination bonds, and XBs. I···O
XBs are shown as yellow solid lines, and the I···O
distance is reported (Nc = 0.88). Adapted
with permission from ref (801). Copyright 2014 Royal Society of Chemistry.
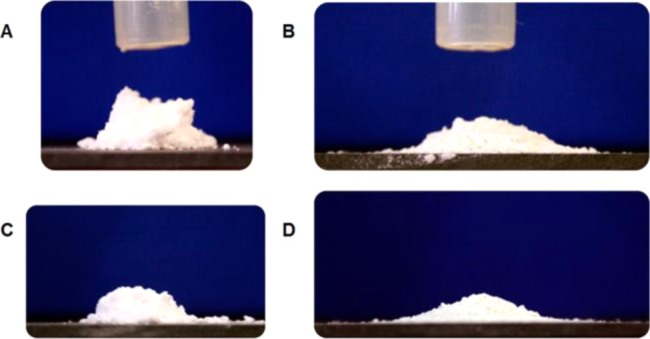
Pictures
of cones of powders of pure IPBC (A, C) and its CaCl2 cocrystal
(B, D), taken after flowing the powders through
a funnel from 25 mm (A, B) and 50 mm (C, D) heights. The cylindrical
shape of the IPBC cones clearly indicates the high cohesion of the
powders, while the flat cone shape of the CaCl2 cocrystal
indicates improved powder flow properties. Reprinted from ref (477). Copyright 2013 American
Chemical Society.
Schematic
representation of the infinite, 1D, and halogen-bonded
ribbons (top), which upon light irradiation in the solid state yield
quantitatively the rctt-tetrakis(4-pyridyl)cyclobutane
(bottom).
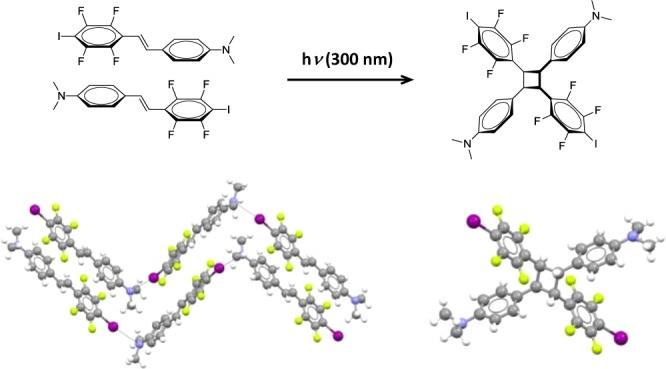
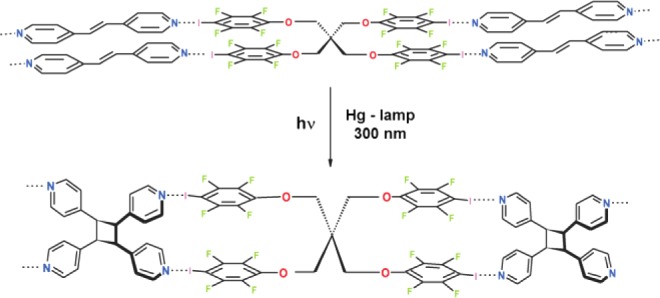
Top: schematic representation of the solid-state photoreaction
of an XB-based self-complementary tecton to yield a tetratopic self-complementary
cyclobutane derivative. Bottom: views of the crystal packing of two
infinite and halogen-bonded chains formed in the solid state by the
starting olefin (left, XBs as dotted black lines), and of the cyclobutane
derivative obtained after UV irradiation (right). Color code: carbon,
gray; nitrogen, blue; iodine, purple; fluorine, yellow; hydrogen,
white. XBs are dotted black lines.
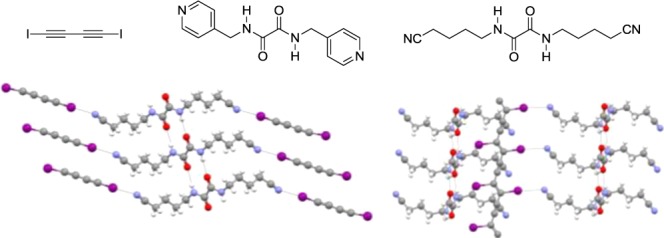
Top: schematic representation of XB donor
and acceptors used for
the photochemical polymerization of diacetylene modules. Bottom: partial
views (ball-and-stick representation) of the 2D supramolecular architecture
given by diiodobutadiyne and bis(4-cyanobutyl)oxalamide (left) and
of the related photoreacted cocrystal between poly(diiododiacetylene)
and bis(4-cyanobutyl)oxalamide (right). Color code: carbon, gray;
nitrogen, blue; oxygen, red; iodine, purple; fluorine, yellow; hydrogen,
white. XBs and HBs are dotted black lines.
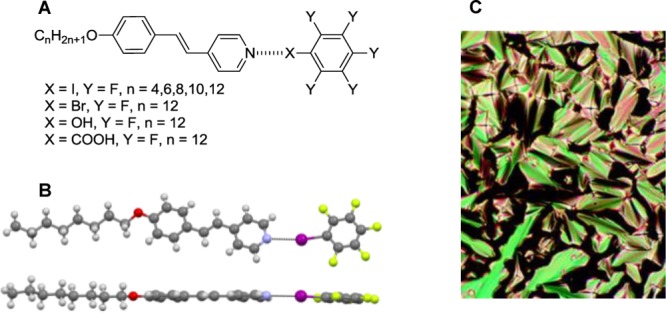
(A) Chemical structures
of the halogen-bonded LCs reported in ref (837) and corresponding hydrogen-bonded
analogues. (B) Crystal structure of the (octyloxy)stilbazole/iodopentafluorobenzene
dimer evidencing the presence of I···N XB (shown as
black dotted lines) and the coplanarity of the aromatic rings. Color
code: gray, carbon; yellow, fluorine; purple, iodine; sky blue, nitrogen;
white, hydrogen. (C) Polarized optical micrograph of the smectic A
texture of the (hexyloxy)stilbazole/iodopentafluorobenzene dimer at
69° upon cooling. Reprinted from ref (837). Copyright 2004 American Chemical Society.
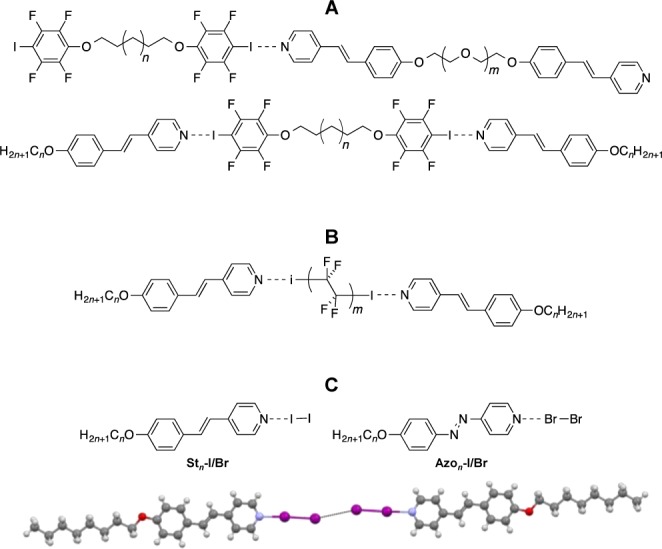
Chemical structures
of high molecular weight polymeric (A, top)
and trimeric (A, bottom) LCs,, trimeric LCs formed
by diiodoperfluoroalkanes (B), and dimeric
systems formed by dihalogens (C, top)., (C) Representation
of the crystal structure of two I2···(octyloxy)stilbazole
dimers interacting via type I I···I contacts. Color
code: carbon, gray; nitrogen, blue; oxygen, red; iodine, purple; hydrogen,
white.
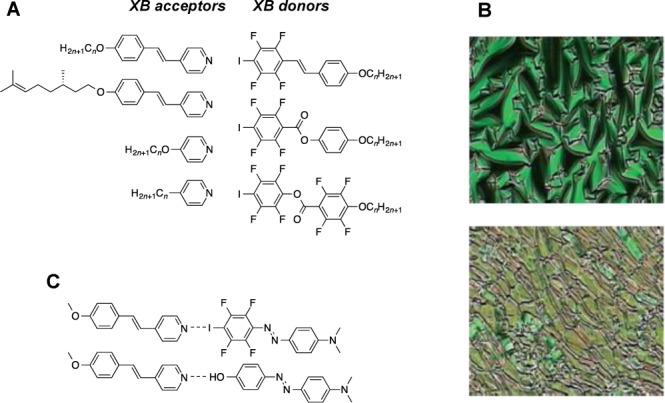
(A) A selection of XB donors and acceptors used in ref (854). (B) Birefringent textures
of complexes formed by an (S)-citronellyl-substituted
stilbazole with a butoxy-substituted iodotetrafluorostilbene, obtained
upon cooling from the isotropic state. (C) Molecular structures of
halogen-bonded (top) and hydrogen-bonded (bottom) stilbazole–azobenzene
complexes. The halogen-bonded complex is liquid-crystalline; the hydrogen-bonded
complex is not.
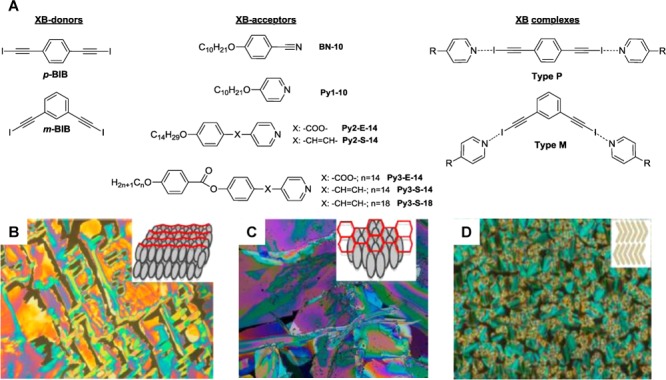
(A)
Chemical structures of the XB donors and acceptors used in
ref (573) and the general
structures of the halogen-bonded complexes. Birefringence textures
of the crystal G phase of the p-BIB/p-(decyloxy)pyridine complex (at 86 °C) (B), the smectic B phase
of the p-BIB/p-[[p-(tetradecyloxy)benzoyl]oxy]stilbazole complex (at 108 °C) (C),
and the smectic AP phase of the m-BIB/p-tetradecyloxy)stilbazole complex (at 131 °C) (D). Reprinted
from ref (573). Copyright
2013 American Chemical Society.
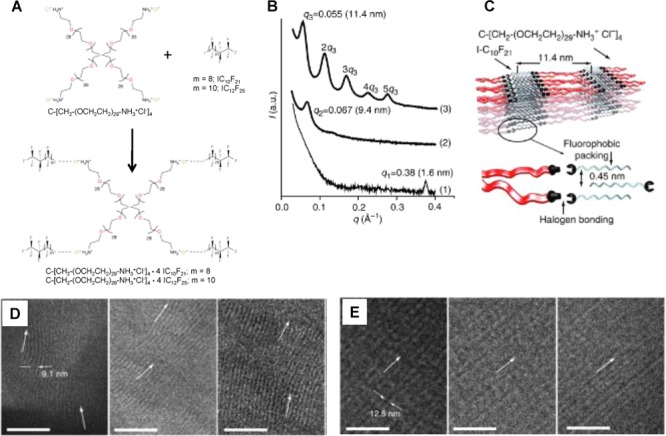
(A) Chemical structures
of the PEG–iodoperfluoroalkane complexes
used in ref (484).
(B) Small-angle X-ray scattering patterns for iodoperfluorodecane
(graph 1), PEG (graph 2), indicating poor self-assembly by segregation
of the ionic end groups from the PEG core, and the supramolecular
complex (graph 3), showing highly ordered self-assembly. (C) An illustration
of the self-assembly mechanism of the halogen-bonded complex. (D)
TEM micrographs at various locations of pure PEG showing a lack of
macroscale alignment. (E) TEM micrographs of the halogen-bonded complex
between PEG and 1-iodoperfluorododecane, showing exceptionally well-ordered
lamellar nanostructures with overall macroscale order on the millimeter
scale. The scale bars correspond to 100 nm. Reprinted with permission
from ref (484). Copyright
2014 Nature Publishing Group.
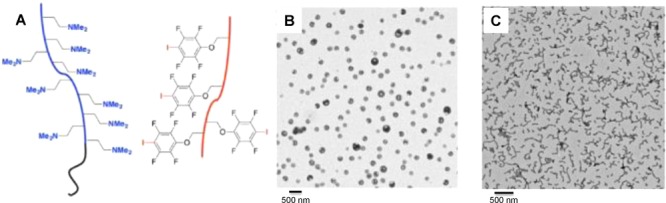
Cartoon representing
complementary halogen-bonded polymers (A)
and self-assembly in solution into vesicle (B) and wormlike (C) structures,
as observed by TEM micrographs. Adapted from ref (861). Copyright 2015 American
Chemical Society.

(A) Chemical structures
of the compounds used in ref (83) to obtain supramolecular
low molecular weight gels. (B) X-ray crystal structure of the 1:1
adduct between 1,4-DITFB and BPUB, which confirms the presence of
gel-forming urea tapes cross-linked by XBs involving the pyridyl groups.
(C, D) Scanning electron micrographs of dried 1:1 cogels formed by
4,4′-DP with BIPUB, and by BPUB with BIPUB, respectively. (E)
Photograph of the 1,4-bis(3-pyridylureido)butane/1,4-bis[(4-iodotetrafluorophenyl)ureido]butane
cogel. Reprinted with permission from ref (83). Copyright 2013 Nature Publishing Group.

(A) XB (dotted black
line) between the Br of IDD594 and the O(γ)
of Thr113 in human aldose reductase. (B) Atomic structure of d(CCAGTACBr5UGG), with bromine atoms rendered as spheres and the deoxyribose
backbones as solid ribbons. Panel A reprinted with permission from
ref (27). Copyright
2011 Royal Society of Chemistry. Panel B reprinted from ref (878). Copyright 2003 American
Chemical Society.

(A) Chemical formulas of the thyroid
hormones T4 and T3. (B) HBs
formed by T3 and (C) XBs formed by T4 with TTR. Reprinted with permission
from ref (885). Copyright
2015 Springer.
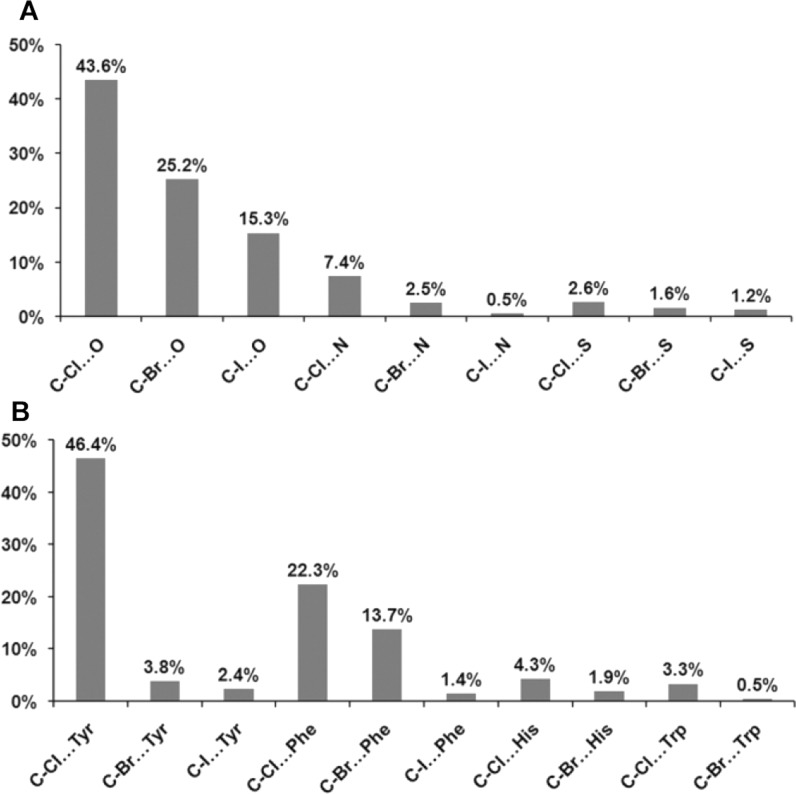
XBs in the PDB, divided as (A) C–X···Y and
(B) C–X···π contacts (X = Cl, Br, I).
Reprinted from ref (871). Copyright 2013 American Chemical Society.
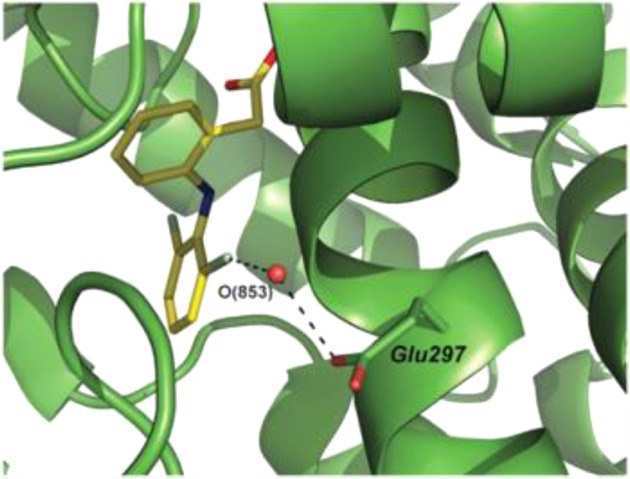
Diclofenac–cytochrome P450 complex showing that
a water
molecule forms at the same time an XB with one Cl atom of diclofenac
(shown in pale green) and an HB with a carboxyl oxygen of the Glu297
side chain. Reprinted with permission from ref (27). Copyright 2011 Royal
Society of Chemistry.
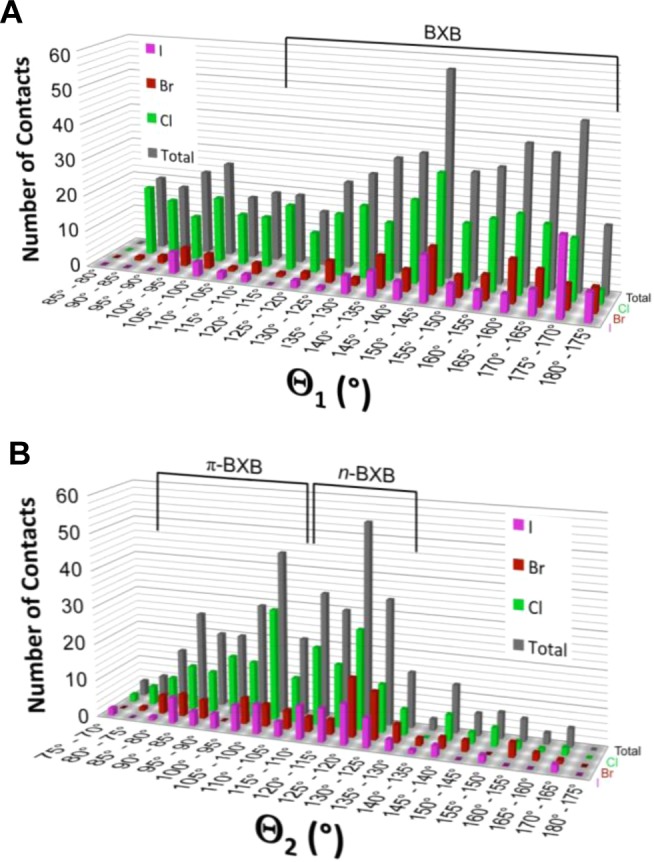
Number of short contacts
involving halogens as a function of the
angles: (A) C–X···B (θ1) and
(B) C–B···X (θ2). π-BXB
and n-BXB indicate biomolecular halogen bonds of
the type C–X···π and C–X···Y,
respectively. Reprinted with permission from ref (885). Copyright 2015 Springer.
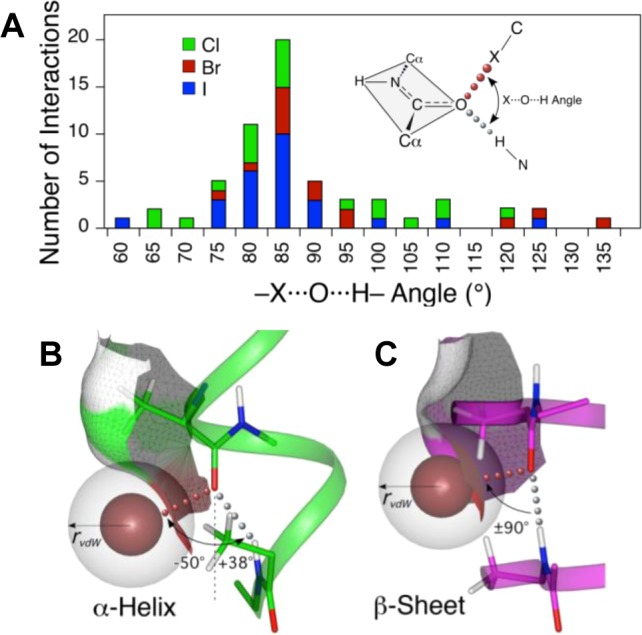
(A) Distribution
of the relative angle of approach of HBs and XBs
to a common Lewis base, subdivided by the halogen involved. Representations
of the orthogonality of XBs and HBs in β-sheets (B) and α-helices
(C); the white sphere represents the van der Waals radius of a Br
atom. Reprinted with permission from ref (250). Copyright 2009 Nature Publishing Group.

Competition between hydrogen-bonded
(cyan strand) and halogen-bonded
(magenta strand) structures in a four-stranded DNA junction. Reprinted
with permission from ref (885). Copyright 2015 Springer.
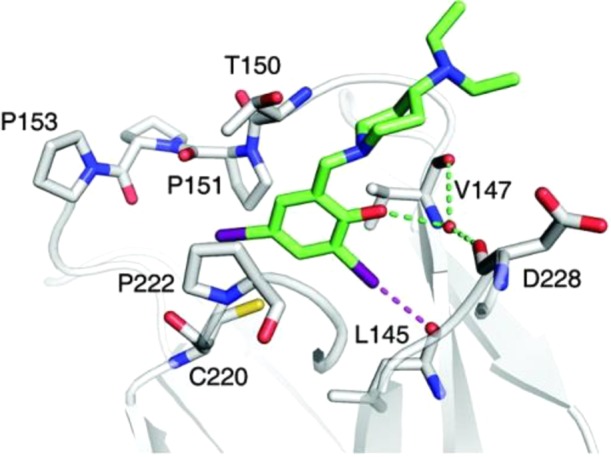
Crystal
structure of the complex between the binder PhiKan5196
and the p53 mutant Y220C. The iodine atom is shown in magenta and
forms an XB with the carbonyl oxygen of Leu145. Adapted from ref (946). Copyright 2012 American
Chemical Society.
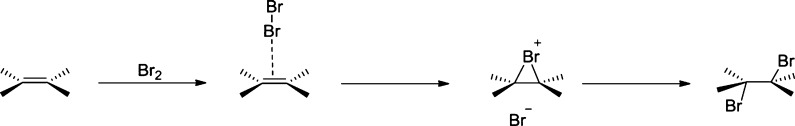
Representation of a schematic model of the mechanism of
bromination
of alkenes evidencing the formation of halogen-bonded adducts of the
type X···π.
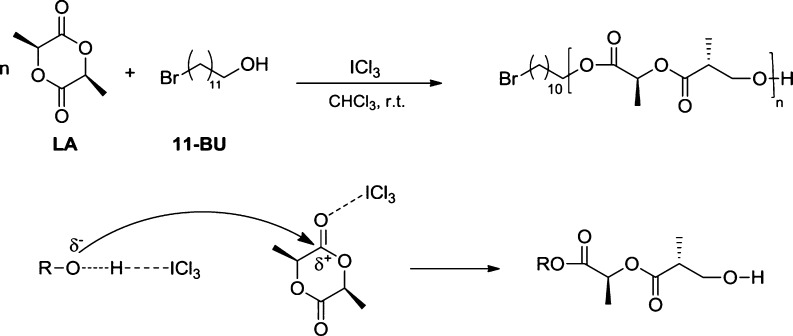
Top: polymerization
of l -lactide to poly(l -lactide)
with ICl3. Bottom: proposed mechanism for the 2-fold activation.
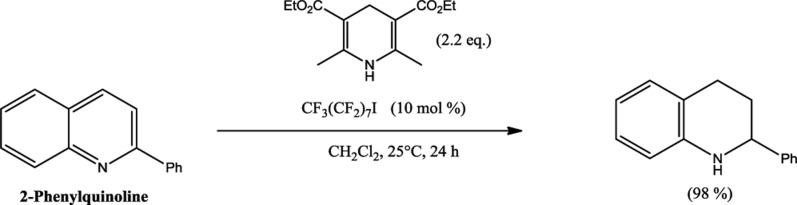
Reduction of 2-phenylquinoline
in the presence of 1-iodoperfluorooctane.
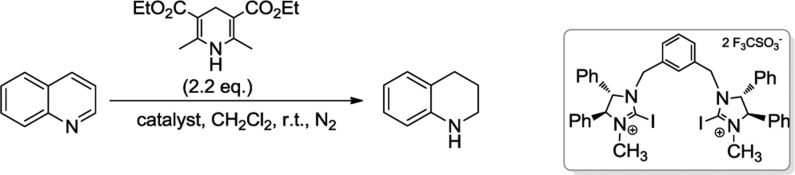
Hydrogenation of quinoline with the
Hantzsch ester in the presence
of a bidentate XB donor catalyst based on a dihydroimidazoline core
(right).
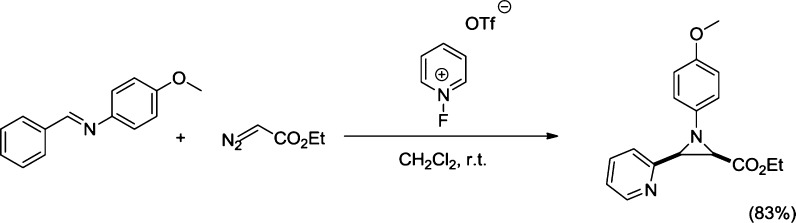
Aziridine
synthesis in the presence of the fluoronium cation F+.
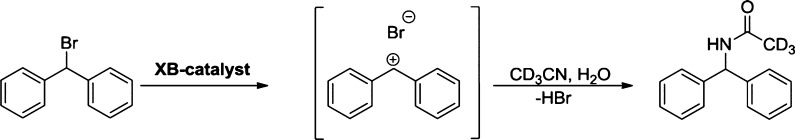
Solvolysis
of benzhydryl bromide as a model reaction.
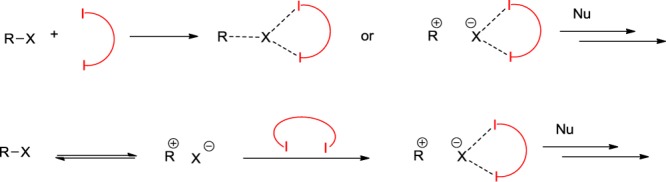
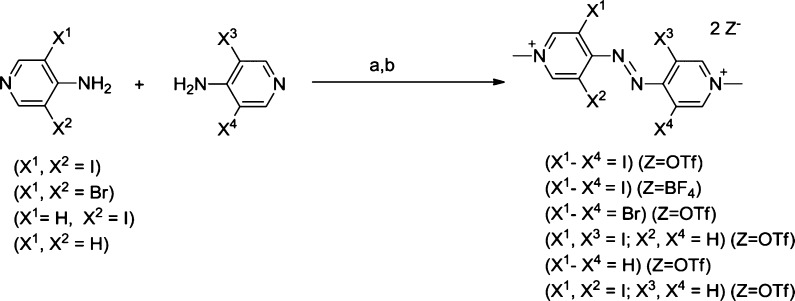
Possible modes of activation of a halogenated substrate by the
bidentate XB donor catalyst (shown in red).
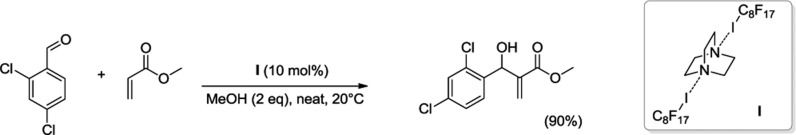
Halogenated and hydrogenated
activating reagents.
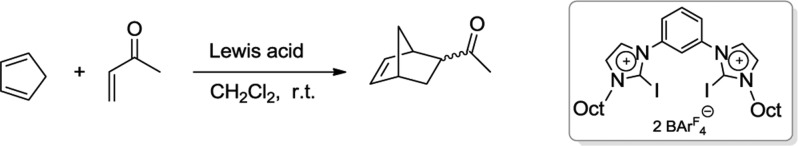
Left: Diels–Alder benchmark reaction.
Right: dicationic
XB donor activating agent BArF = B[3,5-(CF3)2C6H3]4–.
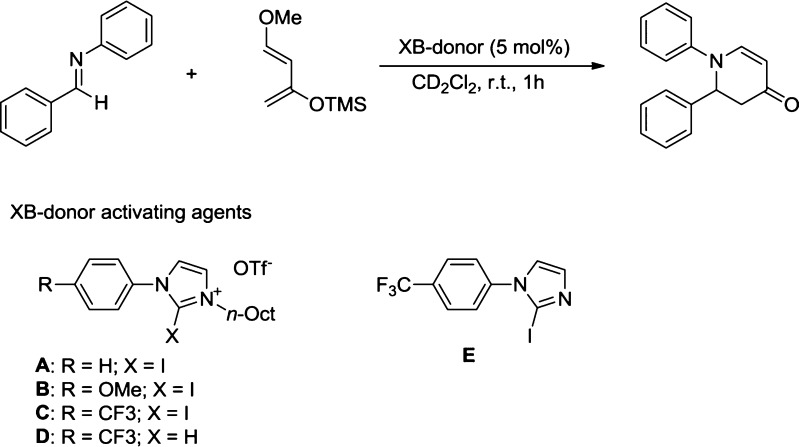
Top: Aza-Diels–Alder
reaction of an aldimine with the Danishefsky
diene. Bottom: structure of the used XB donor activating agents.
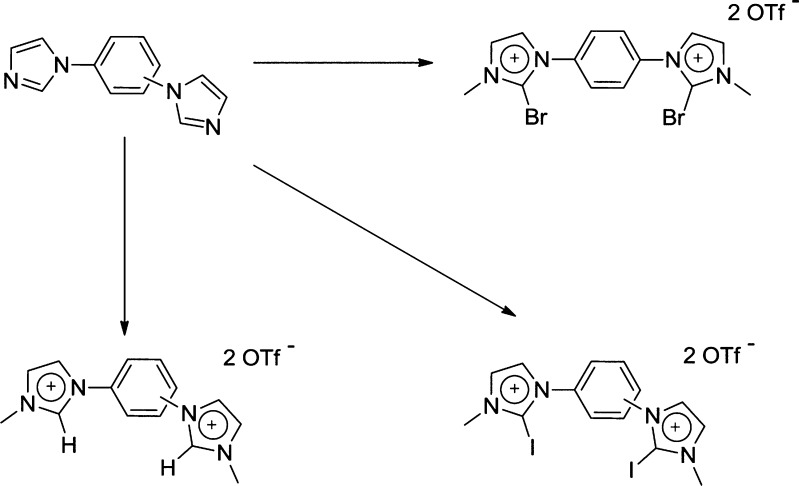
Synthesis of 4,4′-azobis(halopyridinium)-based
XB donors
and reference compounds.
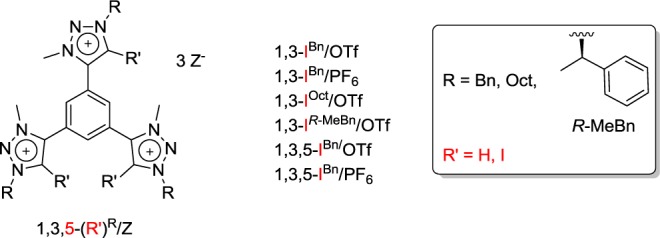
Bi- and tridentate
polycationic XB donors based on the 5-iodo-1,2,3-triazolium
synthon.
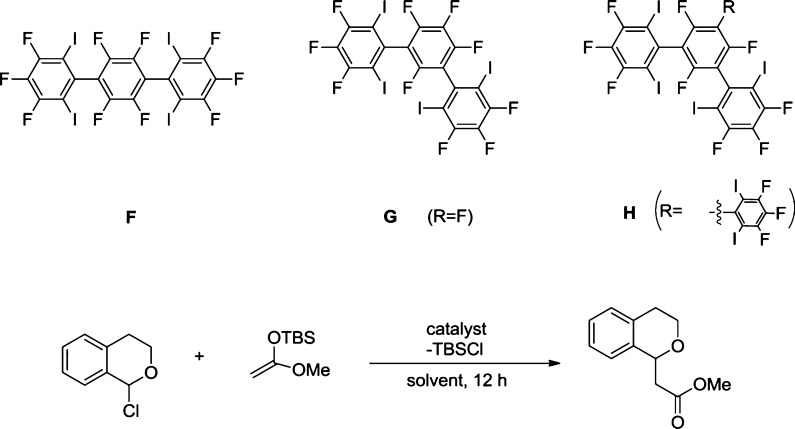
Top: structures of
neutral polyfluorinated XB donors. Bottom: selected
test reaction of 1-chloroisochromane (left) to the corresponding ester.
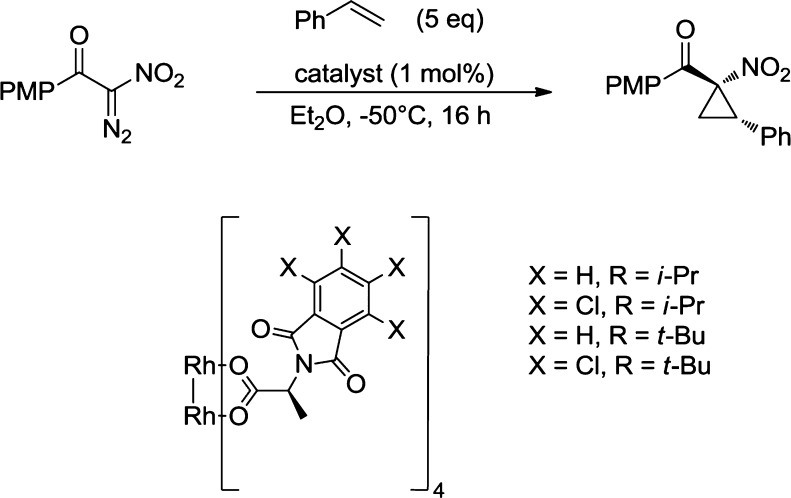
Cyclopropanation
reaction with different Rh-based halogenated catalysts.
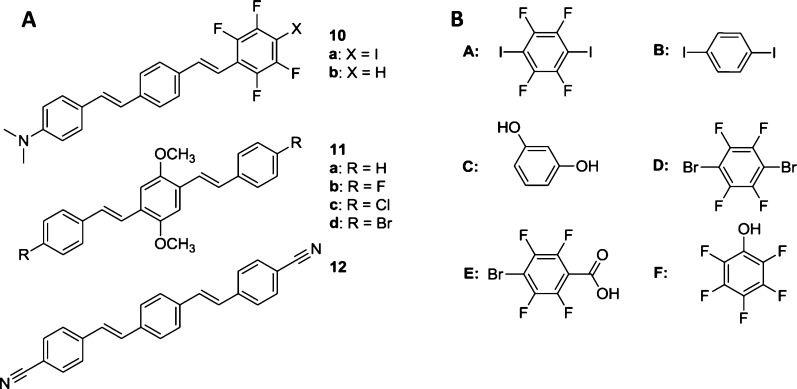
A selection of (A)
fluorophores studied in refs (486), (1001),
and (1002) and (B)
halogen/hydrogen
bond donors cocrystallized with 12 in ref (1002).
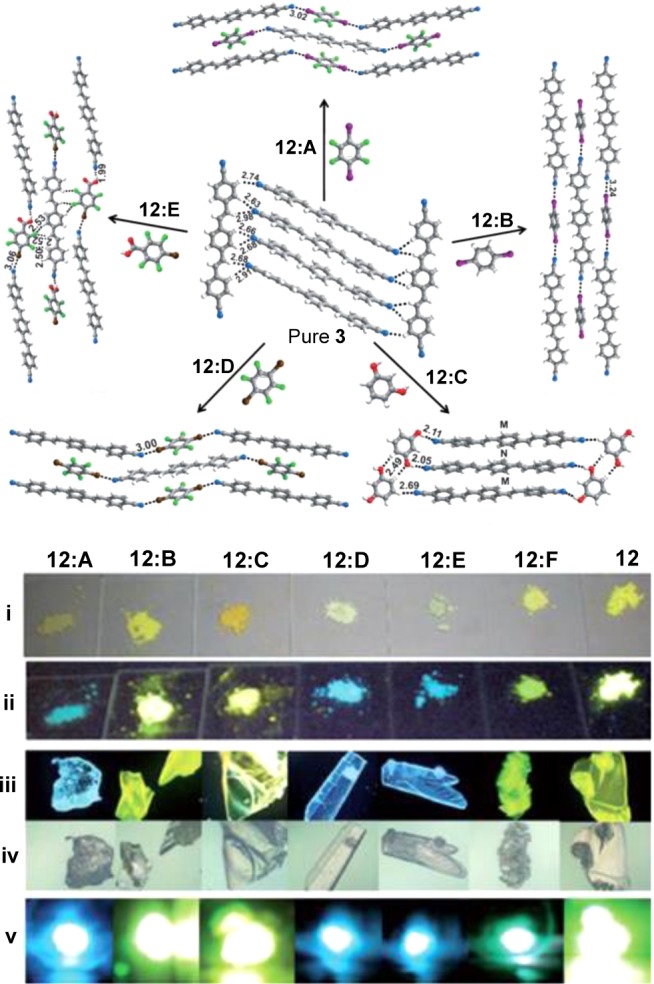
Top: crystal structures of pure 12 and related cocrystals 12:A, 12:B, 12:C, 12:D, and 12:E, which each shows
a distinct packing. Bottom: photographs
of samples of pure 12 and of the related cocrystals.
(i, ii) Powder samples under daylight and UV illumination, respectively.
(iii, iv) Single-crystal samples under UV illumination and daylight
as observed through a fluorescence microscope (50×). (v) Two-photon
luminescence under 800 nm laser excitation. Reprinted with permission
from ref (1002). Copyright
2011 Wiley-VCH.
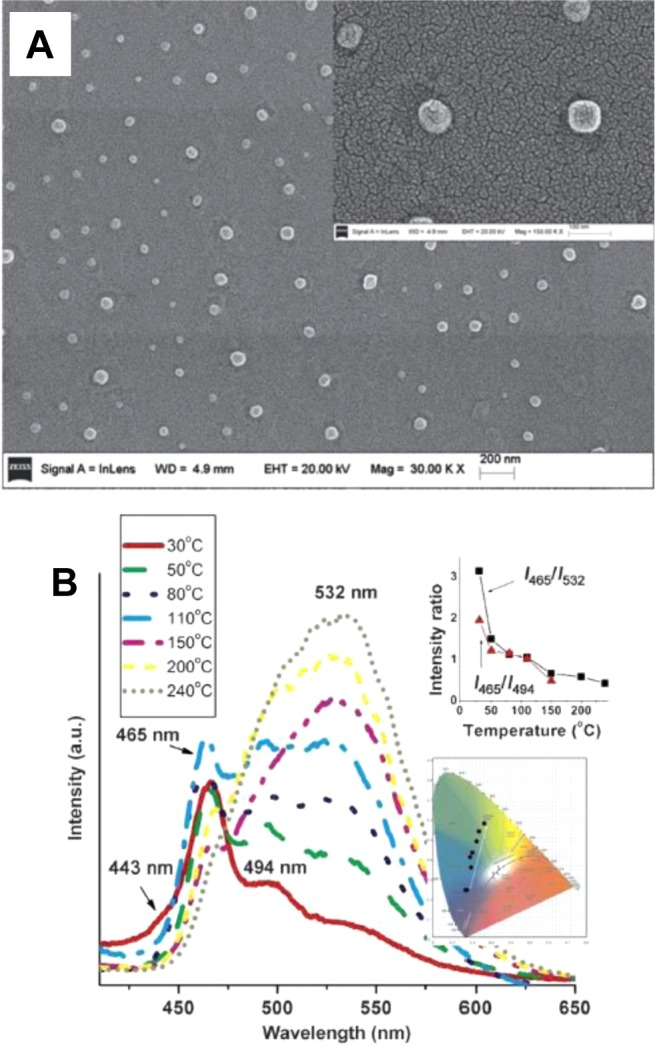
(A) Scanning electron
micrograph of the 12:A nanococrystals. (B)
Fluorescence spectra of the nanococrystals at
different temperatures. The inset shows the fluorescenece intensity
ratios at I465nm/I532nm and the dependence of the color coordinates on the temperature.
Reprinted with permission from ref (1003). Copyright 2013 Wiley-VCH.
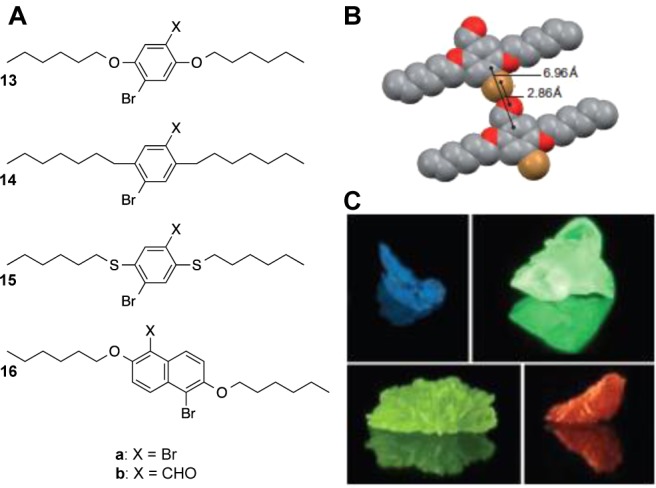
(A) Chemical structures of the hosts a and aldehydes b used in ref (1004). (B) Schematic depiction
of the crystal packing of 13b, highlighting the carbonyl
oxygen–bromine XB. It
is believed that this contact is responsible for the phosphorescence
observed from crystals of 13b (C). Reprinted with permission
from ref (1004). Copyright
2011 Nature Publishing Group.
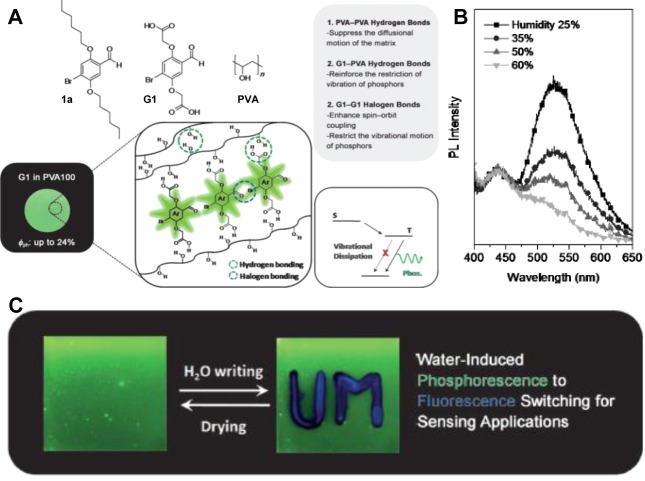
(A) Top: the new organic phosphor G1 appears particularly
promising in enhancing phosphorescence in an amorphous PVA matrix.
Bottom: the green phosphorescence of G1 embedded in PVA
is explained by synergistic effects brought about by simultaneous
use of halogen and hydrogen bonds. (B) The phosphorescence emission
of 1 wt % G1 in PVA depends linearly on the humidity,
while the fluorescence emission is insensitive to the humidity, which
allows (C) fluorescent watermarks to be reversibly written onto the
amorphous polymer film. Reprinted with permission from ref (1011). Copyright 2014 Wiley-VCH.
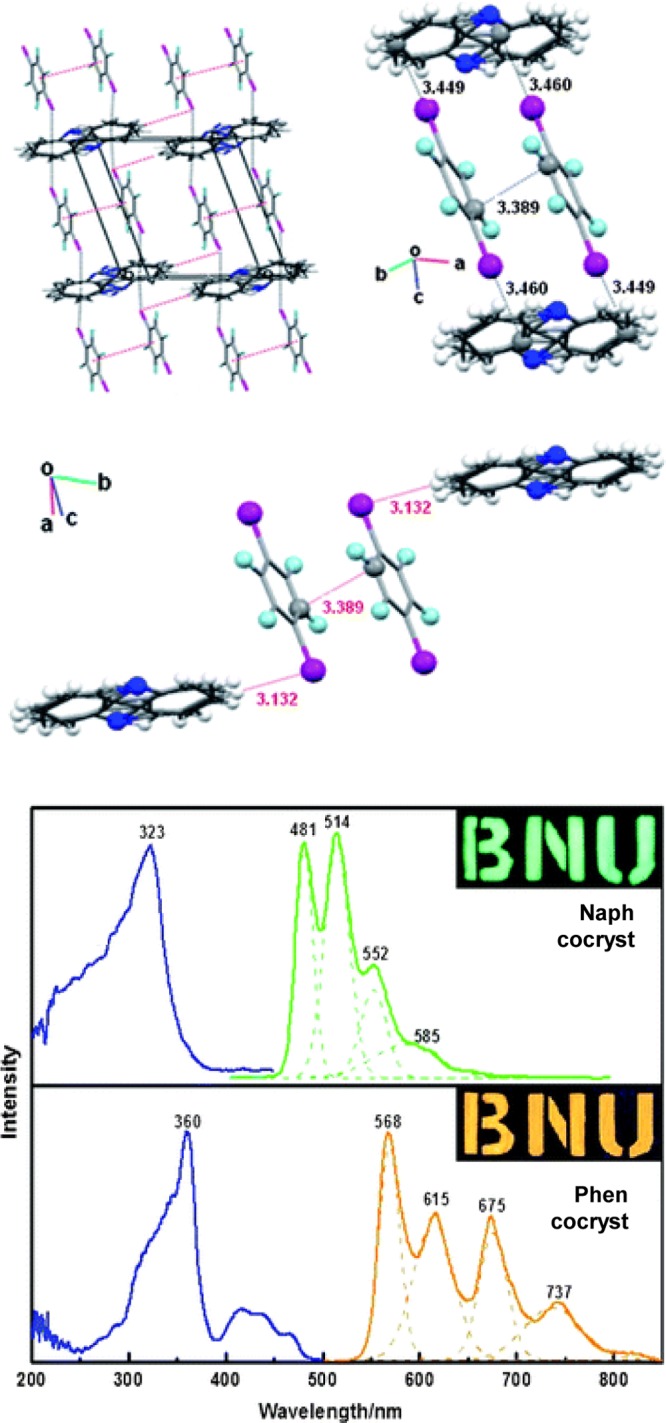
Top: infinite-chain structure of the carbazole/1,4-diiodotetrafluorobenzene
cocrystals (left), driven by C–I···π XBs
and further stabilized by π–π stacking (right).
The adjacent chains are linked together by C–H···I
HBs (bottom). Reprinted with permission from ref (1013). Copyright 2012 Royal
Society of Chemistry. Bottom: phosphorescence excitation and emission
from naphthalene/1,4-diiodotetrafluorobenzene (top) and phenanthrene/1,4-diiodotetrafluorobenzene
(bottom) cocrystals. The insets display the phosphorescence color
of the cocrystals under UV excitation through a mask. Reprinted with
permission from ref (649). Copyright 2012 Royal Society of Chemistry.
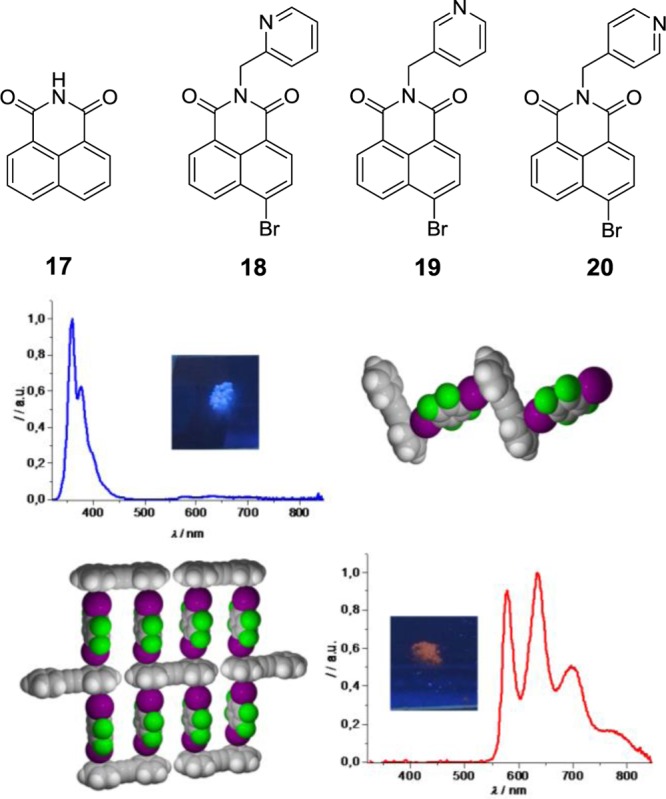
Top: chemical structures
of the 1,8-napthalimide (17) derivatives with 4-bromine
substitution and 2-, 3-, and 4-methylpyridine
substitution at the imidic N-position (18, 19, and 20, respectively) used in ref (1019). Bottom: by controlling
the stoichiometry of diphenylacetylene/1,4-diiodotetrafluorobenzene
cocrystals from 1:1 (top) to 1:2 ratios (bottom), the photoluminescence
can be “switched” between fluorescence and phosphorescence.
Reprinted from ref (1021). Copyright 2015 American Chemical Society.
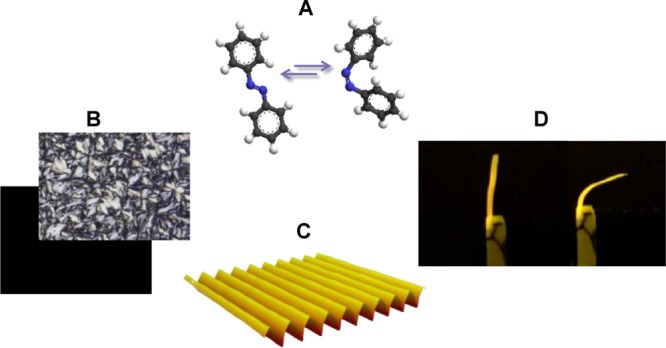
Photoisomerization of azobenzene (A) can give rise to
a cascade
of molecular motions into a material system it is incorporated into.
The most relevant examples in the context of halogen-bonded functional
materials are (B) photoinduced phase transitions in liquid-crystalline
materials, (C) photoinduced surface patterning of initially flat polymer
surfaces, and (D) photoinduced bending of azobenzene-containing cross-linked
liquid-crystalline polymers or molecular (co)crystals. Reprinted with
permission from ref (1040). Copyright 2005 Optical Society of America.
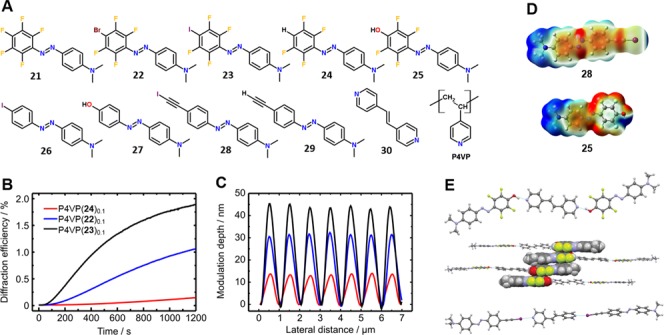
(A) Chemical structures of the azobenzene
compounds studied in
refs (859) and (855). Comparison of (B) the
diffraction kinetics and (C) the AFM surface profile of thin films
of complexes between 22–24 and P4VP
(10 mol % azobenzenes in a P4VP matrix). The samples were spin-coated
on silicon substrates, and their thickness was ca. 90 nm. Reprinted
with permission from ref (859). Copyright 2012 Wily-VCH. (D) Electrostatic potential surfaces
of compounds 28 (top) and 25 (bottom), ranging
from −0.03 (red) to 0.03 (blue) au. (E) Ball-and-stick representation
of the crystal packing of 30·(25)2 (top) and 30·(28)2 (bottom). Middle: view along the crystallographic b-axis of the cocrystal 30·(25)2, illustrating the tendency of 25 to interact
via quadrupolar stacking. Reprinted with permission from ref (855). Copyright 2015 Royal
Society of Chemistry.
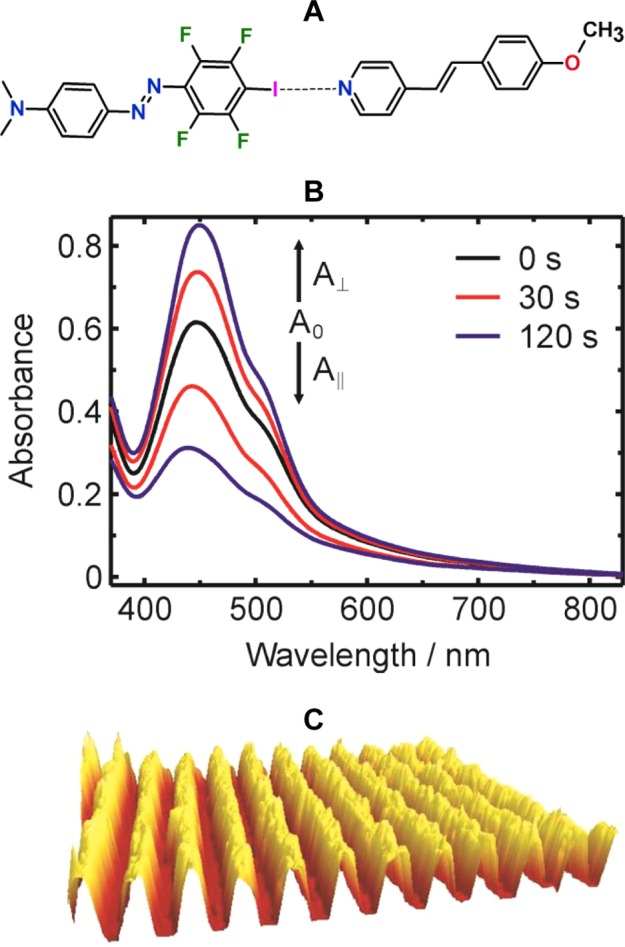
(A) Chemical structure of the halogen-bonded liquid-crystalline
complex employed in ref (489). (B) Polarized absorption spectra of a thin film (250 nm)
of the complex shown in (A). Black curve: initial spectrum (same for
both polarizations). The red and blue curves correspond to the polarized
absorption spectra in the directions parallel (A∥ < A0) and perpendicular
(A⊥ > A0) to the
polarization
plane, taken after 30 and 120 s of irradiation (488 nm, 100 mW/cm2), respectively. The absorption anisotropy is an unambiguous
sign of photoinduced reorientation of the azobenzene chromophores.
(C) Atomic force microscopy view of the spin-coated thin film of the
complex shown in (A) after SRG inscription (5 min, 488 nm, 300 mW/cm2). The surface-modulation depth after the SRG inscription
was 600 nm, 2.4 times the initial film thickness. Reprinted with permission
from ref (489). Copyright
2012 Wiley-VCH.
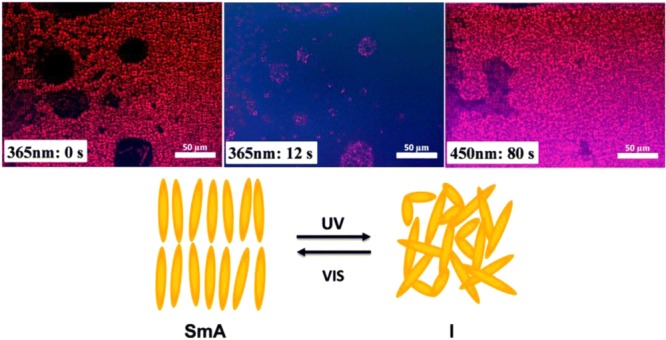
Polarized optical micrographs
of an azopyridine–I2 complex (see Figure 107C) at its liquid-crystalline
phase before (left) and after
(right) UV irradiation. The decreased contrast indicates photoinduced
phase transition due to trans–cis photoisomerization.
Upon irradiation with visible light, the colored pattern can be retained
due to reverse cis–trans isomerization. Reprinted
with permission from ref (851). Copyright 2014 Royal Society of Chemistry.
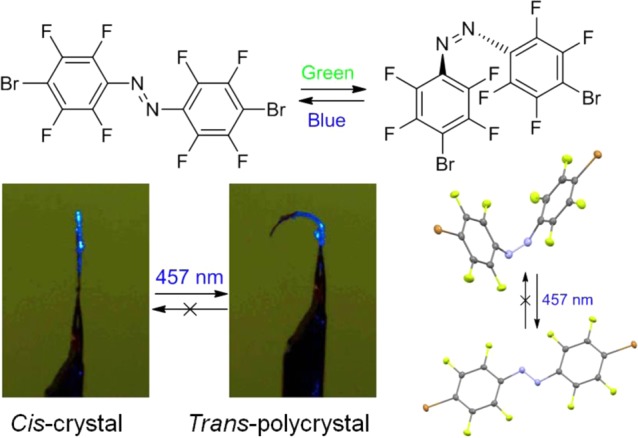
Top: trans- and cis-forms of
4,4′-dibromoperfluoroazobenzene. Bottom right: in the crystal
state, the photoisomerization proceeds only from the cis- to the trans-state, not vice versa. Upon cis-to-trans isomerization, thin crystals
bend irreversibly away from the irradiation source. Reprinted from
ref (1026). Copyright
2013 American Chemical Society.
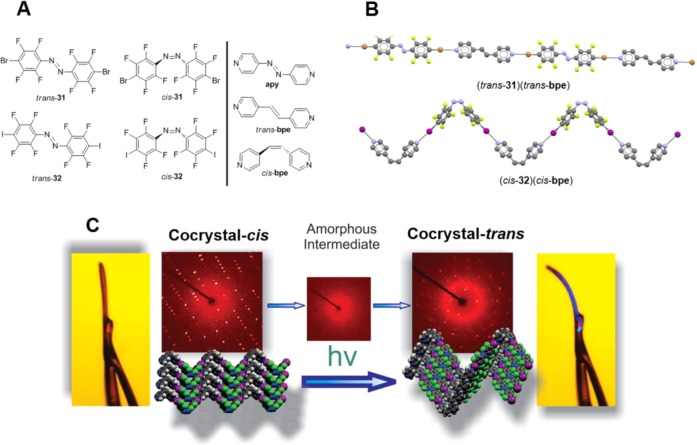
(A) Compounds used
in ref (1027). (B)
Linear structure of supramolecular chains of (trans-31)·(trans-bpe)
and the zigzag structure of (cis-32)·(cis-bpe) as determined
by single-crystal X-ray diffraction analysis. (C) Photoinduced bending
of halogen-bonded cocrystals, followed by in situ X-ray diffraction,
reveals that the transition from the unbent cis-single
crystal to the bent polycrystalline trans-state proceeds
through an amorphous intermediate phase. Reprinted with permission
from ref (1027). Copyright
2014 Royal Society of Chemistry.
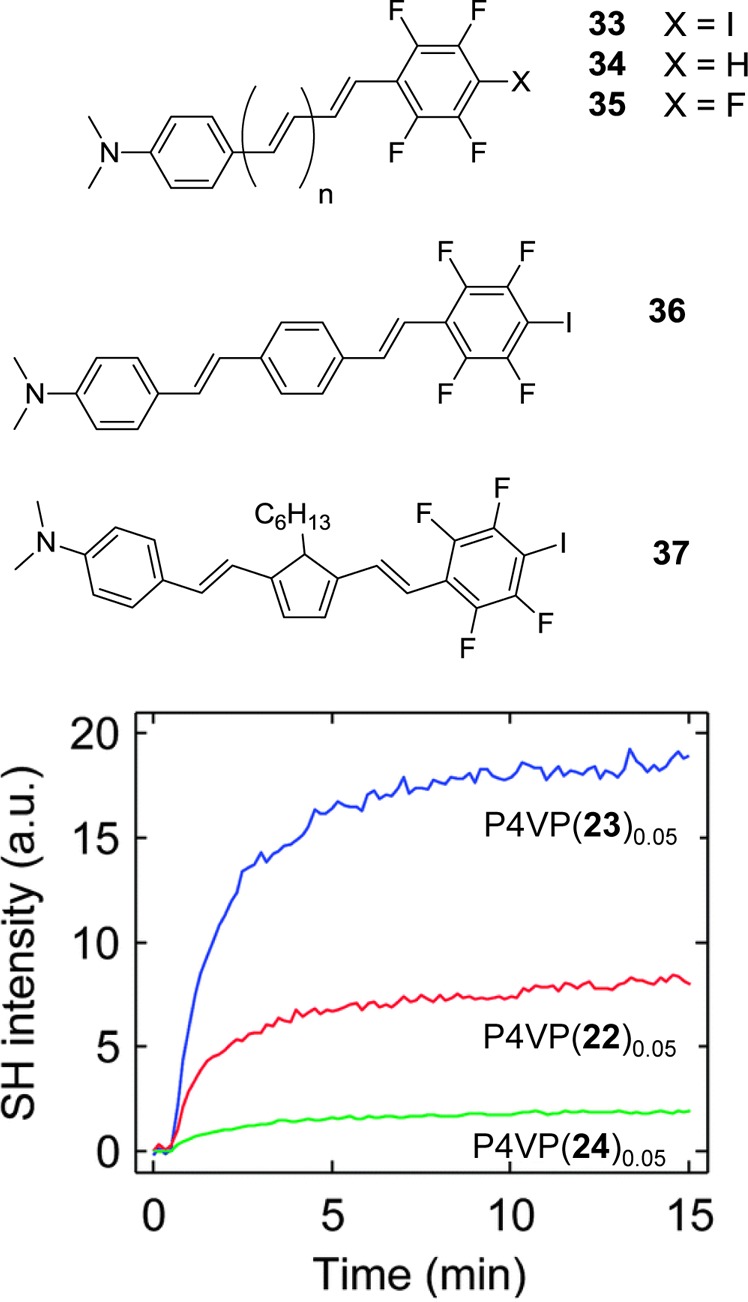
(A, top)
A selection of NLO-phores containing XB donor groups.
(B, bottom) Upon optical poling of azobenzene chromophores 22, 23, and 24 of Figure 144A in a P4VP matrix (the molar ratio between
the azobenzenes and the polymer repeat units is 1:20), XB clearly
boosts the second-order nonlinear optical response of the material
system. Reprinted with permission from ref (860). Copyright 2015 Royal Society of Chemistry.
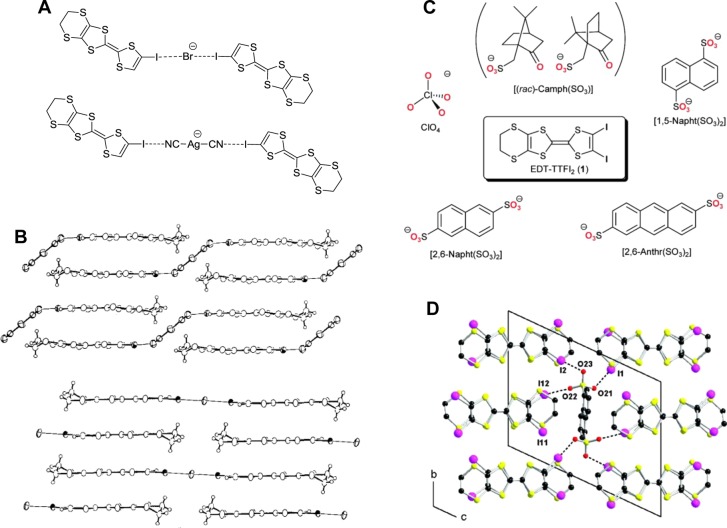
(A) Halogen-bonded
radical cation salts formed between partially
oxidized halogenated TTF molecules and halide (top) or cyanometalate
(bottom) anions were the first examples of halogen-bond-based molecular
conductors. (B) Crystal structures of
the Ag(CN)2 (top) and Br– (bottom) salts.
Reprinted with permission from ref (600). Copyright Elsevier 1995. (C) Chemical structures
of the TTF cation and various anions used in ref (1074). (D) Projection view,
along the stacking axis, of the unit cell of the salt (38)4[1,5-Napht(SO3)2], showing
the XBs as dotted lines. Reprinted from ref (1074). Copyright 2011 American
Chemical Society.

(A) Chemical structures
of a cation radical (TSF) and the XB donor
(HFTIEB) used to construct sheathed molecular nanowires. (B) and (C)
display the crystal structure and the CPK model of TSF stacks isolated
by a network of HFTIEB and Cl– ions. Reprinted from
ref (1080). Copyright
2008 American Chemical Society.
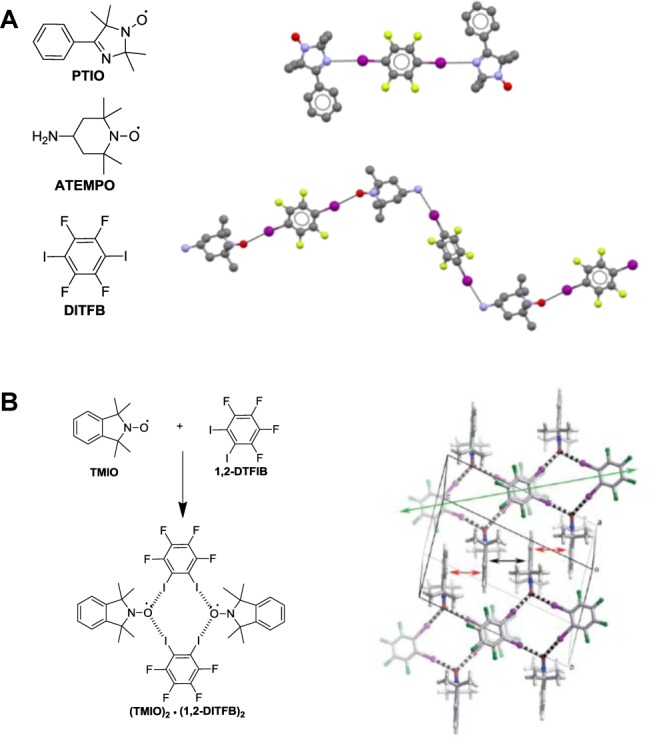
(A) Self-assembly of DITFB with (2-phenyl)-4,4,5,5-tetramethylimidazolin-1-oxyl-3-oxide
(PTIO) gives rise to trimeric complexes (top right), while complexes
between DITFB and ATEMPO assemble into linear chains (bottom right).
Reprinted with permission from ref (610). Copyright 2006 Elsevier. (B) The assembly
between TMIO and 1,2-DITFB results in a cyclic tetrameric complex.
Reprinted with permission from ref (1084). Copyright 2011 Royal Society of Chemistry.
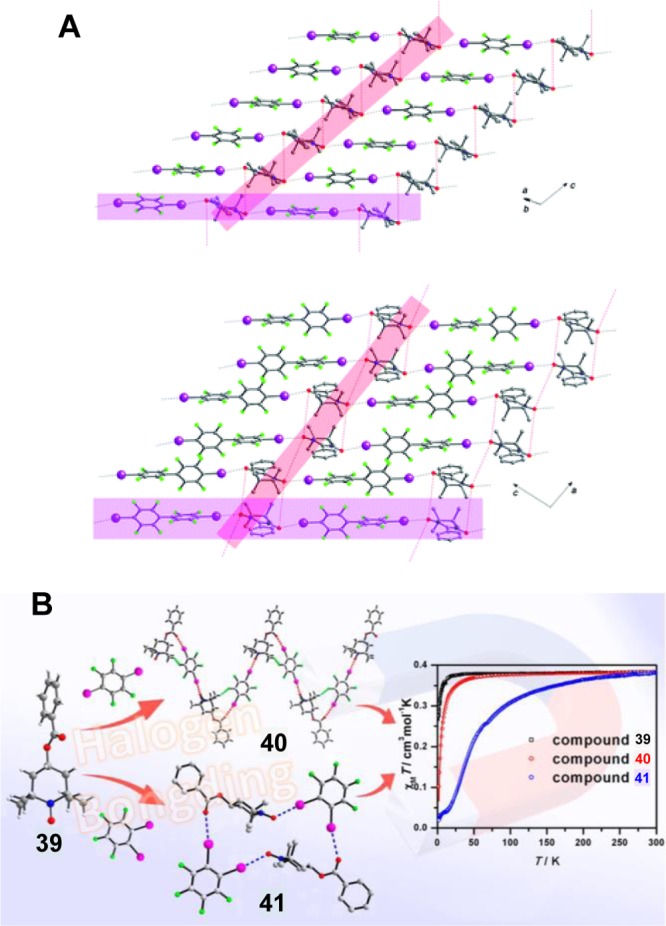
(A) One-dimensional halogen-bonded supramolecular chains in complexes
between (3-phenyl-2,2,5,5-tetramethylimidazolin-1-yl)oxy and 1,4-diiodotetrafluorobenzene
(top) and 4,4′-diiodooctafluorobiphenyl (bottom). In both cases
the radicals form magnetic chains isolated by the XB donors, and within
the chains, the radicals pack into dimeric units. Reprinted with permission
from ref (1086). Copyright
Royal Society of Chemistry 2012. (B) Halogen-bonded cocrystals 40 and 41 containing the BTEMPO radical 39 exhibit enhanced antiferromagnetic coupling as compared
to the pure single crystal of 39. Reprinted from ref (1087). Copyright 2013 American
Chemical Society.
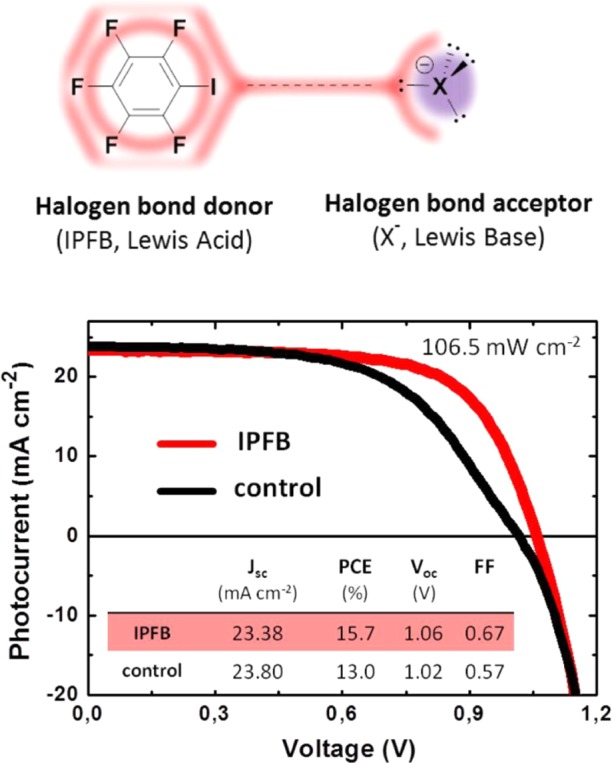
Top: schematic representation
of the XB between the passivating
iodopentafluorobenzene (IPFB) unit and a generic halide anion at the
perovskite surface. Bottom: performance of the perovskite solar cells
with (red) and without (black) surface passivation, using spiro-OMeTAD
as the hole transporter. Reprinted from ref (1094). Copyright 2014 American
Chemical Society.
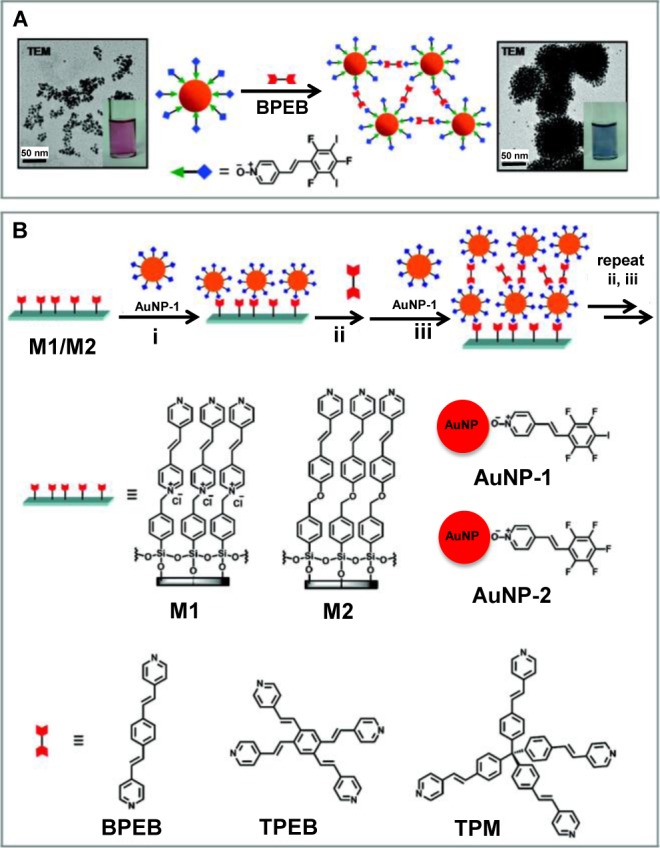
(A) Schematics of the formation of assemblies of functionalized
gold nanoparticles (AuNPs) in the presence of bipyridyl cross-linkers
(BPEB, TPEB, TPM) via XB. (B) Stepwise generation of assemblies consisting
of functionalized gold nanoparticles and different XB-accepting cross-linkers
on organic monolayers (M1 and M2). Reprinted from ref (1096). Copyright 2011 American
Chemical Society.
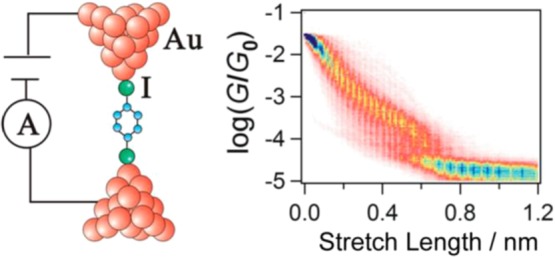
Left: schematics
of a diiodobenzene-bridged single-molecule junction.
Right: the authors used 2D conductance histograms to determine the
conductance of the molecular junction and to conclude that sufficiently
strong XB is required for the junction to form. Reprinted from ref (1098). Copyright 2013 American
Chemical Society.
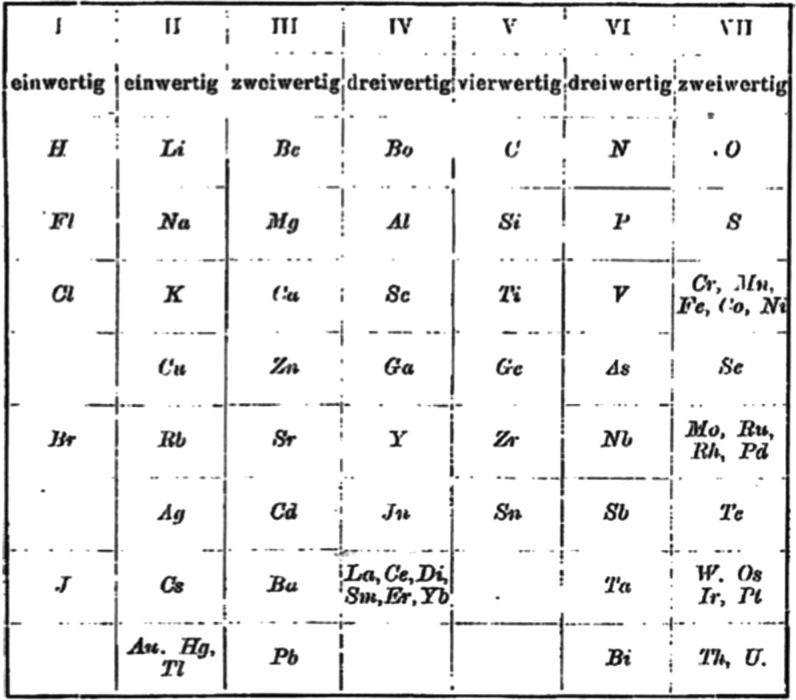
Periodic table published by J. W. Retgers in 1895 in his paper
in Z. Phys. Chem., a journal established in 1887 by W. Ostwald, J. H. van ’t
Hoff, and S. A. Arrhenius as the first journal tailored to scientific
papers on physical chemistry.
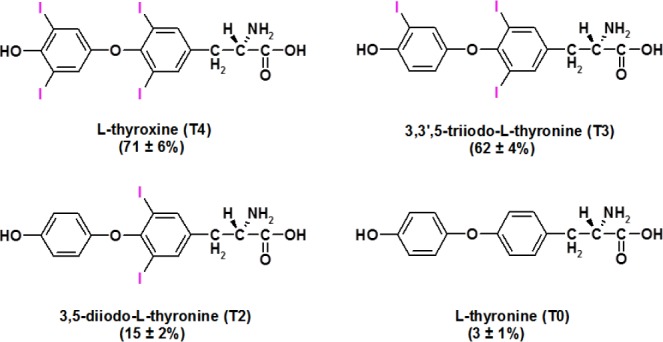
Molecular structures
of thyroid hormones and the binding activities
of the RNA aptamer complexes described in ref (1111).
References
-
- Hantzsch A. Die Chromoisomerie Der P-Dioxy-Terepthalsaure Derivate Als Phenol-Enol-Isomerie. Ber. Dtsch. Chem. Ges. 1915, 48, 797–816. 10.1002/cber.191504801104. - DOI
-
- Nakamoto K.; Margoshes M.; Rundle R. E. Stretching Frequencies as a Function of Distances in Hydrogen Bonds. J. Am. Chem. Soc. 1955, 77, 6480–6486. 10.1021/ja01629a013. - DOI
-
- Schleyer P. V. R.; West R. Comparison of Covalently Bonded Electronegative Atoms as Proton Acceptor Groups in Hydrogen Bonding. J. Am. Chem. Soc. 1959, 81, 3164–3165. 10.1021/ja01521a084. - DOI
-
- Halogen Bonding. Fundamentals and Applications; Metrangolo P., Resnati G., Eds.; Springer-Verlag: Berlin, Heidelberg, 2008.
Publication types
MeSH terms
Substances
Grants and funding
LinkOut - more resources
Full Text Sources
Other Literature Sources
Molecular Biology Databases
