. 2016 Jan 26;11(1):e0147319.
doi: 10.1371/journal.pone.0147319. eCollection 2016.

An Alzheimer's Disease-Derived Biomarker Signature Identifies Parkinson's Disease Patients with Dementia

Affiliations

An Alzheimer's Disease-Derived Biomarker Signature Identifies Parkinson's Disease Patients with Dementia

Yosef Berlyand et al. PLoS One. .

Abstract

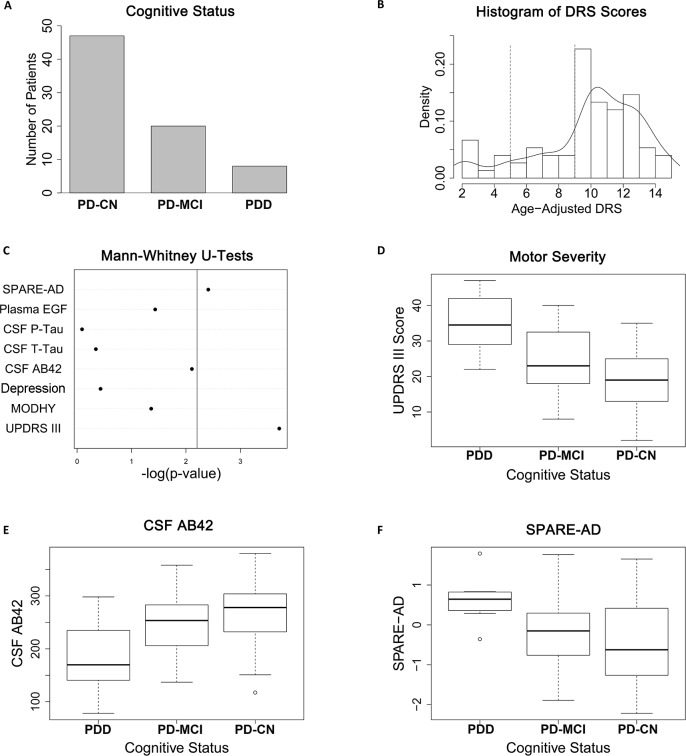
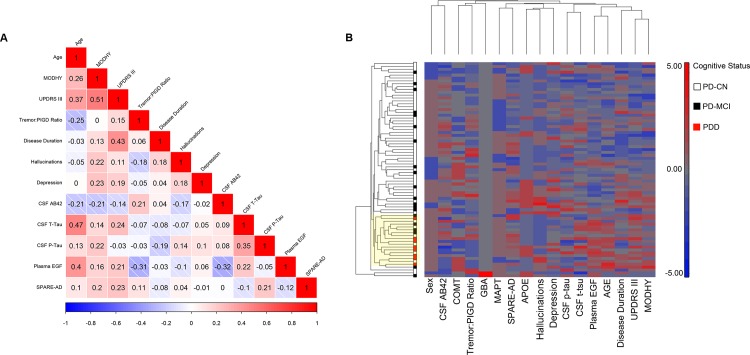
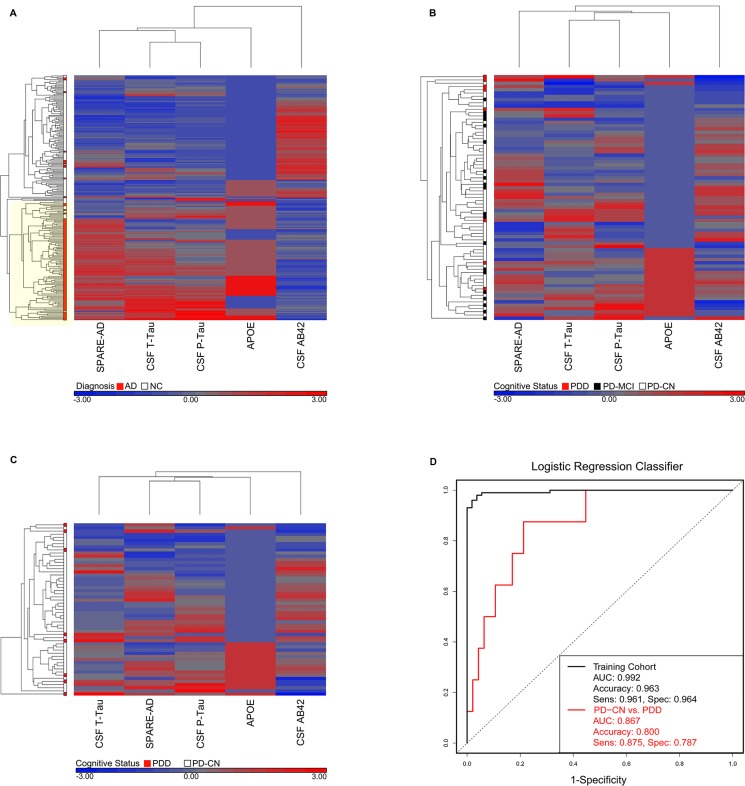
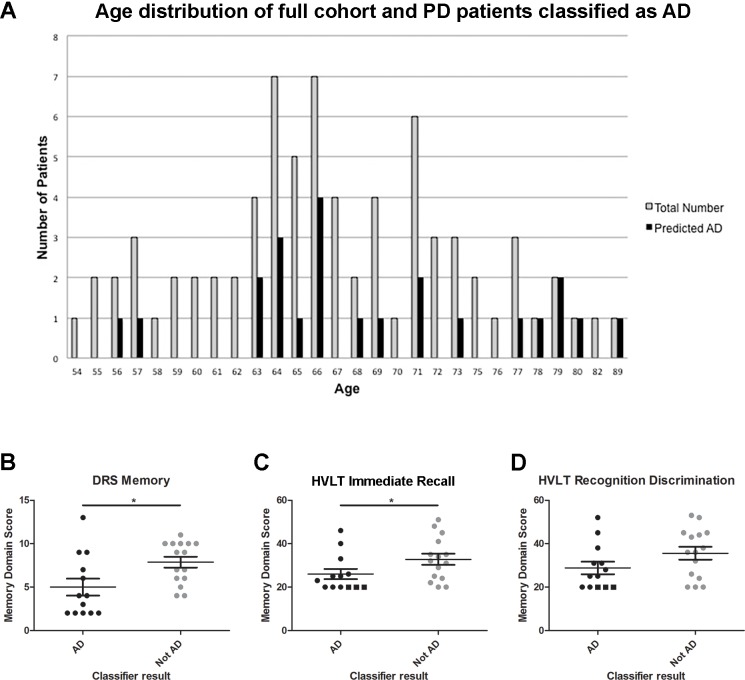
Biomarkers from multiple modalities have been shown to correlate with cognition in Parkinson's disease (PD) and in Alzheimer's disease (AD). However, the relationships of these markers with each other, and the use of multiple markers in concert to predict an outcome of interest, are areas that are much less explored. Our objectives in this study were (1) to evaluate relationships among 17 biomarkers previously reported to associate with cognition in PD or AD and (2) to test performance of a five-biomarker classifier trained to recognize AD in identifying PD with dementia (PDD). To do this, we evaluated a cross-sectional cohort of PD patients (n = 75) across a spectrum of cognitive abilities. All PD participants had 17 baseline biomarkers from clinical, genetic, biochemical, and imaging modalities measured, and correlations among biomarkers were assessed by Spearman's rho and by hierarchical clustering. We found that internal correlation among all 17 candidate biomarkers was modest, showing a maximum pairwise correlation coefficient of 0.51. However, a five-marker subset panel derived from AD (CSF total tau, CSF phosphorylated tau, CSF amyloid beta 42, APOE genotype, and SPARE-AD imaging score) discriminated cognitively normal PD patients vs. PDD patients with 80% accuracy, when employed in a classifier originally trained to recognize AD. Thus, an AD-derived biomarker signature may identify PDD patients with moderately high accuracy, suggesting mechanisms shared with AD in some PDD patients. Based on five measures readily obtained during life, this AD-derived signature may prove useful in identifying PDD patients most likely to respond to AD-based crossover therapies.


Conflict of interest statement

Competing Interests: Dr. Trojanowski may accrue revenue in the future on patents submitted by the University of Pennsylvania wherein he is co-Inventor and he received revenue from the sale of Avid to Eli Lilly as co-inventor on imaging related patents submitted by the University of Pennsylvania. He receives research support from the NIH, GSK, Janssen, Biogen and several non-profits. Dr. Chen-Plotkin is the inventor of a patent pending from the University of Pennsylvania on biomarkers for Parkinson’s disease diagnosis; the biomarkers covered by this patent do not concern cognition. Dr. Weintraub has received research funding or support from Michael J. Fox Foundation for Parkinson’s Research, NIH, Novartis Pharmaceuticals, Department of Veterans Affairs, and Avid Radiopharmaceuticals; honoraria from AbbVie, Biotie, Teva Pharmaceuticals, Otsuka, UCB, Clintrex LLC, and the CHDI Foundation; license fee payments from UPenn for the QUIP and QUIP-RS; royalties from Wolters Kluweland; and fees for legal consultation for lawsuit related to antipsychotic prescribing in a PD patient.

Figures

Fig 1
Fig 1. Cohort characteristics and bivariate cross-sectional analyses.
(A) By consensus clinical determination, 47/75 patients were classified as PD-CN, 20/75 PD-MCI, and 8/75 as PDD. (B) Histogram and kernel density plot of age-adjusted DRS scores for the study cohort. Dashed vertical lines represent separations between PDD vs. PD-MCI vs. PD-CN ranges for DRS performance. (C) A bivariate analysis of eight candidate markers previously reported to associate cross-sectionally with cognition confirms associations between PDD and two candidate markers in the present study: Unified Parkinson’s Disease Rating Scale Motor score (UPDRS III, corrected p = 0.002) and Spatial Pattern of Atrophy for Recognition of AD score (SPARE-AD, corrected p = 0.031). An additional marker–CSF measures of Aβ42 –trended towards association with PDD (corrected p = 0.062). Vertical line indicates corrected p<0.05. EGF = Epidermal Growth Factor. MODHY = Modified Hoehn and Yahr. The other nine candidate markers assessed in this study have previously been reported to associate with longitudinal decline in cognition. (D)–(F) Boxplots of the distribution of UPDRS-III score, CSF Aβ42 levels, and SPARE-AD score among the three cognitive classes. Median and interquartile range are shown.
Fig 2
Fig 2. Correlations among candidate biomarkers for cognition.
(A) Pairwise Spearman correlation coefficients were calculated for the candidate biomarkers for cognition in PD across the entire cohort. With a few exceptions (e.g. MODHY and UPDRS-III scores (ρ = 0.51), candidate biomarkers did not show high correlations. Shades of red indicate a positive correlation coefficient, white indicates a correlation coefficient of zero, and shades of blue indicate a negative correlation coefficient. The correlation coefficient for each pairwise comparison is reported in the corresponding box. Only 12 candidate biomarkers are shown because five markers are categorical variables with relatively few categories. (B) Hierarchical clustering of biomarker candidates does not suggest a high degree of internal correlation among the 17 markers assessed. Both patients and biomarkers were clustered by Euclidean distance using average linkage, with the patient dendrogram shown to the left of the heatmap and the biomarker dendrogram shown above the heatmap. Each column represents one of 17 biomarkers, and each row represents a patient, with PD-CN (white), PD-MCI (black), and PDD (red) individuals indicated by color. On the heatmap, darker red indicates higher marker levels, and darker blue indicates lower marker levels relative to the mean. A branch that captured all the PDD subjects is highlighted in yellow.
Fig 3
Fig 3. An Alzheimer’s Disease-derived classifier for PDD.
(A) Hierarchical clustering of five AD-derived biomarkers (CSF Aβ42, CSF t-tau, CSF p-tau, SPARE-AD score, and APOE genotype) using data from AD and normal controls (NC) in the ADNI cohort. In AD, these five markers are highly correlated with each other. Moreover, clustering of individuals using these five markers produces a branch highly enriched in AD (yellow highlight). (B) Hierarchical clustering of the same five biomarkers using data from the full UPenn Udall cohort (n = 75). In PD, these five markers demonstrate less internal correlation. (C) Hierarchical clustering of the five AD-derived biomarkers using data from only PD-CN and PDD patients (n = 55). Even when only the extreme ends of the PD cognitive spectrum are included, less internal correlation is seen among these five markers in PD than in AD. (D) A logistic regression classifier (black curve) using the five AD-derived biomarkers discriminates AD from NC in the ADNI cohort with high accuracy. Accuracy, area under the curve, sensitivity, and specificity were assessed by ten-fold cross-validation, using the training cohort of ADNI subjects. Applying the exact same AD-derived classifier to the UPenn Udall cohort discriminates PD-CN from PDD patients with 80% accuracy as well (red curve).
Fig 4
Fig 4. Age and memory impairment in PD patients classified as AD-like.
(A) Histogram depicting age frequencies for all 75 PD patients in the study (grey bars) vs. subset of PD patients classified as having an AD-like biomarker profile (black bars). AD-like individuals represent a range of ages. (B) DRS-memory domain scores for cognitively impaired (PDD and PD-MCI) PD patients classified as AD-like (black) vs. not AD-like (grey). Age-adjusted DRS memory domain scores are shown. *Two-tailed Mann-Whitney p <0.05. (C-D) Standardized scores (T-scores, where 50 is the mean and each 10-point change from 50 represents one standard deviation) for total immediate free recall (C) and recognition discrimination (D) from the Hopkins Verbal Learning Test-Revised (HVLT-R) for cognitively impaired (PDD and PD-MCI) PD patients classified as AD-like (black) vs. not AD-like (grey). Of note, 3/13 PD patients classified as AD-like were unable to complete testing due to severity of dementia; these individuals are denoted by a square symbol and assigned a T-score of 20. All PD patients classified as not AD-like were able to complete testing. *Two-tailed Mann-Whitney p <0.05.

References

    1. Tanzi RE, Bertram L. Twenty years of the Alzheimer’s disease amyloid hypothesis: a genetic perspective. Cell. 2005;120: 545–555. - PubMed
    1. Wright Willis A, Evanoff BA, Lian M, Criswell SR, Racette BA. Geographic and ethnic variation in Parkinson disease: a population-based study of US Medicare beneficiaries. Neuroepidemiology. 2010;34: 143–151. 10.1159/000275491 - DOI - PMC - PubMed
    1. Fearnley JM, Lees AJ. Ageing and Parkinson's disease: substantia nigra regional selectivity. Brain. 1991;114 (Pt 5): 2283–2301. - PubMed
    1. Williams-Gray CH, Foltynie T, Brayne CE, Robbins TW, Barker RA. Evolution of cognitive dysfunction in an incident Parkinson's disease cohort. Brain. 2007;130: 1787–1798. - PubMed
    1. Hely MA, Reid WG, Adena MA, Halliday GM, Morris JG. The Sydney multicenter study of Parkinson's disease: the inevitability of dementia at 20 years. 2008;23: 837–844. - PubMed

Publication types

MeSH terms