. 2016 Feb 5;81(3):878-89.
doi: 10.1021/acs.joc.5b02456. Epub 2016 Jan 26.

Toward Structural Correctness: Aquatolide and the Importance of 1D Proton NMR FID Archiving

Affiliations

Toward Structural Correctness: Aquatolide and the Importance of 1D Proton NMR FID Archiving

Guido F Pauli et al. J Org Chem. .

Abstract

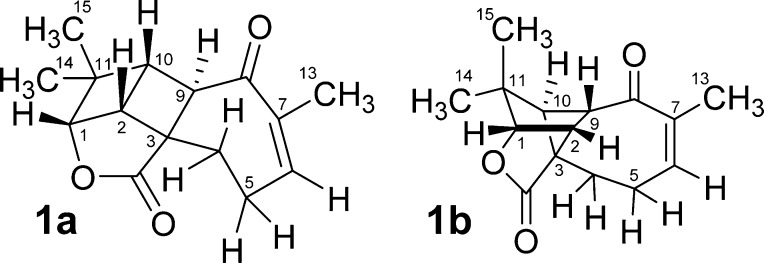
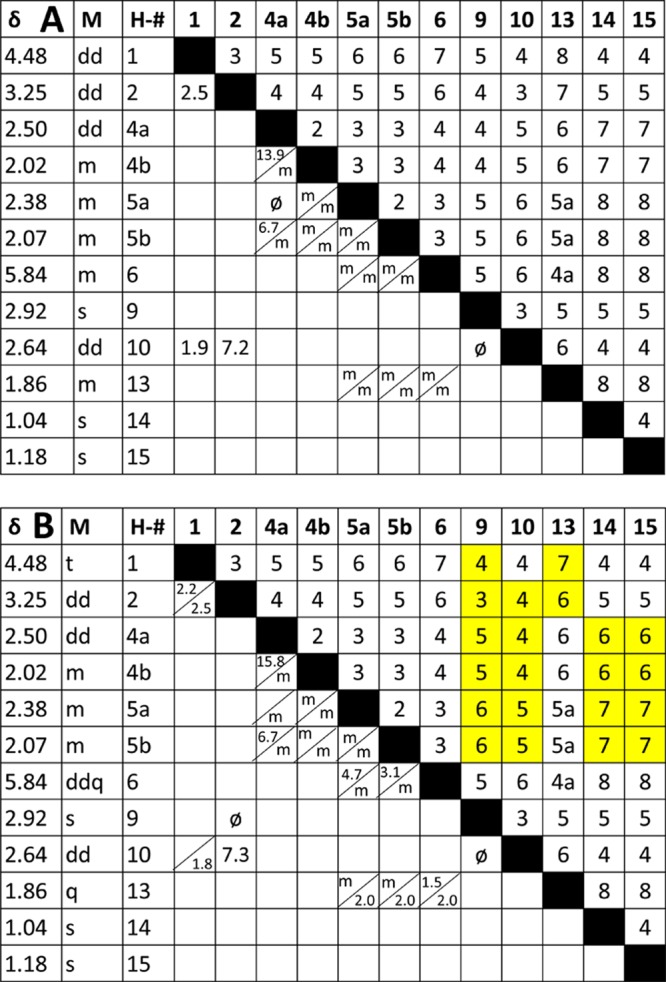
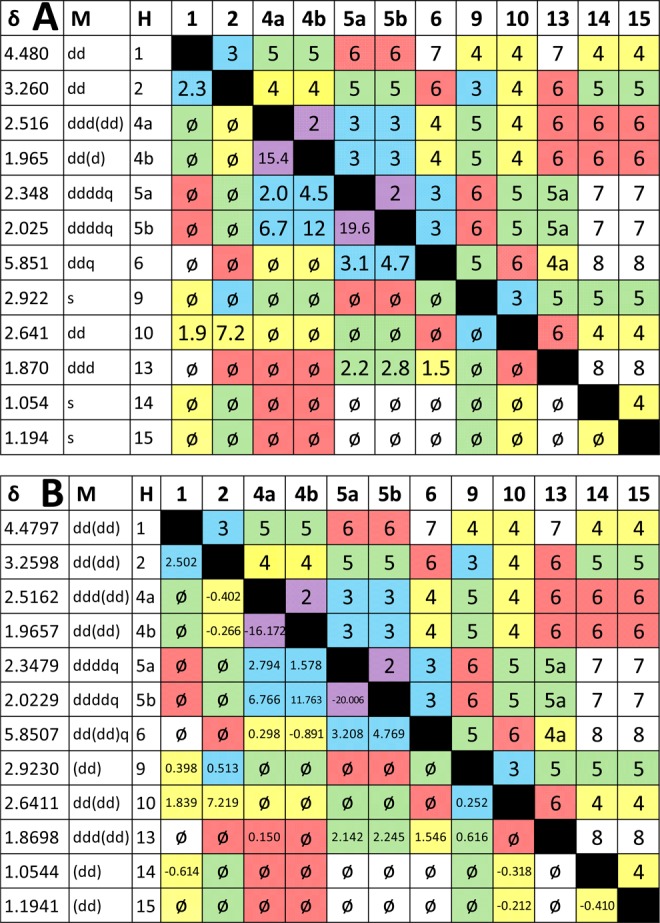
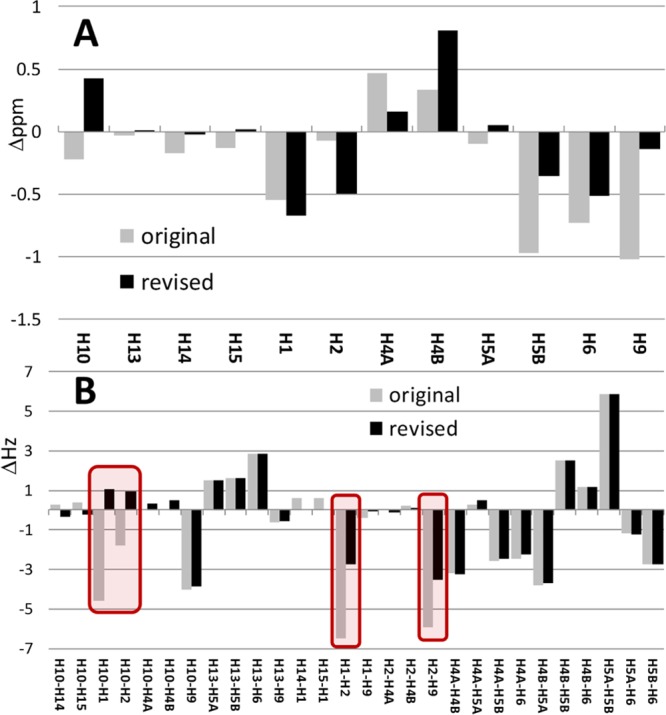
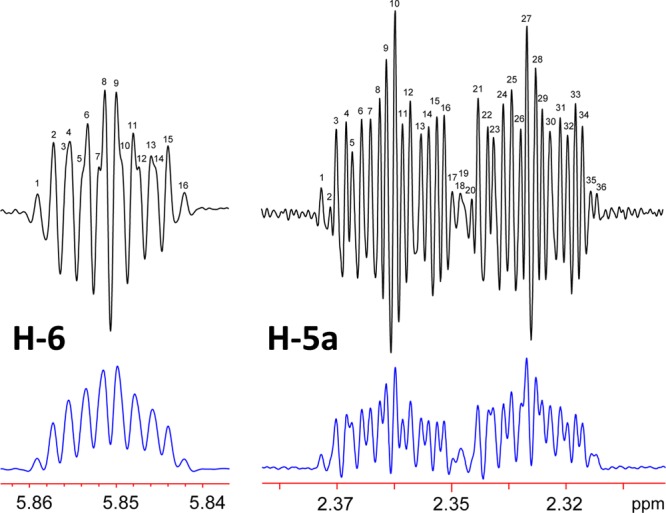
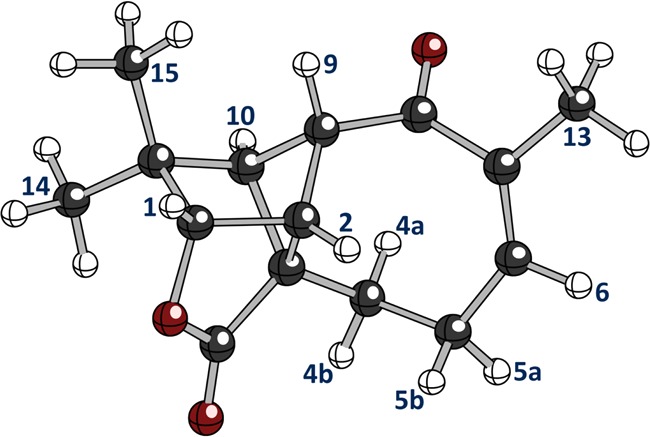
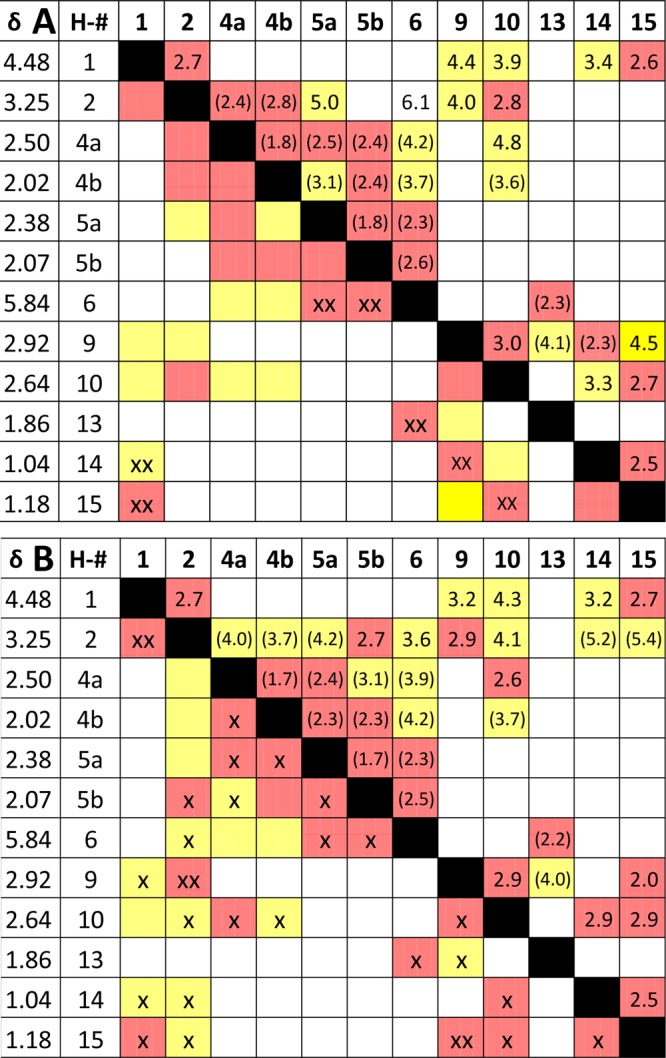
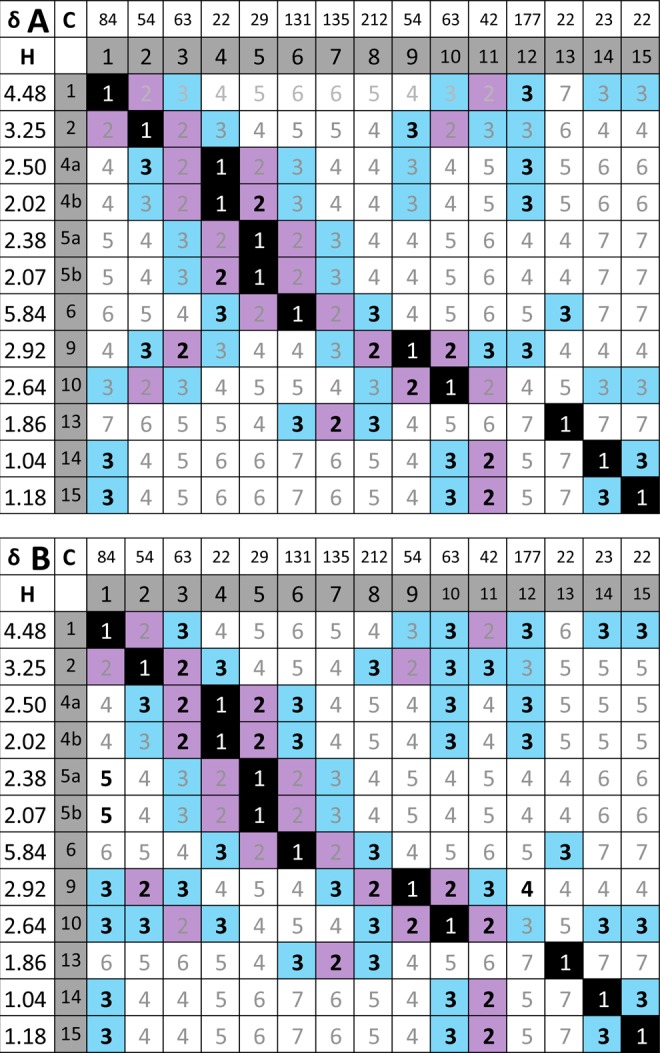
The revision of the structure of the sesquiterpene aquatolide from a bicyclo[2.2.0]hexane to a bicyclo[2.1.1]hexane structure using compelling NMR data, X-ray crystallography, and the recent confirmation via full synthesis exemplify that the achievement of "structural correctness" depends on the completeness of the experimental evidence. Archived FIDs and newly acquired aquatolide spectra demonstrate that archiving and rigorous interpretation of 1D (1)H NMR data may enhance the reproducibility of (bio)chemical research and curb the growing trend of structural misassignments. Despite being the most accessible NMR experiment, 1D (1)H spectra encode a wealth of information about bonds and molecular geometry that may be fully mined by (1)H iterative full spin analysis (HiFSA). Fully characterized 1D (1)H spectra are unideterminant for a given structure. The corresponding FIDs may be readily submitted with publications and collected in databases. Proton NMR spectra are indispensable for structural characterization even in conjunction with 2D data. Quantum interaction and linkage tables (QuILTs) are introduced for a more intuitive visualization of 1D J-coupling relationships, NOESY correlations, and heteronuclear experiments. Overall, this study represents a significant contribution to best practices in NMR-based structural analysis and dereplication.


Conflict of interest statement

M.N. is founder of Perch Solutions Limited. The other authors declare no competing financial interest.

Figures

Figure 1
Figure 1
Originally proposed (1a) and revised structure (1b) of aquatolide.
Figure 2
Figure 2
J-correlation map of the homonuclear proton NMR assignments reported for the original (erroneous) A and revised B structures of aquatolide (δ in ppm, M = reported multiplicity). Cells in the upper right are the number of bonds separating the two hydrogens. In the lower left are the observed coupling constants in Hz. Unresolved multiplets were designated by “m.” ø are 3J coupling constants that are less than 1.0 Hz due to ∼90 deg dihedral relationships. The addition of “a” in the bond numbers 4a and 5a indicate (homo)allylic coupling relationships. Split cells in the lower left represent coupling constants that are unequally reported for the two nuclei, likely referring to observed line distances rather than coupling constants. Yellow boxes in B indicate changes in bond number compared with the original structure.
Figure 3
Figure 3
(A) Results of reprocessing the FID from the 800 MHz 1D 1H NMR spectrum of aquatolide displayed on a J correlation map. The number of bonds separating two coupled nuclei are color-coded: violet = 2J, blue = 3J, yellow = 4J, green = 5J, and pink = 6J. The gaps in the colored fields of the lower left indicate the limitation of achievable coverage with manual spin analysis. Whereas all couplings of ∼1 Hz or more could be readily extracted, determination of the long-range J-couplings typically requires a computational approach. (B) Final J-correlation map, termed quantum interaction and linkage table (QuILT; see main text), achieved by HiFSA fitting of the archived 800 MHz 1D 1H NMR data of aquatolide. Multiplicities in parentheses are less than ∼1 Hz. Couplings less than absolute value of 0.10 Hz are given as “⌀” rather than being reported as blank cells, which would indicate them being unknown or undetermined.
Figure 4
Figure 4
Difference of chemical shifts (in ppm, A) and coupling constants (in Hz, B) between the HiFSA fitted structure and the original vs revised structures.
Figure 5
Figure 5
Optimizing processing parameters reveal coupling constants and line counts present in the signals for H-5a and H-6 of 1b. Double zero filling was applied to both. The bottom (blue) signals were obtained using a Lorentzian–Gaussian apodization function of LB = −1.4 Hz and GF = 0.17 (17% AQ). The top (black) signals resulted from a Lorentzian–Gaussian apodization function of LB = −2.5 Hz and GF = 0.25 (25% AQ) and demonstrate that all theoretical lines of these complex “multiplets” can indeed be deciphered by manual analysis facilitated by tools such as jVisualizer (http://jvisualizer.sourceforge.net/). Actually, proton H-5a resonates as a ddddq, and H-6 gives rise to a ddq signal.
Figure 6
Figure 6
Three-dimensional representation of 1b showing the spatial relationships in the 8-membered ring computed with density functional theory.
Figure 7
Figure 7
NOESY correlation maps (NOESY QuILTs) of the original (A) and the revised (B) structures (δ precision as reported). The upper right halves contain the distances between nuclei taken from the revision article and a 3D model (in parentheses). Red color indicates distances <3.0 Å. Yellow boxes are distances between 3.0 and 5.0 Å. Boxes without color represent distances >5.0 Å. The bottom left halves are actual NOESY cross peaks observed as either strong (xx) or weak (x) correlations. Distances without parentheses were taken from the revision article, and those in parentheses were determined with Avogadro molecule editor and visualizer.
Figure 8
Figure 8
Long-range heteronuclear QuILTs summarize both the observed direct (1JC,H) and ≥2JC,H correlations in the original (A; HETCOR and long-range HETCOR, respectively) vs revised (B; HSQC and HMBC, respectively) aquatolide structures. The numbers inside the δ and atom number grid reflect the number, n, of connecting bonds (nJ). Bolded numbers represent observed correlations. Color coding of boxes: black = one bond, violet = two bonds, blue = three bonds; white = four and more bonds. Color coding of numbers: black and white = 1JC,H correlation; gray ≥2JC,H correlations.

References

    1. San Feliciano A.; Medarde M.; Miguel del Corral J. M.; Aramburu A.; Gordaliza M.; Barrero A. F. Tetrahedron Lett. 1989, 30, 2851–2854. 10.1016/S0040-4039(00)99142-1. - DOI
    1. Lodewyk M. W.; Soldi C.; Jones P. B.; Olmstead M. M.; Rita J.; Shaw J. T.; Tantillo D. J. J. Am. Chem. Soc. 2012, 134, 18550–18553. 10.1021/ja3089394. - DOI - PubMed
    1. Seetharamsingh B.; Rajamohanan P. R.; Reddy D. S. Org. Lett. 2015, 17, 1652–1655. 10.1021/acs.orglett.5b00345. - DOI - PubMed
    1. Terayama N.; Yasui E.; Mizukami M.; Miyashita M.; Nagumo S. Org. Lett. 2014, 16, 2794–2797. 10.1021/ol5006856. - DOI - PubMed
    1. Xiao Q.; Young K.; Zakarian A. J. Am. Chem. Soc. 2015, 137, 5907–5910. 10.1021/jacs.5b03531. - DOI - PubMed

Publication types