

Reproducibility of Brain Morphometry from Short-Term Repeat Clinical MRI Examinations: A Retrospective Study
- PMID: 26812647
- PMCID: PMC4727912
- DOI: 10.1371/journal.pone.0146913
Reproducibility of Brain Morphometry from Short-Term Repeat Clinical MRI Examinations: A Retrospective Study
Abstract
Purpose: To assess the inter session reproducibility of automatic segmented MRI-derived measures by FreeSurfer in a group of subjects with normal-appearing MR images.
Materials and methods: After retrospectively reviewing a brain MRI database from our institute consisting of 14,758 adults, those subjects who had repeat scans and had no history of neurodegenerative disorders were selected for morphometry analysis using FreeSurfer. A total of 34 subjects were grouped by MRI scanner model. After automatic segmentation using FreeSurfer, label-wise comparison (involving area, thickness, and volume) was performed on all segmented results. An intraclass correlation coefficient was used to estimate the agreement between sessions. Wilcoxon signed rank test was used to assess the population mean rank differences across sessions. Mean-difference analysis was used to evaluate the difference intervals across scanners. Absolute percent difference was used to estimate the reproducibility errors across the MRI models. Kruskal-Wallis test was used to determine the across-scanner effect.
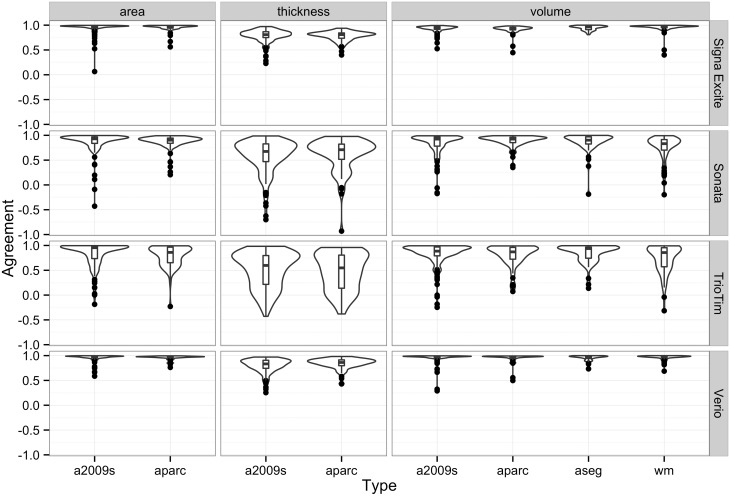
Results: The agreement in segmentation results for area, volume, and thickness measurements of all segmented anatomical labels was generally higher in Signa Excite and Verio models when compared with Sonata and TrioTim models. There were significant rank differences found across sessions in some labels of different measures. Smaller difference intervals in global volume measurements were noted on images acquired by Signa Excite and Verio models. For some brain regions, significant MRI model effects were observed on certain segmentation results.
Conclusions: Short-term scan-rescan reliability of automatic brain MRI morphometry is feasible in the clinical setting. However, since repeatability of software performance is contingent on the reproducibility of the scanner performance, the scanner performance must be calibrated before conducting such studies or before using such software for retrospective reviewing.
Conflict of interest statement
Figures


References
-
- Fotenos AF, Snyder AZ, Girton LE, Morris JC, Buckner RL. Normative estimates of cross-sectional and longitudinal brain volume decline in aging and AD. Neurology. 2005;64(6):1032–9. - PubMed
-
- Castellanos FX, Lee PP, Sharp W, Jeffries NO, Greenstein DK, Clasen LS, et al. Developmental trajectories of brain volume abnormalities in children and adolescents with attention-deficit/hyperactivity disorder. JAMA. 2002;288(14):1740–8. . - PubMed
-
- Mathalon DH, Sullivan EV, Lim KO, Pfefferbaum A. Progressive brain volume changes and the clinical course of schizophrenia in men: A longitudinal magnetic resonance imaging study. Archives of General Psychiatry. 2001;58(2):148–57. - PubMed
-
- Fox NC, Cousens S, Scahill R, Harvey RJ, Rossor MN. Using serial registered brain magnetic resonance imaging to measure disease progression in alzheimer disease: Power calculations and estimates of sample size to detect treatment effects. Archives of Neurology. 2000;57(3):339–44. - PubMed
-
- Rovaris M, Comi G, Rocca MA, Wolinsky JS, Filippi M. Short-term brain volume change in relapsing—remitting multiple sclerosis. Brain. 2001;124(9):1803–12. - PubMed
Publication types
MeSH terms
LinkOut - more resources
Full Text Sources
Other Literature Sources
Medical
