. 2016 Jan 26:17:11.
doi: 10.1186/s13059-016-0879-2.

Epigenomic analysis detects aberrant super-enhancer DNA methylation in human cancer

Affiliations

Epigenomic analysis detects aberrant super-enhancer DNA methylation in human cancer

Holger Heyn et al. Genome Biol. .

Abstract

Background: One of the hallmarks of cancer is the disruption of gene expression patterns. Many molecular lesions contribute to this phenotype, and the importance of aberrant DNA methylation profiles is increasingly recognized. Much of the research effort in this area has examined proximal promoter regions and epigenetic alterations at other loci are not well characterized.

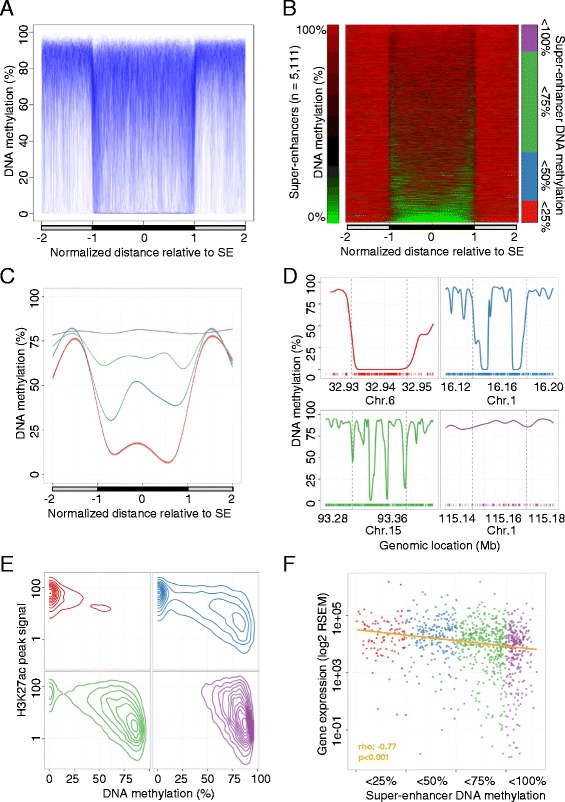
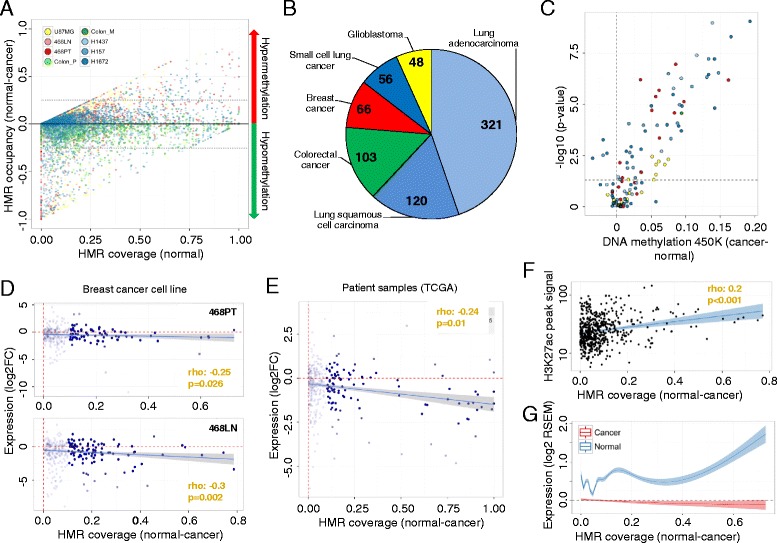
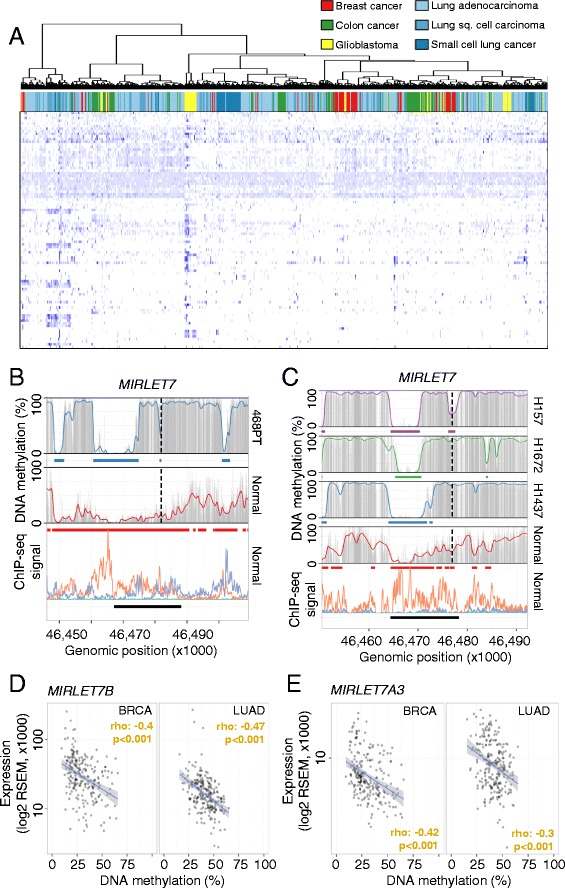
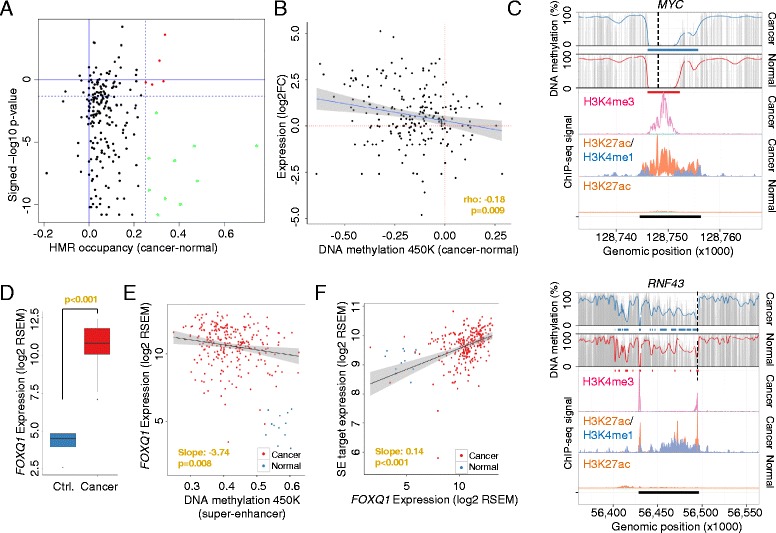
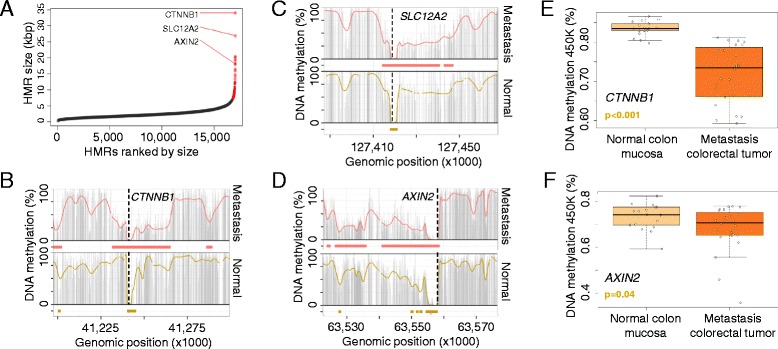
Results: Using whole genome bisulfite sequencing to examine uncharted regions of the epigenome, we identify a type of far-reaching DNA methylation alteration in cancer cells of the distal regulatory sequences described as super-enhancers. Human tumors undergo a shift in super-enhancer DNA methylation profiles that is associated with the transcriptional silencing or the overactivation of the corresponding target genes. Intriguingly, we observe locally active fractions of super-enhancers detectable through hypomethylated regions that suggest spatial variability within the large enhancer clusters. Functionally, the DNA methylomes obtained suggest that transcription factors contribute to this local activity of super-enhancers and that trans-acting factors modulate DNA methylation profiles with impact on transforming processes during carcinogenesis.

Conclusions: We develop an extensive catalogue of human DNA methylomes at base resolution to better understand the regulatory functions of DNA methylation beyond those of proximal promoter gene regions. CpG methylation status in normal cells points to locally active regulatory sites at super-enhancers, which are targeted by specific aberrant DNA methylation events in cancer, with putative effects on the expression of downstream genes.


Figures

Fig. 1
Fig. 1
DNA methylation profile of super-enhancer regions derived from normal tissues determined by whole genome bisulfite sequencing (WGBS). a Scaled DNA methylation profile of 5111 super-enhancers (SE) in their respective normal tissues (n = 5). Each super-enhancer is represented by a single line (blue) and smoothed DNA methylation levels inside the super-enhancer (black bar) and equally sized flanking sequences (gray bar) are displayed. b DNA methylation levels of super-enhancers in their respective normal tissues (n = 5) in equally sized windows (green, 0 %; red, 100 %). Each horizontal line represents a single super-enhancer, ordered by average DNA methylation levels. Super-enhancers are grouped according to their average DNA methylation levels (red, <25 %; blue, <50 %; green, <75 %; purple, <100 %). c Smoothed average DNA methylation profile of all super-enhancers categorized into four groups on the basis of DNA methylation levels. d Examples of the DNA methylation profiles of breast super-enhancers representing the defined subgroups. Genomic locations of the super-enhancers (dashed vertical lines) and equally sized flanking regions are displayed and CpG dinucleotides locations are indicated (bottom, colored bars). e Association between DNA methylation levels and H3K27ac peak signals [11] in normal breast tissues and breast super-enhancers (n = 1091) displayed as averaged values (50-bp windows). Super-enhancers were classified into previously defined subgroups. f Gene expression levels of target transcripts in normal breast tissues. Scaled averaged expression levels of genes associated with breast super-enhancers (n = 1091) in normal breast tissue samples (n = 110; TCGA [16]). Super-enhancers were grouped according to their average DNA methylation levels. Significance of a Spearman’s correlation test is indicated. RSEM RNA-Sequencing by Expectation Maximization
Fig. 2
Fig. 2
Cancer-specific alterations in DNA methylation within super-enhancer regions determined using WGBS. a Difference in DNA methylation levels (occupancy of hypomethylated regions (HMRs)) between cancer (n = 8) and normal (n = 5) samples paired within their respective tissue contexts (y-axis). HMR occupancy of normal tissues is indicated (x-axis) and cancer sample types are color-coded and the threshold indicated (dotted line; δ HMR occupancy 25 %). b Sample distribution of 714 cancer samples analyzed on the HumanMethylation450 BeadChip. c Validation of DNA hypermethylation at super-enhancers in 714 cancer samples using the HumanMethylation450 BeadChip (450 K). Significance was assessed by differential DNA methylation levels and the Student’s t-test (p value), comparing normal and cancer samples and averaging over the analyzed CpG (≥3) within a super-enhancer region (FDR < 0.05). The cancer samples are color-coded as defined in (b). d The association between HMR occupancy (WGBS) and target gene expression (RNA-seq) is assessed comparing normal breast (MCF10A) and the primary (468PT, upper panel) and metastatic (468LN, lower panel) breast cancer cell lines. Expression data are displayed as log transformed fold-change (log2FC) and significances of a Spearman’s correlation test are indicated. e Differences in HMR occupancy (WGBS) and target gene expression (RNA-seq, scaled log expression) are displayed comparing matched normal breast and primary carcinoma samples (TCGA [16], n = 25). f Association of H3K27ac signal (ChIP-seq) and differential HMR occupancy (WGBS) at hypermethylated super-enhancers. H3K27ac signals were retrieved from normal breast tissue [11]. g Smoothed (GAM) scaled log expression values of super-enhancer-related genes in matched normal and cancer samples (TCGA [16], n = 25) plotted against the difference in HMR occupancy (WGBS) for all super-enhancers gaining methylation in cancer. GAM Generalized Additive Model, RSEM RNA-Sequencing by Expectation Maximization
Fig. 3
Fig. 3
Cancer type-specific alterations of DNA methylation signatures at super-enhancer loci. a Hierarchical clustering of common hypomethylated super-enhancer regions in normal tissues (rows, <25 % average DNA methylation) in 714 cancer samples (columns). Average CpG methylation levels in common regions were clustered using Canberra distances and the Ward cluster method. DNA methylation levels are color-coded from 0 % (light blue) to 100 % (dark blue) and the different cancer types are color-coded. b, c DNA methylation profiles of the super-enhancer regions associated with MIRLET7 in normal tissues and cell lines derived from breast (b) and lung cancer (c). Smoothed (colored line), raw (gray bars) CpG methylation levels, hypomethylated regions (colored bars) and super-enhancers (black bars) are indicated. The enhancer-related histone marks (bottom panel) H3K27ac (orange) and H3K4me1 (purple) are displayed as ChIP-seq signal intensities [11]. Transcription start sites are indicated (broken line). d, e Association of DNA methylation levels (TCGA, HumanMethylation450 BeadChip, averaged probe levels within the super-enhancer) and gene expression (TCGA, RNA-seq, absolute expression values) related to the MIRLET7 super-enhancer and targeted microRNAs MIRLET7B (d) and MIRLET7A3 (e) in breast (n = 201) and lung (n = 216) cancer samples. Significances of a Spearman’s correlation test are indicated. RSEM RNA-Sequencing by Expectation Maximization
Fig. 4
Fig. 4
Hypomethylation at cancer-related super-enhancers in colorectal tumors. a Differential DNA methylation (occupancy of hypomethylated regions (HMRs)) at colorectal cancer-related super-enhancers between normal mucosa and primary colorectal cancer samples (WGBS, x-axis). Differentially methylated super-enhancers are indicated (colored dots, δ HMR occupancy >25 %). Results were validated in a cohort of matched normal and primary colorectal tumor samples (TCGA, n = 41, HumanMethylation450 BeadChip) and significant differences assessed by the Wilcoxon test (green dots, p < 0.05, y-axis). b Hypomethylation at super-enhancers was associated with increased target gene expression analyzed by HumanMethylation450 BeadChip (450 K, x-axis) and RNA-seq (y-axis) in matched primary colorectal cancer samples (n = 12, TCGA). Expression data are displayed as log transformed fold-change (log2FC). c DNA methylation profiles of the super-enhancer regions associated with MYC and RNF43 in normal and colorectal cancer samples (WGBS). Smoothed (colored line), raw (gray bars) CpG methylation levels, hypomethylated regions (colored bars) and super-enhancers (black bars) are indicated. The enhancer-related histone marks H3K27ac (orange) and H3K4me1 (blue) and the promoter-related mark H3K4me3 (pink) are displayed as ChIP-seq signal intensities (bottom panels) [11]. The transcription start sites are indicated (broken line). d Gene expression levels of the transcription factor FOXQ1 in normal (blue) and colorectal cancer (red) samples (TCGA). e, f Association of FOXQ1 expression and DNA methylation levels (HumanMethylation450 BeadChip, 450 K) at hypomethylated super-enhancer regions (e) or expression levels of associated target genes (f) in colorectal cancer in normal (blue) and colorectal cancer (red) samples (TCGA). Significance was assessed from a linear regression model applied solely to the cancer samples. RSEM RNA-Sequencing by Expectation Maximization
Fig. 5
Fig. 5
Large hypomethylated regions in colorectal metastasis. a HMRs derived from the metastatic colorectal cancer sample ranked by genomic size. Large HMRs are indicated (red dots). b–d DNA methylation profile of the HMRs spanning CTNNB1 (b), SLC12A2 (c) and AXIN2 (d) in the normal (yellow) and metastatic (red) samples. Smoothed (colored line), raw (gray bars) CpG methylation levels and hypomethylated regions (colored bars) are indicated. e, f Validation of the large HMRs associated with CTNNB1 (e) and AXIN2 (f) using the HumanMethylation450 BeadChip. Displayed are average CpG methylation levels of CTNNB1 and AXIN2 for 18 normal colon mucosa and 24 colorectal metastasis samples. Significant differences were assessed using Student’s t-test

References

    1. Hon GC, Rajagopal N, Shen Y, McCleary DF, Yue F, Dang MD, et al. Epigenetic memory at embryonic enhancers identified in DNA methylation maps from adult mouse tissues. Nat Genet. 2013;45:1198–206. doi: 10.1038/ng.2746. - DOI - PMC - PubMed
    1. Fraga MF, Ballestar E, Paz MF, Ropero S, Setien F, Ballestar ML, et al. Epigenetic differences arise during the lifetime of monozygotic twins. Proc Natl Acad Sci U S A. 2005;102:10604–9. doi: 10.1073/pnas.0500398102. - DOI - PMC - PubMed
    1. Rideout WM, 3rd, Eggan K, Jaenisch R. Nuclear cloning and epigenetic reprogramming of the genome. Science. 2001;293:1093–8. doi: 10.1126/science.1063206. - DOI - PubMed
    1. Baylin SB, Jones PA. A decade of exploring the cancer epigenome - biological and translational implications. Nat Rev Cancer. 2011;11:726–34. doi: 10.1038/nrc3130. - DOI - PMC - PubMed
    1. Berman BP, Weisenberger DJ, Aman JF, Hinoue T, Ramjan Z, Liu Y, et al. Regions of focal DNA hypermethylation and long-range hypomethylation in colorectal cancer coincide with nuclear lamina-associated domains. Nat Genet. 2011;44:40–6. doi: 10.1038/ng.969. - DOI - PMC - PubMed

Publication types