. 2016 Jan 27:7:10523.
doi: 10.1038/ncomms10523.

Rapid endothelial cytoskeletal reorganization enables early blood-brain barrier disruption and long-term ischaemic reperfusion brain injury

Affiliations

Rapid endothelial cytoskeletal reorganization enables early blood-brain barrier disruption and long-term ischaemic reperfusion brain injury

Yejie Shi et al. Nat Commun. .

Erratum in

Abstract

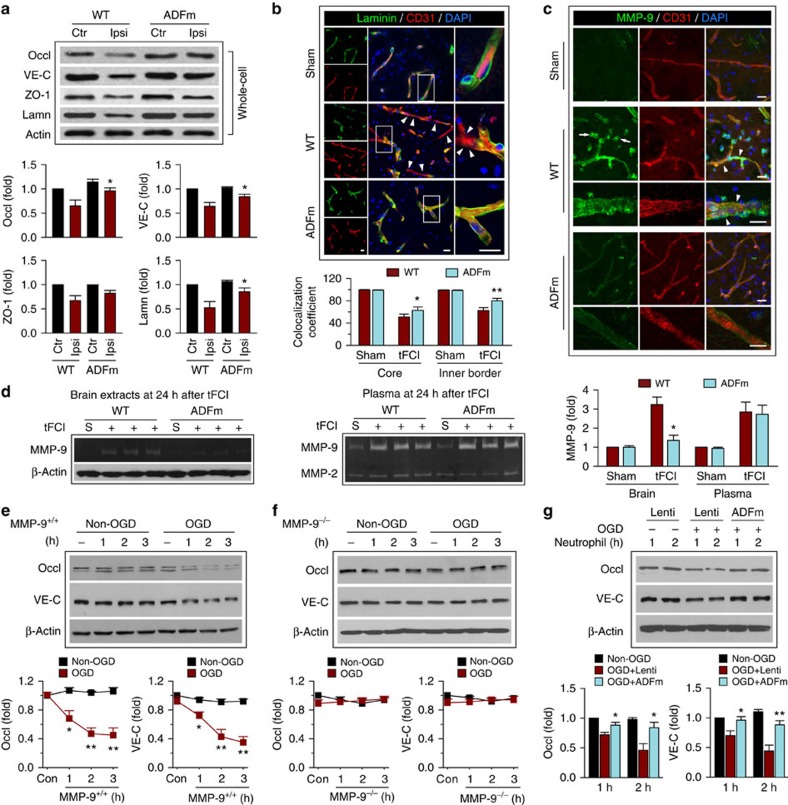
The mechanism and long-term consequences of early blood-brain barrier (BBB) disruption after cerebral ischaemic/reperfusion (I/R) injury are poorly understood. Here we discover that I/R induces subtle BBB leakage within 30-60 min, likely independent of gelatinase B/MMP-9 activities. The early BBB disruption is caused by the activation of ROCK/MLC signalling, persistent actin polymerization and the disassembly of junctional proteins within microvascular endothelial cells (ECs). Furthermore, the EC alterations facilitate subsequent infiltration of peripheral immune cells, including MMP-9-producing neutrophils/macrophages, resulting in late-onset, irreversible BBB damage. Inactivation of actin depolymerizing factor (ADF) causes sustained actin polymerization in ECs, whereas EC-targeted overexpression of constitutively active mutant ADF reduces actin polymerization and junctional protein disassembly, attenuates both early- and late-onset BBB impairment, and improves long-term histological and neurological outcomes. Thus, we identify a previously unexplored role for early BBB disruption in stroke outcomes, whereby BBB rupture may be a cause rather than a consequence of parenchymal cell injury.


Figures

Figure 1
Figure 1. Early-onset and progressive BBB disruption through both MMP-independent and -dependent mechanisms in an in vivo stroke model.
(a) Representative images of coronal brain sections showing the leakage of two fluorescent tracers Alexa555-dextran (3 kDa, red) and FITC-dextran (2,000 kDa, green) into brain parenchyma at indicated reperfusion (R) time points after 1 h of tFCI. Extravasation of endogenous plasma IgG into the central nervous system was visualized on adjacent sections from the same brains by applying fluorescent secondary antibodies against endogenous mouse IgG molecules (green). MAP2 immunostaining was used to illustrate infarcts in the same brains, as observed in the striatum at 6 h and in the entire MCA territory at 24 h. Scale bar, 1 mm. (b) Volume of leakage of Alexa555-dextran, endogenous IgG and FITC-dextran in sham-operated brains (S) and at 0.5–24 h of reperfusion after tFCI. n=4–5 mice per group. (c) In a separate cohort of mice, extravasation of Alexa555-dextran (3 kDa) and Alexa488-BSA (60–70 kDa) into striatal and cortical parenchyma at 0.5–72 h of reperfusion was quantified by calculating their blood–brain transfer coefficient Ki. n=5–6 mice per group. *P≤0.05, **P≤0.01, ***P≤0.001 versus sham. (dg) tFCI was induced for 1 h in WT or MMP-9−/− mice followed by reperfusion. In separate groups of WT mice, vehicle or the broad-spectrum MMP inhibitor GM6001 was administered as described in Methods. (d) Representative images showing the leakage of Alexa555-dextran (3 kDa, red) and plasma IgG (green) into brain parenchyma at 0.5, 3 and 24 h of reperfusion. MAP2 immunostaining illustrates infarction in the same brains. Scale bar, 1 mm. (e) Volume of leakage of Alexa555-dextran and endogenous IgGs in the same groups. (f) Sensorimotor dysfunction was assessed by the corner test up to 14 d after tFCI and expressed as the number of left body turns made over the course of 10 trials. (g) Brain infarct volumes were calculated on MAP2-stained sections at 1 and 14 d after tFCI. n=6 mice per group. *P≤0.05, **P≤0.01 versus WT. d, days.
Figure 2
Figure 2. Progressive barrier leakage and delayed degradation of endothelial JPs after an ischaemia-like insult in an in vitro BBB model.
(a) Illustration of the in vitro BBB model. An HBMEC monolayer seeded on top of a membrane in the cell culture insert was subjected to 1 h of OGD. Paracellular permeability was determined by measuring the luminal to abluminal diffusion coefficient of a 4.4 kDa TRITC-dextran or a 70 kDa FITC-dextran. (b) The diffusion coefficient of the two fluorescent tracers at 0–6 h after OGD or control non-OGD conditions. Data represent four independent experiments. *P≤0.05, **P≤0.01 versus non-OGD. (c) The MMP inhibitor GM6001 (1 or 3 μM) or vehicle was applied 30 min before, during and after OGD. The diffusion coefficient of the two tracers was measured 0–6 h after OGD. Data represent four independent experiments. *P≤0.05, **P≤0.01 versus vehicle control. (dg) Cultured HBMECs were subjected to 1-h OGD. (d,e) Expression of TJ proteins occludin, claudin-5 and ZO-1, as well as the AJ protein VE-cadherin was evaluated in HBMECs by western blotting 1–6 h after OGD. β-Actin was used as an internal loading control. Blots were quantified and expressed relative to non-OGD controls (Con). Data represent four independent experiments. *P≤0.05, **P≤0.01 versus Con. (f,g) Western blots showing that the delayed degradation of occludin and VE-cadherin at 4 and 6 h after OGD was prevented by MMP inhibition with GM6001 (3 μM). Data represent four independent experiments. *P≤0.05 versus vehicle.
Figure 3
Figure 3. Oxygen–glucose deprivation in vitro induces rapid and robust formation of actin stress fibres in endothelial cells.
(a) HBMECs were exposed to 1-h OGD and the expression of total β-actin, polymerized F-actin and soluble G-actin was examined by western blotting at 1–6 h after OGD. The ratio of F-actin to G-actin in HBMECs was quantified as a measure of stress fibre formation. Data represent four independent experiments. F-actin expression was elevated after OGD, whereas G-actin was downregulated, resulting in an increased F/G-actin ratio. (b) Phosphorylation of ADF/cofilin (pADF/cofilin) and expression of total ADF/cofilin (tADF/cofilin) in HBMECs were assessed at 1–6 h after OGD. β-Actin was used as an internal loading control. pADF/cofilin was quantified and expressed relative to non-OGD controls (Con). Data represent four independent experiments. (c) Phosphorylation of MLC (pMLC) was evaluated at 0–3 h after OGD by western blotting and expressed relative to non-OGD controls. Data represent four independent experiments. *P≤0.05, **P≤0.01 versus non-OGD. (d) HBMECs were treated with vehicle or the ROCK inhibitor Y27632, or infected with lentiviral vectors carrying the scrambled short hairpin RNA (shRNA) sequence (ROCKsc) or ROCK-targeting sequence (ROCKt). Cells were then subjected to 1 h of OGD and pMLC was examined by western blotting at 1 h after OGD. Data represent four independent experiments. *P≤0.05, **P≤0.01. (ei) HBMECs were infected with control empty lentivirus (Lenti), or lentiviral vectors carrying HA-tagged WT ADF (ADF), HA-tagged constitutively active mutant ADF (ADFm), MLC-targeting shRNA (MLCt), ROCK-targeting shRNA (ROCKt) or non-targeting scrambled sequences (MLCsc or ROCKsc). In separate cultures, HBMECs were treated with vehicle or Y27632. Cells were subjected to 1-h OGD. (e) HBMECs were stained at 1 or 3 h after OGD for F-actin+ stress fibres (green) and the AJ protein VE-cadherin (red), and counterstained with 4′,6-diamidino-2-phenylindole (DAPI; blue) for nuclear labelling. Scale bar, 30 μm. OGD-induced stress fibre formation was significantly attenuated by ADFm overexpression, MLC knockdown, ROCK knockdown or ROCK inhibition. (fi) The ratio of F-actin to G-actin was quantified at 3 h after OGD. Data represent four independent experiments. (f) *P≤0.05, **P≤0.01 versus Lenti. #P≤0.05 versus ADF. (g) **P≤0.01 versus MLCsc. (h) *P≤0.05 versus ROCKsc. (i) **P≤0.01 versus vehicle.
Figure 4
Figure 4. Cytoskeletal reorganization and JP redistribution in endothelial cells causes early paracellular hyperpermeability after oxygen–glucose deprivation in vitro.
HBMECs were infected with Lenti, Lenti-ADF, Lenti-ADFm, Lenti-MLCsc, Lenti-MLCt, Lenti-ROCKsc or Lenti-ROCKt. In separate cultures, HBMECs were treated with vehicle or Y27632. Cells were then subjected to 1 h of OGD. (a,b) HBMECs were stained at 1 or 3 h after OGD for occludin (red) or VE-cadherin (green), and counterstained with DAPI (blue) for nuclear labelling. In ADFm-transfected cells, triple staining was performed for VE-cadherin (green), the HA tag (red) and DAPI nuclear labelling (blue), to show the cytosolic distribution of HA-ADFm. Scale bar, 30 μm. JPs are characteristically located at cell–cell contact sites under physiological, uninjured conditions. OGD resulted in a loss of occludin and VE-cadherin from the points of cell–cell contact, and this effect was inhibited by lentiviral ADFm overexpression or MLC knockdown. (c,d) The immunofluorescent staining intensity of plasma membrane occludin and VE-cadherin was quantified and expressed relative to non-OGD controls. Data represent four independent experiments. *P≤0.05, **P≤0.01 versus Lenti (c) or MLCsc (d). (e,f) Whole-cell extracts, the membrane fraction or the actin cytoskeleton fraction (ACF) were prepared at 1 h after OGD and immunoblotted for occludin (Occl), VE-cadherin (VE-C) and subfraction markers β-actin, CD31 or α-tubulin. Representative images and quantification of blots from the membrane fraction and ACF are presented. Data represent four independent experiments. *P≤0.05, **P≤0.01 versus Lenti (e) or MLCsc (f). (gj) Lentivirus-infected or drug-treated HBMECs were cultured in the in vitro BBB model, and subjected to 1 h of OGD. The diffusion coefficient of the 4.4 kDa-dextran was measured at 0–3 h after OGD. Data represent four independent experiments. *P≤0.05, **P≤0.01 versus Lenti (g), MLCsc (h), ROCKsc (i) or vehicle (j).
Figure 5
Figure 5. Transgenic overexpression of constitutively active ADF specifically within endothelial cells mitigates BBB disruption and reduces brain infarct size and brain oedema after focal cerebral ischaemia in vivo.
tFCI was induced for 1 h in WT mice and in Tg mice with EC-specific overexpression of HA-tagged WT ADF or constitutively active mutant ADF (ADFm), as described in Methods. (a,b) Regional cerebral blood flow was monitored using two-dimensional laser speckle imaging techniques. (a) Representative images of CBF at 15 min before tFCI (Pre), 15 min after the onset of tFCI and at 15 min of reperfusion (R). Scale bar, 1 mm. (b) Ischaemic areas measured from laser speckle images were not affected by transgene expression in either the ischaemic core (0–20% residual CBF) or penumbra (20–30% residual CBF). n=6 mice per group. (c) Representative images showing the extravasation of Alexa555-dextran (3 kDa, red) or plasma IgG (green) into the brain parenchyma 1–24 h after tFCI. Scale bar, 1 mm. (d) Volume of leakage of Alexa555-dextran and endogenous IgG at indicated reperfusion time points. n=6 mice per group. (e) Extravasation of the Evans blue dye into the brain 24 h after tFCI in whole brains and thick coronal sections. Scale bar, 2 mm. (f) Evans blue content in brain tissue in anterior and posterior sections. n=6 mice per group. (g) Brain water content measured at 24 h after tFCI. n=6 mice per group. (h,i) Brain infarct volume at 48 h after tFCI was measured on TTC-stained coronal sections. Scale bar, 2 mm. n=6–8 mice per group. (j) Infarct areas at 48 h after tFCI, measured on six consecutive MAP2-stained sections (1 mm apart) spanning the MCA territory. n=6–8 mice per group. *P≤0.05, **P≤0.01, ***P≤0.001 versus WT.
Figure 6
Figure 6. Targeted overexpression of ADFm specifically within endothelial cells improves long-term neurological functions after cerebral ischaemic injury in vivo.
(ad) Neurobehavioral tests were performed on WT and EC-specific ADFm-overexpressing mice before and 1–28 d after tFCI or sham operation. Sensorimotor deficits were evaluated by the rotarod test (a), cylinder test (b) and corner test (c). L, left; R, right; B, both forepaws in b. (d) Long-term cognitive deficits were assessed in the Morris water maze at 23–28 d after tFCI. The time needed for the animal to locate the submerged platform (escape latency) was measured from 23 to 27 d after tFCI. Spatial memory was evaluated at 28 d after tFCI by measuring the time spent in the target quadrant when the platform was removed. Gross locomotor functions, as reflected by similar swim speeds, were not affected by transgene expression. (e) Brain atrophy at 28 d after tFCI was quantified on MAP2 (green)-stained coronal sections. Dashed lines outline the relative area of the uninjured contralateral hemisphere to illustrate by comparison the area of ipsilateral atrophy. Scale bar, 1 mm. n=8–9 mice per group. *P≤0.05, **P≤0.01 versus WT. d, days.
Figure 7
Figure 7. ADFm overexpression blunts early cytoskeletal alterations in ECs after tFCI.
WT or Tg-ADFm mice received 1-h tFCI or sham (S) operation, and brain microvessel extracts were isolated at 0.5–3 h of reperfusion for western blotting analysis. The F/G-actin ratio (a) and pMLC (b) in ipsilateral cortical microvessels of WT mice were quantified. **P≤0.01, ***P≤0.001 versus sham. (c) Double-label immunostaining for pMLC and the endothelial marker CD31 in ipsilateral cortex. The leakage of the 3 kDa Alexa555-dextran is shown for each time point. Rectangle: the region enlarged in high-power images. Scale bar, 100 μm. (d) The F/G-actin ratio in microvessels at 1 h of reperfusion. **P≤0.01 versus WT. (e) Representative images showing the formation of F-actin+ stress fibres in CD31+ microvessels (arrow) in the ischaemic cortex. Scale bar, 10 μm. ADFm overexpression inhibited tFCI-induced formation of stress fibres. (f) Whole-cell extracts, the membrane fraction or the ACF were prepared from brain microvessel extracts at 1 h after tFCI and subsequently immunoblotted. Representative images and quantification of blots (normalized to WT contralateral) are presented. Endothelial ADFm overexpression suppressed tFCI-induced redistribution of JPs from the membrane fraction to the ACF. n=6 mice per group. *P≤0.05, **P≤0.01 versus WT. (g) Double-label immunostaining for VE-cadherin and CD31 in ipsilateral cortex at 1 h of reperfusion or after sham operation. Low-power images were shown (left top panel) with white lines delineating the shape of the vessels. Rectangles indicate regions where the high-power images were taken (shown in the left bottom panel). In non-ischaemic controls (both WT and Tg-ADFm brains), VE-cadherin immunofluorescence (arrows) was present predominantly at endothelial cell–cell contacts (cell membrane and extracellular space between cells; surrounding the cytosolic CD31 immunofluorescence). In WT brains, tFCI reduced the level of VE-cadherin immunofluorescence (arrows) in the cell–cell contacts of CD31+ endothelial cells but increased intracellular VE-cadherin immunofluorescence (asterisk) compared with non-ischaemic control brains. These changes were less frequently observed in Tg-ADFm brains. The enlarged images of VE-cadherin immunofluorescence (arrows) at endothelial cell–cell contacts (extracted from the rectangle regions at the left bottom panel) are shown on the right panel. Scale bar, 5 μm.
Figure 8
Figure 8. Early BBB damage leads to delayed JP degradation.
(ad) tFCI was induced in WT and Tg-ADFm mice for 1 h followed by 24 h of reperfusion. (a) Expression of JPs occludin, VE-cadherin and ZO-1, as well as the basal lamina protein laminin in whole-cell extracts from brain microvessels. Endothelial ADFm overexpression preserved occludin, VE-cadherin and laminin from tFCI-induced degradation. (b) Double-label immunostaining for laminin and CD31 in ipsilateral cortex. Consistent with its role as a basement membrane protein, laminin is distributed in the outer layer of CD31+ microvessels. Square: the region enlarged in high-power images. Arrowhead: partial loss of laminin protein (green signal). The overlap coefficient of laminin and CD31 immunofluorescence along the microvessels was calculated in the ischaemic core area and inner border zone, respectively. The coefficient was reduced after tFCI due to the partial loss of laminin, which was significantly attenuated in Tg-ADFm animals. (c) Double-label immunostaining for MMP-9 and CD31 in ipsilateral cortex. MMP-9 was upregulated after tFCI, mainly in CD31+ microvessels (arrowhead) and in infiltrated immune cells (arrow; see Supplementary Fig. 12a). ADFm overexpression abolished the upregulation of brain MMP-9. Scale bar, 50 μm. (d) MMP-9 or MMP-2 levels were measured by gelatin zymography in brain tissues and plasma. Endothelial ADFm overexpression blocked tFCI-induced MMP-9 elevation in the brain but not in the plasma. n=5–6 mice per group. *P≤0.05, **P≤0.01 versus WT. (e,f) Blood neutrophils were extracted from MMP-9+/+ or MMP-9−/− mice 24 h after tFCI. HBMECs were exposed to 1 h of OGD, and immediately co-cultured with these neutrophils for 1–3 h. Expression of occludin and VE-cadherin in HBMECs was then examined. (e) OGD-challenged HBMECs became vulnerable to neutrophil-induced JP degradation. (f) The degradation of JPs was mediated by MMP-9, as MMP-9−/− neutrophils failed to elicit protein degradation in OGD-challenged HBMECs. *P≤0.05, **P≤0.01 versus no neutrophil controls (Con). (g) HBMECs were infected with Lenti or Lenti-ADFm. After 48 h, cells were subjected to OGD, followed by co-culture with MMP-9+/+ neutrophils for 1–2 h. ADFm expression significantly preserved occludin and VE-cadherin against neutrophil MMP-9-mediated degradation. *P≤0.05, **P≤0.01 versus OGD+Lenti. Data represent four independent experiments.
Figure 9
Figure 9. Overexpression of ADFm specifically in endothelial cells attenuates proinflammatory responses after ischaemic injury in vivo.
tFCI was induced in WT or Tg-ADFm mice followed by 24 h of reperfusion. (a) Representative images from the inner border of infarction in the cortex after tFCI or the corresponding region after sham operation, showing immunostaining for the following markers: MPO (green, neutrophil), F4/80 (green, macrophage), NeuN (red, neuron), Iba1 (red, microglia/macrophage) and CD206 (green, activated M2 microglia/macrophage). Square: the region enlarged in high-power images. Scale bar, 20 μm. (b) MPO+, F4/80+ and Iba1/CD206+ cells were counted in the areas described in a, and data were expressed as the number of cells per mm3. n=6 mice per group. (c,d) Flow cytometric quantification of GR1+, CD45high (circle) and CD45int (oval) cells among the CD11b+ cell populations in WT and Tg-ADFm brains after tFCI or sham operation. Each fluorescence-activated cell sorting (FACS) sample was from two pooled brains. Data represent four independent experiments. Both immunofluorescent staining and FACS analyses demonstrated that endothelial ADFm overexpression impeded the infiltration of blood neutrophils/macrophages into the stroke brain without altering the numbers of resident microglia. (e) A panel of inflammatory markers was examined using the quantitative inflammation array in microvessel extracts from the ischaemic hemisphere at 24 h after tFCI. Levels of inflammatory markers were expressed relative to WT sham. ADFm overexpression significantly reduced the expression of several inflammation markers, including CCL2, IL-17, CXCL1, IL-6, ICAM-1 and CCL5. n=4 mice per group. *P≤0.05, **P≤0.01, ***P≤0.001 versus WT.
Figure 10
Figure 10. Proposed mechanisms underlying BBB disruption after stroke and the role of BBB leakage in the progression of permanent neurovascular damage.
The evolution of BBB breakdown after cerebral ischaemia/reperfusion (I/R) progresses along the following steps: (1) I/R rapidly induces cytoskeletal alterations in brain microvascular endothelial cells (ECs). Actin polymerization is enhanced and F-actin+ stress fibres are formed inside injured ECs, resulting from both the activation of ROCK/MLC signalling and release from endogenous inhibition by ADF (supported by Figs 3 and 7). (2) Stress fibre formation causes EC contraction and disassembles tight junctional and adherens JPs (supported by Fig. 4) through junctional accessory proteins (for example, ZO-1). The disassembly and redistribution of JPs lead to subtle BBB hyperpermeability and induce extravasation of fluid and small macromolecules from blood into the central nervous system (supported by Fig. 1). (3) More importantly, the weakened barrier becomes more vulnerable to MMP-9-mediated degradation of JPs and basement membrane (BM) components (for example, laminin; supported by Fig. 8), further damaging the BBB and permitting eventual leakage of large macromolecules (supported by Fig. 2). (4) Peripheral immune cells, including neutrophils and macrophages, then transmigrate across the compromised BBB. Infiltrated immune cells release even more MMP-9 and other inflammatory mediators, degrading the ECM and causing irreversible BBB breakdown, secondary tissue injury and a sizeable infarct (supported by Fig. 9). By targeting the early structural changes in ECs, ADF overexpression shuts down the evolution of BBB disruption from the beginning. Continuous activity of ADF via overexpression of the nonphosphorylatable ADFm attenuates early BBB damage, as well as subsequent tissue injury, thereby offering long-term functional improvements (supported by Figs 5, 6, 7).

References

    1. Neuwelt E. A. et al.. Engaging neuroscience to advance translational research in brain barrier biology. Nat. Rev. Neurosci. 12, 169–182 (2011). - PMC - PubMed
    1. Khatri R., McKinney A. M., Swenson B. & Janardhan V. Blood-brain barrier, reperfusion injury, and hemorrhagic transformation in acute stroke. Neurology 79, S52–S57 (2012). - PubMed
    1. Neumann-Haefelin T. et al.. Serial MRI after transient focal cerebral ischemia in rats: dynamics of tissue injury, blood-brain barrier damage, and edema formation. Stroke 31, 1965–1972 (2000). - PubMed
    1. Olah L., Wecker S. & Hoehn M. Secondary deterioration of apparent diffusion coefficient after 1-hour transient focal cerebral ischemia in rats. J. Cereb. Blood Flow Metab. 20, 1474–1482 (2000). - PubMed
    1. Kaur J. et al.. Quantified T1 as an adjunct to apparent diffusion coefficient for early infarct detection: a high-field magnetic resonance study in a rat stroke model. Int. J. Stroke 4, 159–168 (2009). - PubMed

Publication types