

Phylogenomic exploration of the relationships between strains of Mycobacterium avium subspecies paratuberculosis
- PMID: 26813574
- PMCID: PMC4729121
- DOI: 10.1186/s12864-015-2234-5
Phylogenomic exploration of the relationships between strains of Mycobacterium avium subspecies paratuberculosis
Abstract
Background: Mycobacterium avium subspecies paratuberculosis (Map) is an infectious enteric pathogen that causes Johne's disease in livestock. Determining genetic diversity is prerequisite to understanding the epidemiology and biology of Map. We performed the first whole genome sequencing (WGS) of 141 global Map isolates that encompass the main molecular strain types currently reported. We investigated the phylogeny of the Map strains, the diversity of the genome and the limitations of commonly used genotyping methods.
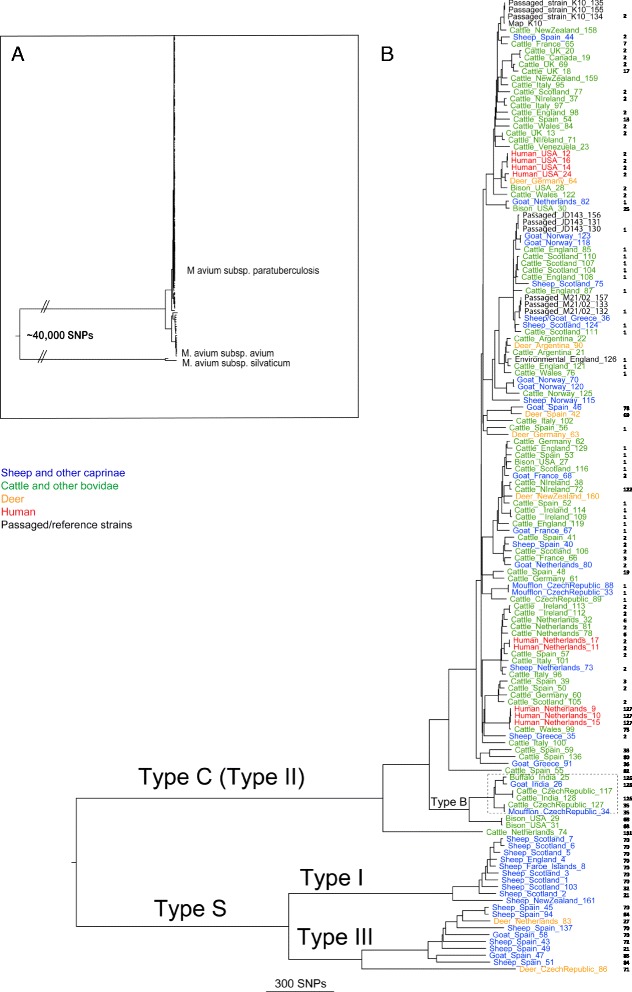
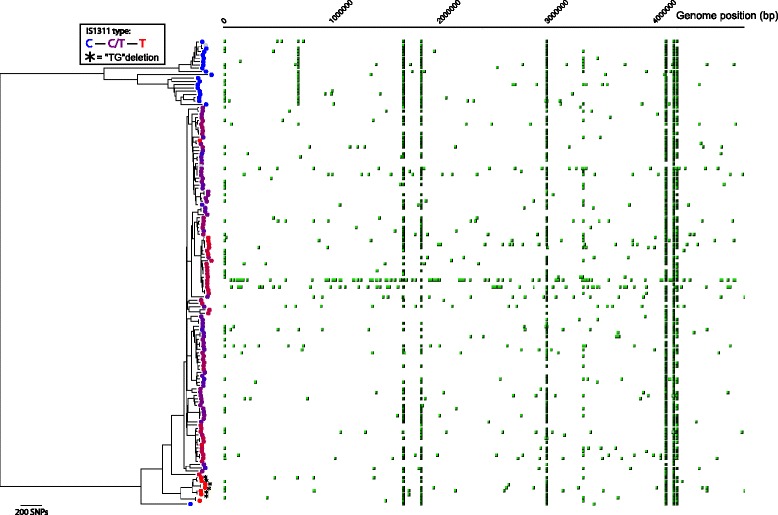
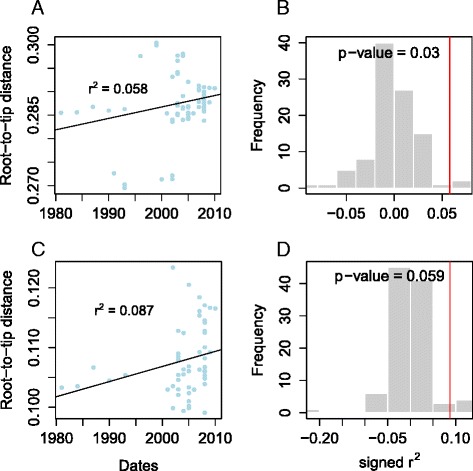
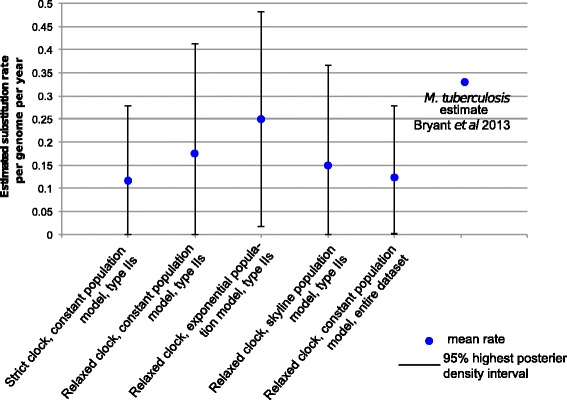
Results: Single nucleotide polymorphism (SNP) and phylogenetic analyses confirmed two major lineages concordant with the former Type S and Type C designations. The Type I and Type III strain groups are subtypes of Type S, and Type B strains are a subtype of Type C and not restricted to Bison species. We found that the genome-wide SNPs detected provided greater resolution between isolates than currently employed genotyping methods. Furthermore, the SNP used for IS1311 typing is not informative, as it is likely to have occurred after Type S and C strains diverged and does not assign all strains to the correct lineage. Mycobacterial Interspersed Repetitive Unit-Variable Number Tandem Repeat (MIRU-VNTR) differentiates Type S from Type C but provides limited resolution between isolates within these lineages and the polymorphisms detected do not necessarily accurately reflect the phylogenetic relationships between strains. WGS of passaged strains and coalescent analysis of the collection revealed a very high level of genetic stability, with the substitution rate estimated to be less than 0.5 SNPs per genome per year.
Conclusions: This study clarifies the phylogenetic relationships between the previously described Map strain groups, and highlights the limitations of current genotyping techniques. Map isolates exhibit restricted genetic diversity and a substitution rate consistent with a monomorphic pathogen. WGS provides the ultimate level of resolution for differentiation between strains. However, WGS alone will not be sufficient for tracing and tracking Map infections, yet importantly it can provide a phylogenetic context for affirming epidemiological connections.
Figures
Similar articles
-
Molecular characterisation of Mycobacterium avium subsp. paratuberculosis in Australia.BMC Microbiol. 2021 Apr 1;21(1):101. doi: 10.1186/s12866-021-02140-2. BMC Microbiol. 2021. PMID: 33789575 Free PMC article.
-
Inter- and intra-subtype genotypic differences that differentiate Mycobacterium avium subspecies paratuberculosis strains.BMC Microbiol. 2012 Nov 19;12:264. doi: 10.1186/1471-2180-12-264. BMC Microbiol. 2012. PMID: 23164429 Free PMC article.
-
Genetic Features of Mycobacterium avium subsp. paratuberculosis Strains Circulating in the West of France Deciphered by Whole-Genome Sequencing.Microbiol Spectr. 2022 Dec 21;10(6):e0339222. doi: 10.1128/spectrum.03392-22. Epub 2022 Nov 29. Microbiol Spectr. 2022. PMID: 36445077 Free PMC article.
-
Strain diversity within Mycobacterium avium subspecies paratuberculosis--a review.Indian J Exp Biol. 2010 Jan;48(1):7-16. Indian J Exp Biol. 2010. PMID: 20358861 Review.
-
Current understanding of the genetic diversity of Mycobacterium avium subsp. paratuberculosis.Microbes Infect. 2006 Apr;8(5):1406-18. doi: 10.1016/j.micinf.2005.12.003. Epub 2006 Jan 26. Microbes Infect. 2006. PMID: 16697677 Review.
Cited by
-
Genetic diversity of bovine Mycobacterium avium subsp. paratuberculosis discriminated by IS1311 PCR-REA, MIRU-VNTR, and MLSSR genotyping.J Vet Sci. 2018 Sep 30;19(5):627-634. doi: 10.4142/jvs.2018.19.5.627. J Vet Sci. 2018. PMID: 29929361 Free PMC article.
-
Paratuberculosis in Captive Scimitar-Horned Oryxes (Oryx dammah).Animals (Basel). 2020 Oct 23;10(11):1949. doi: 10.3390/ani10111949. Animals (Basel). 2020. PMID: 33113949 Free PMC article.
-
Methods for Detecting Mycobacterial Mixed Strain Infections-A Systematic Review.Front Genet. 2020 Dec 21;11:600692. doi: 10.3389/fgene.2020.600692. eCollection 2020. Front Genet. 2020. PMID: 33408740 Free PMC article.
-
Sheep challenged with sheep-derived type II Mycobacterium avium subsp. paratuberculosis: the first experimental model of paratuberculosis in China.BMC Vet Res. 2025 Apr 29;21(1):298. doi: 10.1186/s12917-025-04765-1. BMC Vet Res. 2025. PMID: 40301886 Free PMC article.
-
Molecular characterisation of Mycobacterium avium subsp. paratuberculosis in Australia.BMC Microbiol. 2021 Apr 1;21(1):101. doi: 10.1186/s12866-021-02140-2. BMC Microbiol. 2021. PMID: 33789575 Free PMC article.
References
-
- Barkema HW, Hesselink JW, McKenna SLB, Benedictus G, Groenendaal H. Global prevalence and economics of infection with Mycobacterium avium subsp. paratuberculosis in ruminants. In: Behr MA, Collins DM, editors. Paratuberculosis: organism, disease, control. Cambridge: CAB International; 2010. pp. 10–21.
-
- Hutchings MR, Stevenson K, Greig A, Davidson R, Marion G, Judge J. Infection of non-ruminant wildlife by Mycobacterium avium subsp. paratuberculosis. In: Behr MA, Collins DM, editors. Paratuberculosis: organism, disease, control. Cambridge: CAB International; 2010. pp. 188–200.
-
- Ghadiali AH, Strother M, Naser SA, Manning EJ, Sreevatsan S. Mycobacterium avium subsp. paratuberculosis strains isolated from Crohn’s disease patients and animal species exhibit similar polymorphic locus patterns. J Clin Microbiol. 2004;42:5345–8. doi: 10.1128/JCM.42.11.5345-5348.2004. - DOI - PMC - PubMed
Publication types
MeSH terms
Grants and funding
LinkOut - more resources
Full Text Sources
Other Literature Sources
