. 2016 Feb;28(2):466-84.
doi: 10.1105/tpc.15.00497. Epub 2016 Jan 26.

Interactions of C4 Subtype Metabolic Activities and Transport in Maize Are Revealed through the Characterization of DCT2 Mutants

Affiliations

Interactions of C4 Subtype Metabolic Activities and Transport in Maize Are Revealed through the Characterization of DCT2 Mutants

Sarit Weissmann et al. Plant Cell. 2016 Feb.

Abstract

C4 photosynthesis in grasses requires the coordinated movement of metabolites through two specialized leaf cell types, mesophyll (M) and bundle sheath (BS), to concentrate CO2 around Rubisco. Despite the importance of transporters in this process, few have been identified or rigorously characterized. In maize (Zea mays), DCT2 has been proposed to function as a plastid-localized malate transporter and is preferentially expressed in BS cells. Here, we characterized the role of DCT2 in maize leaves using Activator-tagged mutant alleles. Our results indicate that DCT2 enables the transport of malate into the BS chloroplast. Isotopic labeling experiments show that the loss of DCT2 results in markedly different metabolic network operation and dramatically reduced biomass production. In the absence of a functioning malate shuttle, dct2 lines survive through the enhanced use of the phosphoenolpyruvate carboxykinase carbon shuttle pathway that in wild-type maize accounts for ∼ 25% of the photosynthetic activity. The results emphasize the importance of malate transport during C4 photosynthesis, define the role of a primary malate transporter in BS cells, and support a model for carbon exchange between BS and M cells in maize.


Figures

Figure 1.
Figure 1.
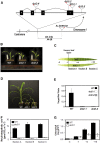
Molecular and Physiological Data for Wild-Type and dct2 Lines. Insertional mutagenesis of DCT2 resulted in pale leaves and loss of carbon assimilation gradient. (A) Ac.bti99221, located 401.2 kb (0.44 cM) 5′ of DCT2, relocated creating four insertions in and around the gene: two in the first exon (dct2-1 and dct2-2), one in the 5′ untranslated region (dct2-3), and one in the second intron (dct2-4). Red triangles indicate the 5′ end of the Ac insert. (B) Wild-type (WT) and mutant plants (dct2-1 and dct2-2) 9 d after sowing. Red demarcations indicate a metric ruler with labeled centimeter increments. (C), (F), and (G) Nine-day-old leaves of the wild type and dct2-1 showing loss of color gradient. Sections A, B, and C were tested for net CO2 assimilation (F) with an infrared gas analyzer (LI-6400). Segments −4, −1, +4, and +10 were sampled for RNA-seq and metabolite quantification, including chlorophyll levels (G). (D) Five-week-old wild-type and dct2-1 and dct2-2 plants showing the impeded development of mutant plants compared with the wild-type. (E) Quantitative real-time PCR of DCT2 transcripts in the wild type (black). dct2-1 (white) and dct2-2 (gray) show no detectable transcripts of DCT2. Target/ref ratio calculated as DCT2/tubulin expression level. Error bars in (C), (E), and (F) represent sd (n = 3).
Figure 2.
Figure 2.
TEM of Wild-Type and dct2-1 Leaf Segments. TEM analysis of the ultrastructure of four segments sampled along a developing third leaf at 9 d after sowing suggests impeded development of photosynthetic cells in dct2-1. The four segments correspond to four rows of panels in the figure and indicate position along the leaf inspected from the base of the leaf (also called −4) to the tip (also called +10) as stated along the y axis. For both the wild type and dct2-1, two columns are presented that show varying degrees of magnification to emphasize salient features described in the text. In particular, the panels emphasize a differing number of vacuoles in −4, differing grana structure and chloroplast size in −1 and +4, and reduced starch and granal stacking in +10. Ch, chloroplast; Vc, vacuole; sg, starch. Bars = 20 µm in (A), (G), (I), (K), (M), and (O), 1 µm in (B), (H), and (J), 10 µm in (C) and (E), and 2 µm in (D), (F), (L), (N), and (P).
Figure 3.
Figure 3.
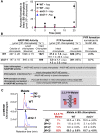
Malate Transport in the Wild Type and dct2-1. Malate-dependent pyruvate formation, NADP-ME activities, and 2,3,3-2H-malate labeling of BS chloroplasts were measured in 9-d-old wild-type and dct2-1 plants. (A) Time course of malate-dependent pyruvate formation in BS chloroplasts of wild-type (square symbols) and dct2-1 (round and triangle symbols) plants. BS chloroplasts were suspended in 10 mM malate with or without 10 mM aspartate and the amount of pyruvate formed was quantified spectrophotometrically (se, n = 3). (B) NADP-ME activity and pyruvate (PYR) formation rate in BS chloroplasts of wild-type and dct2-1 plants (se, n = 3). NADP-ME activity was based on spectral detection of NADP at 340 nm. The rates of pyruvate formation in chloroplasts with or without aspartate were calculated from the slopes in (A) (2 to 5 min). Calculations for the intact chloroplast NADP-ME activity, chloroplast intactness (%), and pyruvate formation in intact chloroplasts normalized to NADP-ME activity (%) are defined in the gray box. Intact chloroplast NADP-ME activity indicates the formation of pyruvate that is not transport limited; thus, normalization by this value provides a comparison specific to the transport function. The percentages in parentheses for pyruvate formation from lysed chloroplasts indicate the pyruvate formation rate relative to maximal NADP-ME activity (e.g., 826/1828; 45%). (C) Quantification of malate labeling in BS chloroplasts after 1 h of incubation with 2,3,3-2H-malate (purple box, deuteriums indicated by “D” in the small red boxes). LC-MS/MS chromatograms indicate the peaks of unlabeled ([M]+) and triple labeled ([M+3]+) malate. Malate pool sizes in dct2-1 BS chloroplasts was 42% of the wild type; therefore, twice the amount was injected onto LC-MS/MS for labeling quantification in the spectra. Table: fractional abundance of mass isotopomers in 2,3,3-2H-malate standard, wild-type, and dct2-1 BS chloroplasts after labeling (sd, n = 3). [M+i]+, the ith-labeled mass isotopomer. Labeling data were corrected for natural isotope abundance.
Figure 4.
Figure 4.
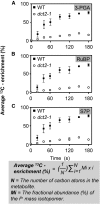
13CO2 Labeling of Metabolites. Data were collected from 13CO2 (∼330 ppm) labeled leaf segments (sections B+C in Figure 1C) of 9-d-old wild-type (solid symbols) and dct2-1 plants (open symbols) at a light intensity of 500 µmol m−2 s−1 and analyzed for labeling of Calvin cycle intermediates including 3-PGA (A), ribulose-1,5-bisphosphate (RuBP) (B), and sedoheptulose-7-phosphate (S7P) (C). Labeled samples were collected over a 3-min interval at 20, 40, 60, 90, 120, 150, and 180 s. Average 13C enrichment (%) was calculated using the formula defined in the gray box, where N is the number of carbon atoms in the metabolite and Mi is the fractional abundance (%) of the ith mass isotopomer. Mi data were corrected for natural isotope abundance (sd, n = 3). Additional mass isotopomer data are reported in Supplemental Data Set 2.
Figure 5.
Figure 5.
13CO2 Labeling of Malate and Aspartate in Leaf Segments of 9-d-Old Wild-Type and dct2-1 Plants. Leaf segments (sections B + C in Figure 1C) were labeled with 330 ppm 13CO2 at a light intensity of 500 µmol m−2 s−1 as previously described and analyzed for malate and aspartate labeling. (A) Simplified metabolic network indicating the position of the singly labeled mass isotopomer [M+1]+ of malate and ASP in C4 photosynthesis. Other intermediates involved in the Calvin cycle can be more extensively labeled ([M+2]+ or [M+7]+) based on the number of carbon atoms. [M+i]+ is ith mass isotopomer. M is the base mass and i is the number of labeled carbons. (B) Relative abundance (%) of [M+1]+ in malate and aspartate (sd, n = 3). Wild-type leaf segments were labeled for 1, 2, 5, 10, 20, 40, 60, 90, 120, 150, and 180 s . dct2-1 leaf segments were labeled for 20, 40, 60, 90, 120, 150, and 180 s. Solid (wild type) and dotted (dct2-1) lines indicate the linear rate of incorporation. (C) Absolute pool sizes (nmol g FW−1) of malate and aspartate (se, n = 3) in leaf segments of wild-type and dct2-1 measured on LC-MS/MS. Samples were taken from unlabeled leaf segments. (D) Initial incorporation rate of [M+1]+ carbon (nmol g FW−1 s−1) in malate and aspartate calculated from the pool sizes in (B) and the slopes in (C). Asterisk indicates that malate metabolism in dct2-1 was not determined (nd) from 13CO2 leaf labeling due to its accumulation in other places.
Figure 6.
Figure 6.
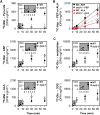
14C-Malate, Aspartate, and Glutamate Labeling of BS Cells. Wild-type (solid symbols) and dct2-1 (open symbols) plants were 14C labeled to describe BS photosynthetic operation (sd, n = 3). Inset shaded plots emphasize the initial 5-min incorporation. (A) Time-course incorporation of 14C-malate into pyruvate, aspartate (ASP), and alanine (ALA). (B) Time-course incorporation of 14C-ASP into PEP (square symbols) and ALA (red triangle symbols). Solid (wild-type) and dotted (dct2-1) lines indicated the linear incorporations after lag period. (C) Time-course incorporation of 14C-glutamate into polar metabolites and 2-OG.
Figure 7.
Figure 7.
Time Course 2,3,3-2H-Malate Labeling of BS Cells in Wild-Type and dct2-1 Plants. (A) Metabolites labeled from provision of 2,3,3-2H-malate (purple box) in BS cells. [M]+ is the unlabeled mass isotopomer. [M+1]+, [M+2]+, and [M+3]+ contain one to three deuterium atoms. Orange and blue lines indicate reactions that could lead to [M+1]+ and [M+2]+ mass isotopomers, respectively, of alanine and aspartate. Only directly impacted heteroatoms (i.e., hydrogens) are presented. (B) Labeling pattern of fumarate (FUM), aspartate, and alanine in the wild type (black/gray) and dct2-1 (red/dotted). All data were corrected for natural isotope abundance (sd, n = 4). (C) Quantification of deuterium isotope incorporation (nmol gFW−1) into aspartate and alanine from labeled malate (sd, n = 4). Data were calculated from pool sizes of aspartate and alanine in BS cells and the summed relative labeling data in (B). Solid (wild type) and dotted (dct2-1) lines reflected the linear incorporation rates that were quantified as slopes (nmol gFW−1 s−1).
Figure 8.
Figure 8.
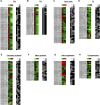
Heat Map Representation of the Differences in Gene Expression between dct2-1 and Wild-Type Plants. RNA-seq was performed on four segments along the developmental gradient of 9-d-old plants. Values represent log2 (dct2-1 FPKM/wild-type FPKM). Red indicates upregulation in dct2-1 relative to the wild type, and green indicates downregulation in dct2-1 relative to the wild type. Each heat map is accompanied by a significance plot: black squares indicate a statistically significant difference in gene expression in dct2-1 relative to the wild type in a specific segment; gray squares represent unsignificant differences. Squares in each row, moving from left to right, represent segments −4, −1, +4, and +10 (as defined in Figure 1C).
Figure 9.
Figure 9.
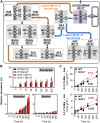
C4 Photosynthesis Including Coordination between Subtype Pathways. In maize, C4 photosynthesis involves the movement of carbon between M and BS cells using the NADP-ME and, to a lesser extent, the PEPCK pathways (black lines). Mitochondrial reactions may play a limited role in both wild-type and dct2-1 lines. Blue lines indicate steps that can partially compensate for reduced malate transport in the dct2-1 line. The provision of aspartate results in enhanced malate import in the wild type where the aspartate is either recycled directly or used to produce nitrogen and OAA. OAA could be exported or contribute to CO2 generation and the production of alanine that is more prominent in the compromised dct2-1 line. Dashed lines indicate reactions for which more information is needed.

Similar articles

Cited by

References

    1. Arnon D.I. (1949). Copper enzymes in isolated chloroplasts - polyphenoloxidase in beta-vulgaris. Plant Physiol. 24: 1–15. - PMC - PubMed
    1. Becker T.W., Carrayol E., Hirel B. (2000). Glutamine synthetase and glutamate dehydrogenase isoforms in maize leaves: localization, relative proportion and their role in ammonium assimilation or nitrogen transport. Planta 211: 800–806. - PubMed
    1. Boag S., Jenkins C.L.D. (1985). CO2 assimilation and malate decarboxylation by isolated bundle sheath chloroplasts from Zea mays. Plant Physiol. 79: 165–170. - PMC - PubMed
    1. Boag S., Jenkins C.L.D. (1986). The involvement of aspartate and glutamate in the decarboxylation of malate by isolated bundle sheath chloroplasts from Zea mays. Plant Physiol. 81: 115–119. - PMC - PubMed
    1. Bräutigam A., Weber A.P. (2011). Do metabolite transport processes limit photosynthesis? Plant Physiol. 155: 43–48. - PMC - PubMed

Publication types

MeSH terms

LinkOut - more resources