. 2016 Feb;28(2):537-56.
doi: 10.1105/tpc.15.00404. Epub 2016 Jan 26.

Pectin Biosynthesis Is Critical for Cell Wall Integrity and Immunity in Arabidopsis thaliana

Affiliations

Pectin Biosynthesis Is Critical for Cell Wall Integrity and Immunity in Arabidopsis thaliana

Gerit Bethke et al. Plant Cell. 2016 Feb.

Abstract

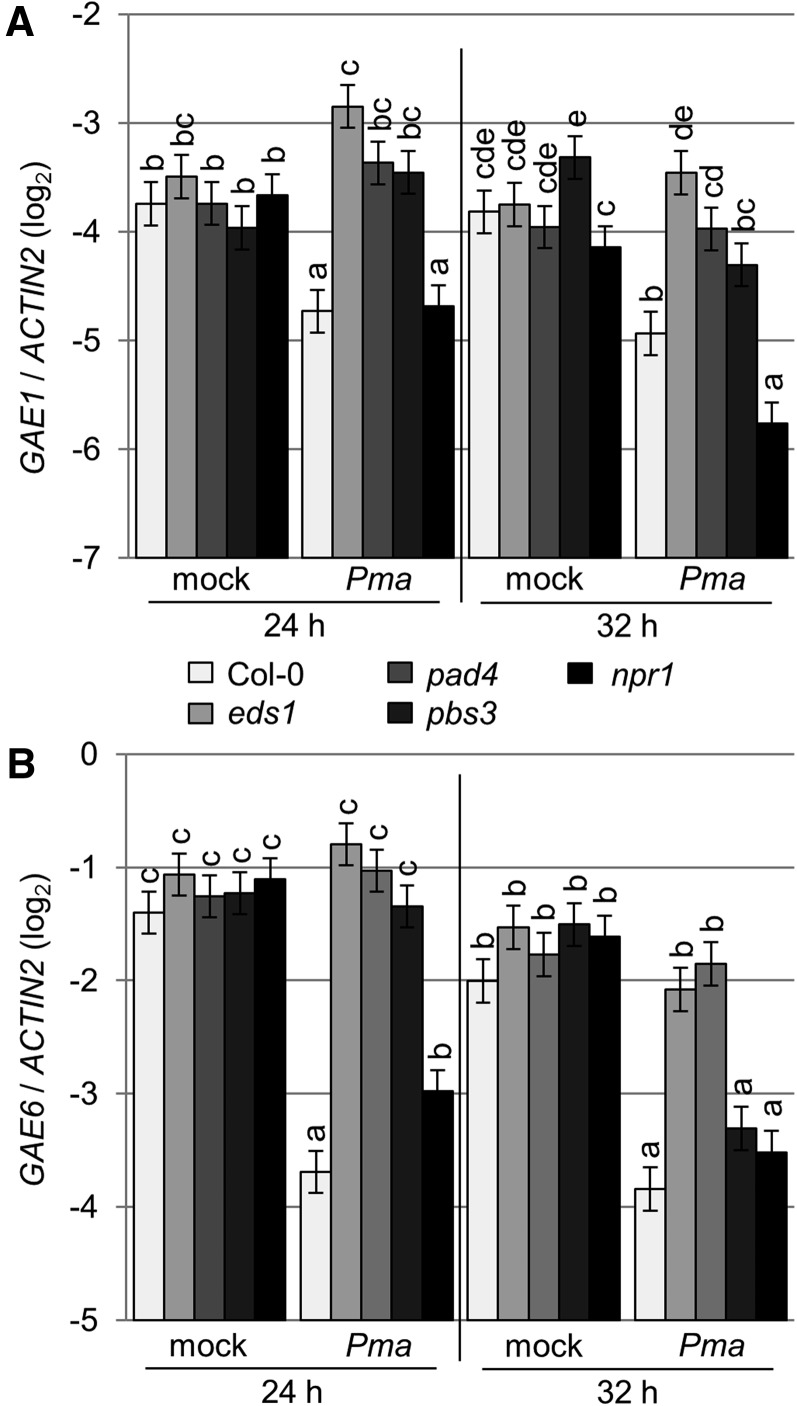
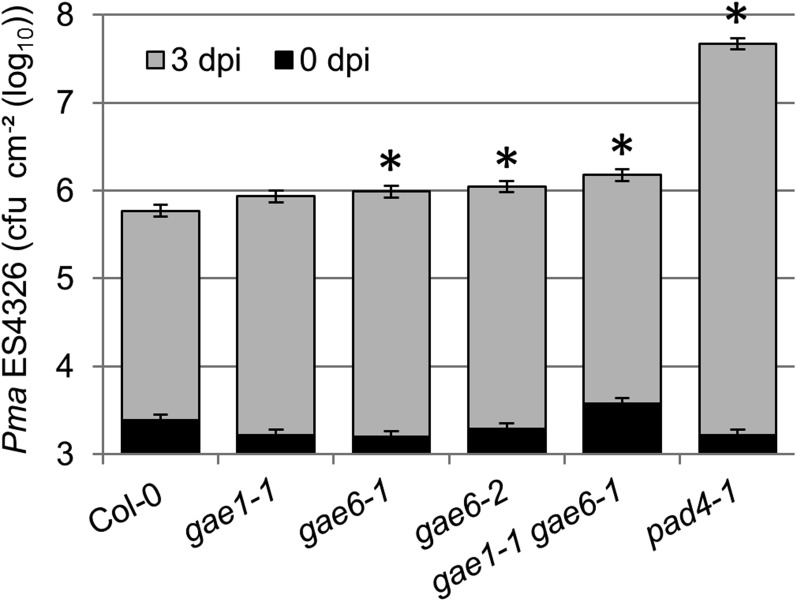
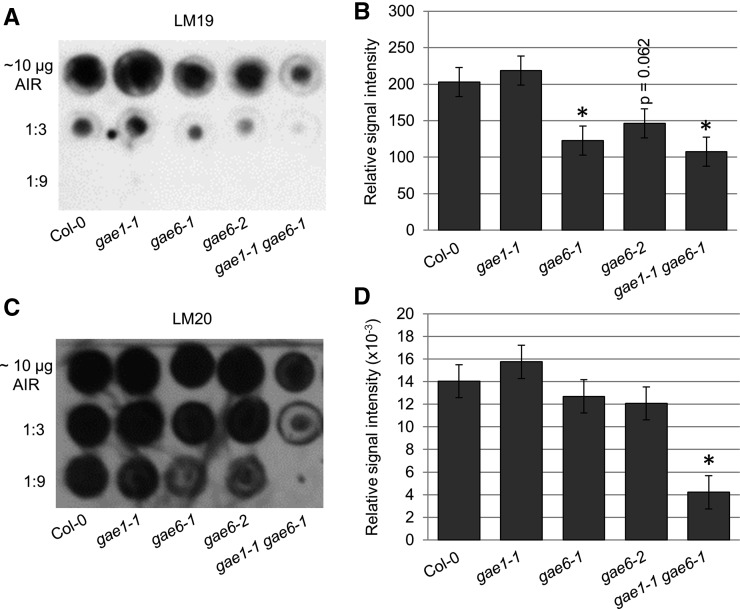
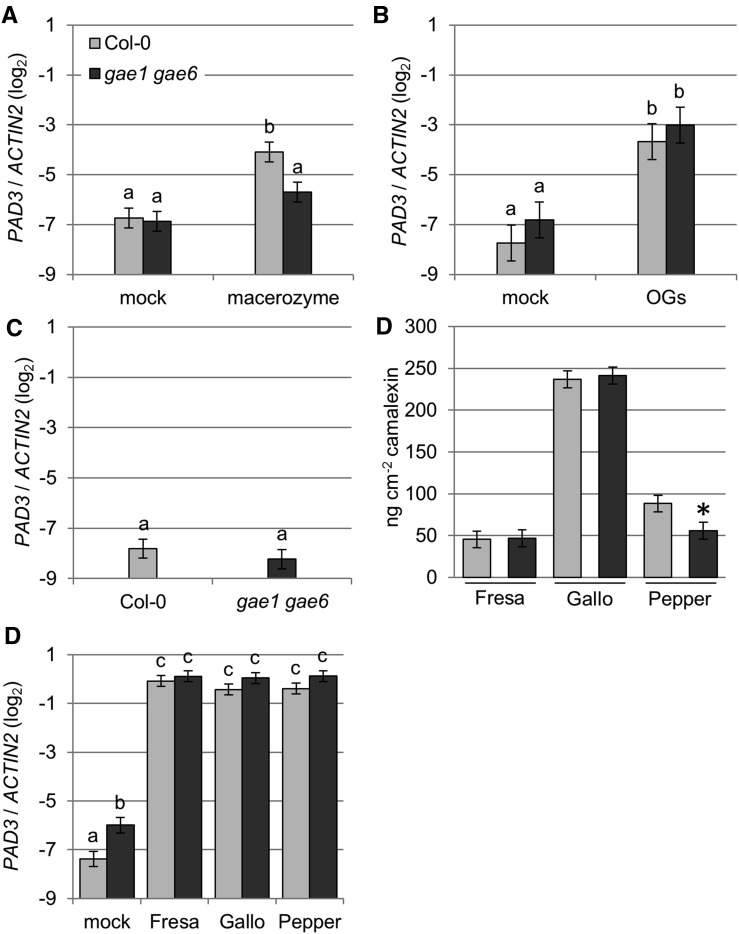
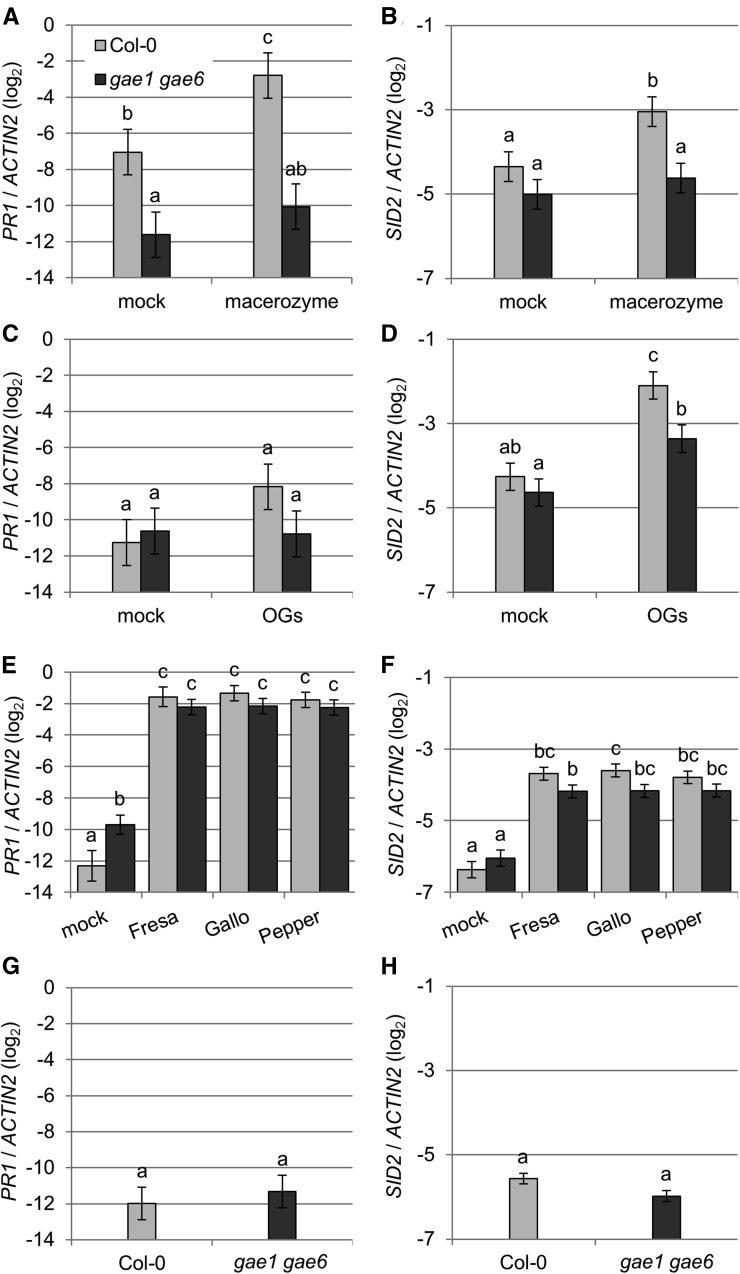
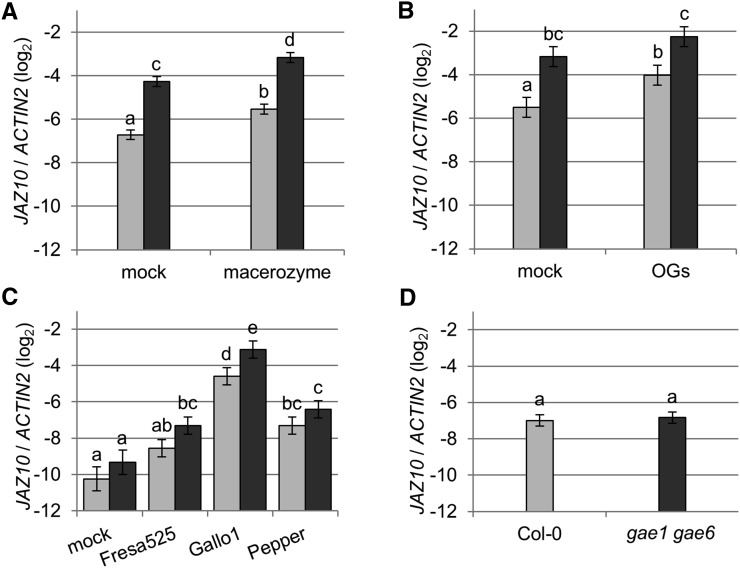
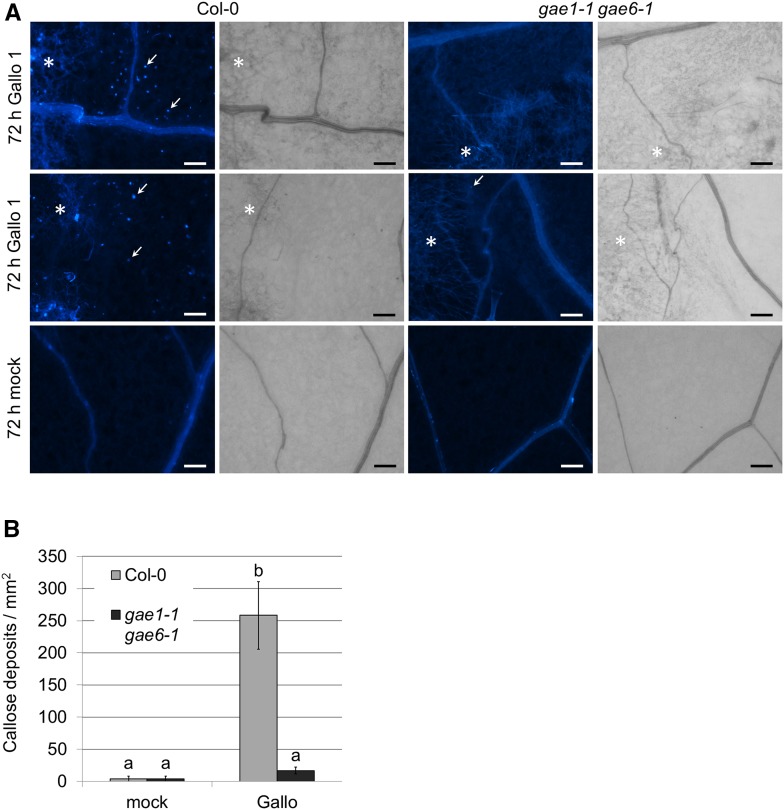
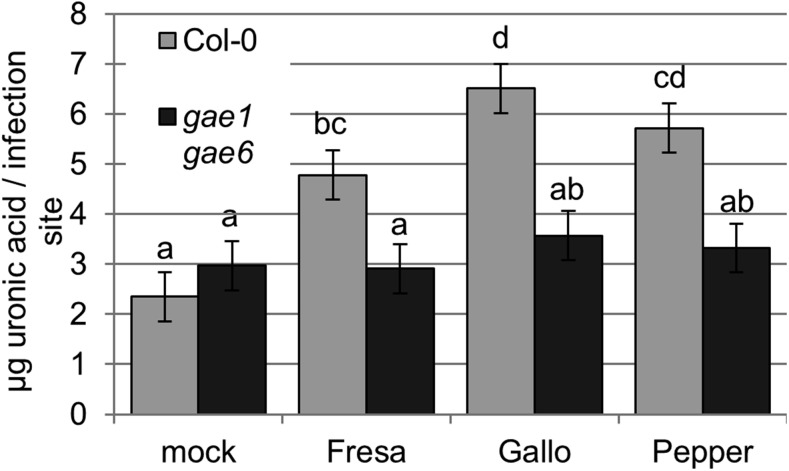
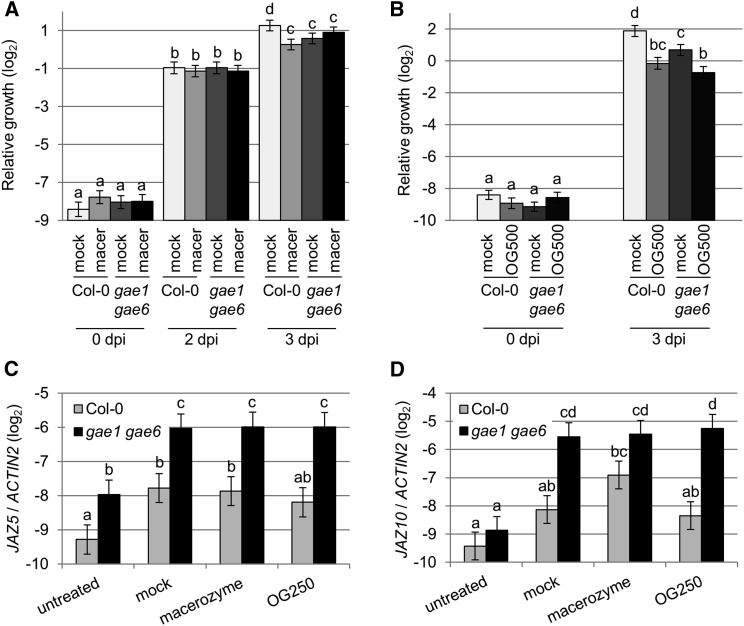
Plant cell walls are important barriers against microbial pathogens. Cell walls of Arabidopsis thaliana leaves contain three major types of polysaccharides: cellulose, various hemicelluloses, and pectins. UDP-D-galacturonic acid, the key building block of pectins, is produced from the precursor UDP-D-glucuronic acid by the action of glucuronate 4-epimerases (GAEs). Pseudomonas syringae pv maculicola ES4326 (Pma ES4326) repressed expression of GAE1 and GAE6 in Arabidopsis, and immunity to Pma ES4326 was compromised in gae6 and gae1 gae6 mutant plants. These plants had brittle leaves and cell walls of leaves had less galacturonic acid. Resistance to specific Botrytis cinerea isolates was also compromised in gae1 gae6 double mutant plants. Although oligogalacturonide (OG)-induced immune signaling was unaltered in gae1 gae6 mutant plants, immune signaling induced by a commercial pectinase, macerozyme, was reduced. Macerozyme treatment or infection with B. cinerea released less soluble uronic acid, likely reflecting fewer OGs, from gae1 gae6 cell walls than from wild-type Col-0. Although both OGs and macerozyme-induced immunity to B. cinerea in Col-0, only OGs also induced immunity in gae1 gae6. Pectin is thus an important contributor to plant immunity, and this is due at least in part to the induction of immune responses by soluble pectin, likely OGs, that are released during plant-pathogen interactions.


Figures

Figure 1.
Figure 1.
Pma ES4326-Induced Repression of GAE1 and GAE6 Expression Requires PAD4, EDS1, and PBS3. (A) Expression of GAE1 in leaves of wild-type Col-0 and mutant plants. Expression was measured 24 or 32 h after either inoculation with Pma ES4326 (OD600 = 0.002) or mock inoculation with 5 mM MgSO4 and was then normalized to the level of ACTIN2. Data from three biological replicates were combined using a mixed linear model. Bars represent mean log2 ratios to ACTIN2 ± se. Letters indicate significantly different groups with q < 0.05, where 0.05 represents the maximum false discovery rate at which the test may be called significant. (B) Expression of GAE6 measured as described in (A).
Figure 2.
Figure 2.
Susceptibility of gae6 and gae1 gae6 Plants to Pma ES4326 Is Increased Relative to Wild-Type Col-0. Leaves of plants of the indicated genotypes were inoculated with Pma ES4326 (OD600 = 0.0002) as described in Methods. Bacterial titers in leaves were determined either immediately (0 dpi) or after 3 d (3 dpi). Bars represent the mean ± se of four independent experiments, each with 4 or 12 biological replicates at 0 and 3 dpi, respectively. Data were combined using a mixed linear model. Asterisks indicate significant differences from Col-0 wild type (q < 0.05). Susceptible pad4 plants were included as a positive control. cfu, colony-forming units.
Figure 3.
Figure 3.
Mutant gae6 and gae1 gae6 Plants Have Brittle Leaves. (A) Depiction of the assay for brittleness of gae mutant leaves. Fully expanded leaves of 4- to 5-week-old plants were bent by 180° so that the adaxial surface of the leaf was parallel with the soil. Broken leaf petioles or midribs were considered brittle. (B) Quantification of broken midribs or petioles. For each genotype, 66 to 82 leaves were analyzed for brittleness as described in (A). Bars represent the ratio of broken to total number of leaves tested. Results were analyzed using Fisher’s exact test. Letters indicate significantly different groups at P < 0.05. (C) Conductivity measurements. Leaves of 4-week-old plants were inoculated with deionized water and then leaf discs were cut out and placed on deionized water. Conductivity was measured at the indicated time points. After 30 min, the water was replaced with fresh water (30 min fresh weight) to account for wounding-related ion leakage from the edges of the leaf discs. Three independent experiments with six biological replicates each were performed and data were analyzed using a t test for each time point. P values were corrected using the Bonferroni method. Data show means ± se; asterisks indicate significant differences from wild-type Col-0 at q < 0.01.
Figure 4.
Figure 4.
Cell Walls of gae6 and gae1 gae6 Plants Are Reduced in GalA. Levels of GalA (A), GlcA (B), cellulose (C), and neutral sugars (D) in AIR extracted from leaves of 4-week-old plants of the indicated genotypes. Bars represent means ± se of four biological replicates combined using a mixed linear model. Letters indicate significantly different groups (P < 0.05).
Figure 5.
Figure 5.
Cell Walls of gae1 gae6 Plants Are Reduced in Homogalacturonan. Dot blot analyses with anti-LM19 and anti-LM20 antibodies. Pectin was extracted from AIR prepared from the indicated genotypes using 1 μL of extraction buffer per 10 µg of AIR. Pectin was serially diluted and 1 μL of undiluted, 1:3 diluted, and 1:9 diluted samples were spotted on a nitrocellulose membrane. Three biological replicates were spotted twice to obtain two technical replicates each. All replicates produced similar results. Relative signal intensities were measured using Image J software. Measurements from the three biological replicates were combined using a linear model after Box-Cox power transformation as described in Methods. Bars represent means ± se. Asterisks indicate a difference from wild-type Col-0 at P < 0.05. (A) Representative dot blot using anti-LM19 antibody. (B) Relative signal intensities of the spots in the dot blot in (A). (C) Representative dot blot using anti-LM20 antibody. (D) Relative signal intensities of the LM20 dot blot shown in (C).
Figure 6.
Figure 6.
Growth of B. cinerea on gae1 gae6 Plants and the Effect of B. cinerea on Expression of GAE1 and GAE6. (A) Growth of B. cinerea isolates. Leaves of Col-0 and gae1 gae6 plants were inoculated with 2.5 × 10⁵ spores mL−1 of the B. cinerea isolates indicated in the figure. Samples were collected two (2 dpi) and three (3 dpi) days later. Bars represent means ± se of six biological replicates for each fungus, combined using a mixed linear model. Asterisks indicate significant differences from wild-type Col-0 for each isolate (P < 0.05). (B) and (C) Expression of GAE1 (B) and GAE6 (C) 48 h after inoculation with the B. cinerea isolates indicated. Expression levels were measured by qRT-PCR. Bars represent mean log2 ratios to ACTIN2 ± se of three biological replicates, combined using a mixed linear model. Letters indicate significantly different groups (q < 0.05).
Figure 7.
Figure 7.
Levels of Soluble Pectin and Expression of PAD3 in Fractions Produced Following Macerozyme Treatment of gae1 gae6 Cell Walls. (A) Schematic overview of the experimental procedure for (B) and (C). (B) Uronic acid measurements. AIR from leave tissue of 4-week-old wild-type Col-0 or gae1 gae6 plants was treated with water or 0.25% macerozyme and assayed for uronic acid levels. Data from 11 biological replicates were combined using a mixed linear model. Bars represent means ± se. Letters indicate significant differences (P < 0.05). (C) Expression of PAD3 in Col-0 plants treated with the fractions from (B). Extracts from (B) were heat inactivated, pooled, and diluted 5-fold with water. Pooled extracts were inoculated into 4-week-old Col-0 plants. PAD3 expression was measured 3 h after inoculation and normalized to the level of ACTIN2 expression. Data from four biological replicates were combined using a mixed linear model. Bars represent mean log2 ratios to ACTIN2 ± se. Letters indicate significant differences (P < 0.05).
Figure 8.
Figure 8.
Macerozyme-Induced PAD3 Expression Is Absent in gae1 gae6. (A) Expression of PAD3 after macerozyme treatment. Four-week-old plants were either inoculated with 0.01% macerozyme or mock inoculated with water, and PAD3 expression was measured 3 h later by qRT-PCR. Data from four biological replicates were combined using a mixed linear model. Mean log2 ratios to ACTIN2 ± se were plotted. Letters indicate significantly different groups (P < 0.05). (B) Expression of PAD3 after OG treatment. PAD3 expression was measured as described in (A) 3 h after inoculation with 100 µg mL−1 OGs or mock inoculation with water. Data are from six biological replicates. (C) PAD3 expression in untreated plants. Three biological replicates were performed and data analyzed as described in (A). (D) Camalexin accumulation after B. cinerea treatment. Camalexin accumulation was measured in 4-week-old plants inoculated with the B. cinerea strains shown in the figure. Eight biological replicates each were combined using a mixed linear model. Asterisks indicate significant differences from wild-type Col-0 for each isolate (P < 0.05). (E) PAD3 expression 28 h after treatment with the indicated B. cinerea strains. Data from six biological replicates were collected and analyzed as described in (A). Data in all figure parts represent means ± se. Letters indicate significantly different groups (q < 0.05).
Figure 9.
Figure 9.
Macerozyme-Induced Expression of the SA Marker Genes SID2 and PR1 Is Abolished in gae1 gae6 Plants. (A) to (H) Expression of PR1 ([A], [C], [E], and [G]) or SID2 ([B], [D], [F], and [H]) in 4-week-old Col-0 and gae1 gae6 plants. Data were combined using a mixed linear model. Bars represent mean log2 ratios of expression versus ACTIN2 ± se for all figure parts. Letters indicate significantly different groups at P < 0.05 for (A) to (D), (G), and (H) and q < 0.05 for (E) and (F). (A) and (B) Plants were treated with 0.01% macerozyme or mock treated with water and samples were collected 3 h later. Data from four biological replicates are shown. (C) and (D) Plants were inoculated with 100 µg mL−1 OGs or mock treated with water and samples collected 3 h later. Data from six biological replicates are shown. (E) and (F) Plants were inoculated with the indicated B. cinerea isolates or mock inoculated with B. cinerea inoculation medium and samples collected 48 h later. Data from eight biological replicates are shown. (G) and (H) Expression in untreated plants. Three biological replicates were performed.
Figure 10.
Figure 10.
The Expression of the JA Marker Gene JAZ10 is Highly Responsive in gae1 gae6 Plants. (A) to (D) JAZ10 expression in 4-week-old plants. Data were combined using a mixed linear model. Mean log2 ratios to ACTIN2 ± se are shown. Letters indicate significantly different groups at P < 0.05 for (A), (B), and (D) and q < 0.05 for (C). (A) Plants were inoculated with 0.01% macerozyme or mock inoculated using water and samples were collected 3 h later. Data from four biological replicates are shown. (B) Plants were inoculated with 100 µg mL−1 OGs or mock inoculated using water and samples collected 3 h later. Data are from six biological replicates. (C) JAZ10 expression 48 h after treatment with the indicated B. cinerea strains. Data are from six biological replicates. (D) JAZ10 expression in untreated plants. Data are from three biological replicates.
Figure 11.
Figure 11.
Gallo 1-Induced Callose Deposition Is Reduced in gae1 gae6 Plants. (A) Callose deposition in 4-week-old Col-0 and gae1 gae6 plants. Plants were inoculated with B. cinerea isolate Gallo 1 (2.5 × 10⁵ spores mL−1) or mock inoculated with B. cinerea inoculation medium, and samples were collected after 72 h. Callose was stained with aniline blue and visualized using a Nikon Eclipse Ni-U microscope with a 4′,6-diamidino-2-phenylindole filter. Three leaves were stained per treatment. Asterisks indicate fungal hyphae, and arrows indicate representative callose spots. Bars = 100 µm. (B) Quantification of callose deposition. Callose deposits were counted in 200 × 200-µm squares laid out across the images shown here. Bars represent means ± se from six squares each. Letters indicate significantly different groups (P < 0.05) according to a t test analysis.
Figure 12.
Figure 12.
Less Soluble Pectin Accumulates in B. cinerea-Infected gae1 gae6 Leaves. Four-week-old Col-0 and gae1 gae6 plants were inoculated with 10-μL droplets of the indicated B. cinerea isolate (2.5 × 10⁵ spores mL−1) or mock inoculated with B. cinerea inoculation medium. Leaves were collected 48 h later. AIR was extracted from leaf samples and water added (20 μL/infection site) to extract soluble pectin fragments. Samples were vortexed for 7 h and centrifuged at 12,000g, and the uronic acid concentration of the supernatant was measured. Data from nine biological replicates were combined using a mixed linear model. Means ± se are shown. Letters indicate significant differences (q < 0.05).
Figure 13.
Figure 13.
Macerozyme-Induced PTI Is Lost in gae1 gae6 While OG-Induced PTI Is Unaltered. (A) Macerozyme-induced PTI in Col-0 and gae1 gae6 plants. Four-week-old plants were inoculated with 0.01% macerozyme or mock inoculated with boiled macerozyme and were infected with B. cinerea isolate Gallo 1 (2.5 × 10⁵ spores mL−1) 24 h later. Samples were collected immediately (0 dpi) and after two (2 dpi) and three (3 dpi) days. Data show mean ± se of six to 14 biological replicates each combined using a linear model. Letters indicate significantly different groups (q < 0.05). (B) OG-induced PTI in Col-0 and gae1 gae6 plants. Four-week-old plants were inoculated with 500 µg mL−1 OGs and infected with B. cinerea as described in (A). Six to eight biological experiments were performed. (C) and (D) Expression of JAZ5 (C) and JAZ10 (D) was measured in untreated plants or 24 h after inoculation with water (mock), 0.01% macerozyme, or 250 µg mL−1 OGs. Data show mean log2 ratios to ACTIN2 ± se from three biological replicates combined using a mixed linear model. Letters indicate significantly different groups (q < 0.05). The q-value for comparison of JAZ10 expression in the wild type and mutant after macerozyme treatment is 0.056.

Similar articles

Cited by

References

    1. Adam L., Somerville S.C. (1996). Genetic characterization of five powdery mildew disease resistance loci in Arabidopsis thaliana. Plant J. 9: 341–356. - PubMed
    1. Albersheim P., Jones T.M., English P.D. (1969). Biochemistry of the cell wall in relation to infective processes. Annu. Rev. Phytopathol. 7: 171–194. - PubMed
    1. Alonso J.M., et al. (2003). Genome-wide insertional mutagenesis of Arabidopsis thaliana. Science 301: 653–657. - PubMed
    1. Asai T., Tena G., Plotnikova J., Willmann M.R., Chiu W.L., Gomez-Gomez L., Boller T., Ausubel F.M., Sheen J. (2002). MAP kinase signalling cascade in Arabidopsis innate immunity. Nature 415: 977–983. - PubMed
    1. Bartsch M., Gobbato E., Bednarek P., Debey S., Schultze J.L., Bautor J., Parker J.E. (2006). Salicylic acid-independent ENHANCED DISEASE SUSCEPTIBILITY1 signaling in Arabidopsis immunity and cell death is regulated by the monooxygenase FMO1 and the Nudix hydrolase NUDT7. Plant Cell 18: 1038–1051. - PMC - PubMed

Publication types

MeSH terms