

Protein-Specific Differential Glycosylation of Immunoglobulins in Serum of Ovarian Cancer Patients
- PMID: 26813784
- PMCID: PMC5637400
- DOI: 10.1021/acs.jproteome.5b01071
Protein-Specific Differential Glycosylation of Immunoglobulins in Serum of Ovarian Cancer Patients
Abstract
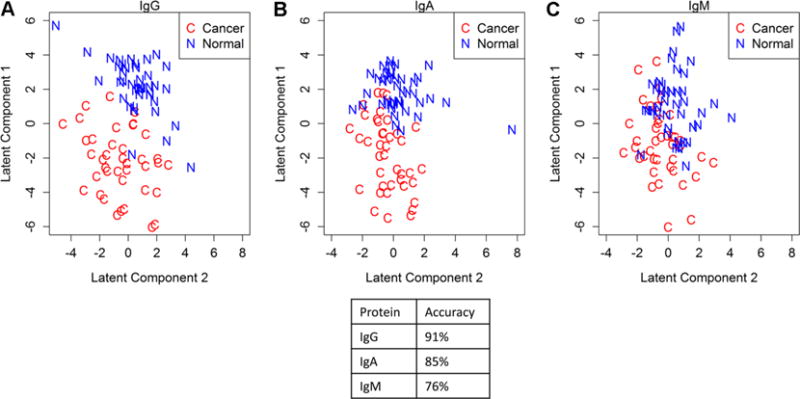
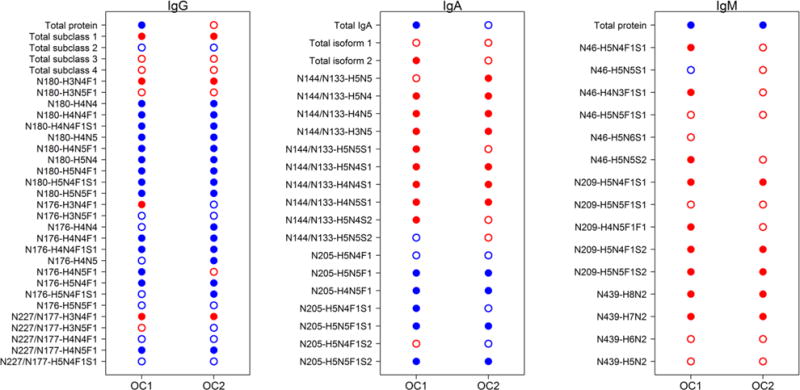
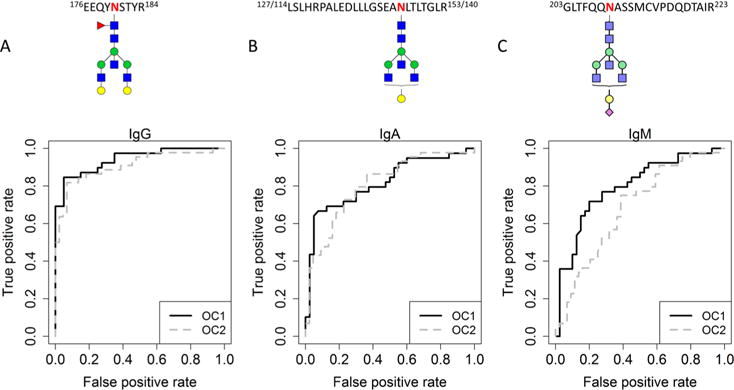
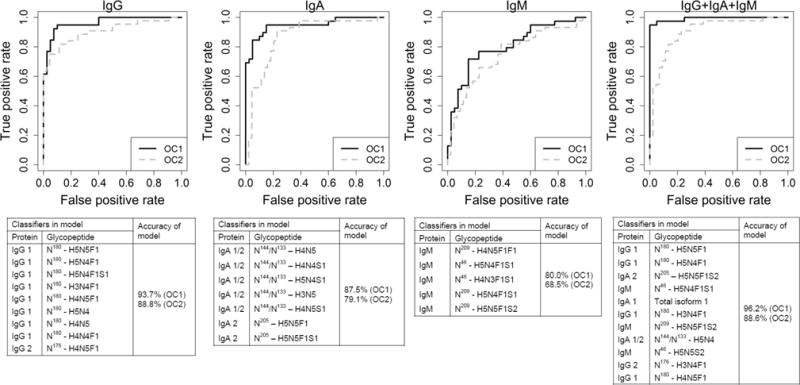
Previous studies indicated that glycans in serum may serve as biomarkers for diagnosis of ovarian cancer; however, it was unclear to which proteins these glycans belong. We hypothesize that protein-specific glycosylation profiles of the glycans may be more informative of ovarian cancer and can provide insight into biological mechanisms underlying glycan aberration in serum of diseased individuals. Serum samples from women diagnosed with epithelial ovarian cancer (EOC, n = 84) and matched healthy controls (n = 84) were obtained from the Gynecologic Oncology Group. Immunoglobulin (IgG, IgA, and IgM) concentrations and glycosylation profiles were quantified using multiple reaction monitoring mass spectrometry. Differential and classification analyses were performed to identify aberrant protein-specific glycopeptides using a training set. All findings were validated in an independent test set. Multiple glycopeptides from immunoglubins IgA, IgG, and IgM were found to be differentially expressed in serum of EOC patients compared with controls. The protein-specific glycosylation profiles showed their potential in the diagnosis of EOC. In particular, IgG-specific glycosylation profiles are the most powerful in discriminating between EOC case and controls. Additional studies of protein- and site-specific glycosylation profiles of immunoglobulins and other proteins will allow further elaboration on the characteristics of biological functionality and causality of the differential glycosylation in ovarian cancer and thus ultimately lead to increased sensitivity and specificity of diagnosis.
Keywords: N-glycosylation; biomarker; immunoglobulin; ovarian cancer; serum.
Conflict of interest statement
The authors declare no competing financial interest.
Figures
Similar articles
-
Serum glycome profiling: a biomarker for diagnosis of ovarian cancer.J Proteome Res. 2013 Sep 6;12(9):4056-63. doi: 10.1021/pr400405x. Epub 2013 Jul 29. J Proteome Res. 2013. PMID: 23889230
-
Evaluation of glycomic profiling as a diagnostic biomarker for epithelial ovarian cancer.Cancer Epidemiol Biomarkers Prev. 2014 Apr;23(4):611-21. doi: 10.1158/1055-9965.EPI-13-1073. Epub 2014 Feb 20. Cancer Epidemiol Biomarkers Prev. 2014. PMID: 24557531 Free PMC article.
-
Diagnosing and staging epithelial ovarian cancer by serum glycoproteomic profiling.Br J Cancer. 2024 Jun;130(10):1716-1724. doi: 10.1038/s41416-024-02644-4. Epub 2024 Apr 24. Br J Cancer. 2024. PMID: 38658783 Free PMC article.
-
Advancements in protein glycosylation biomarkers for ovarian cancer through mass spectrometry-based approaches.Expert Rev Mol Diagn. 2024 Apr;24(4):249-258. doi: 10.1080/14737159.2023.2297933. Epub 2023 Dec 25. Expert Rev Mol Diagn. 2024. PMID: 38112537 Review.
-
The Role of Lectin as Potential Biomarker in Ovarian Cancer.Curr Pharm Biotechnol. 2022;23(4):478-485. doi: 10.2174/1389201022666210625125506. Curr Pharm Biotechnol. 2022. PMID: 34176460 Review.
Cited by
-
Recent Advances in the Mass Spectrometry Methods for Glycomics and Cancer.Anal Chem. 2018 Jan 2;90(1):208-224. doi: 10.1021/acs.analchem.7b04202. Epub 2017 Oct 31. Anal Chem. 2018. PMID: 29049885 Free PMC article. Review.
-
Serum IgA1 shows increased levels of α2,6-linked sialic acid in breast cancer.Interface Focus. 2019 Apr 6;9(2):20180079. doi: 10.1098/rsfs.2018.0079. Epub 2019 Feb 15. Interface Focus. 2019. PMID: 30842877 Free PMC article.
-
Monitoring of immunoglobulin N- and O-glycosylation in health and disease.Glycobiology. 2020 Mar 20;30(4):226-240. doi: 10.1093/glycob/cwz048. Glycobiology. 2020. PMID: 31281930 Free PMC article. Review.
-
Sensitive and fast characterization of site-specific protein glycosylation with capillary electrophoresis coupled to mass spectrometry.Talanta. 2018 Mar 1;179:22-27. doi: 10.1016/j.talanta.2017.10.015. Epub 2017 Oct 31. Talanta. 2018. PMID: 29310225 Free PMC article.
-
Recent Developments and Application of Mass Spectrometry Imaging in N-Glycosylation Studies: An Overview.Mass Spectrom (Tokyo). 2024;13(1):A0142. doi: 10.5702/massspectrometry.A0142. Epub 2024 Feb 27. Mass Spectrom (Tokyo). 2024. PMID: 38435075 Free PMC article. Review.
References
-
- Siegel R, Naishadham D, Jemal A. Cancer statistics, 2012. Ca-Cancer J Clin. 2012;62(1):10–29. - PubMed
-
- Goodman MT, Howe HL, Tung KH, Hotes J, Miller BA, Coughlin SS, Chen VW. Incidence of ovarian cancer by race and ethnicity in the United States, 1992–1997. Cancer. 2003;97(10 Suppl):2676–85. - PubMed
-
- Moore RG, Jabre-Raughley M, Brown AK, Robison KM, Miller MC, Allard WJ, Kurman RJ, Bast RC, Skates SJ. Comparison of a novel multiple marker assay vs the Risk of Malignancy Index for the prediction of epithelial ovarian cancer in patients with a pelvic mass. Am J Obstet Gynecol. 2010;203(3):228 e1–6. - PMC - PubMed
-
- Arnold JN, Saldova R, Galligan MC, Murphy TB, Mimura-Kimura Y, Telford JE, Godwin AK, Rudd PM. Novel glycan biomarkers for the detection of lung cancer. J Proteome Res. 2011;10(4):1755–64. - PubMed
Publication types
MeSH terms
Substances
Grants and funding
LinkOut - more resources
Full Text Sources
Other Literature Sources
Medical
Miscellaneous
