. 2016 Mar;170(3):1655-74.
doi: 10.1104/pp.15.01624. Epub 2016 Jan 26.

Combined Chlorophyll Fluorescence and Transcriptomic Analysis Identifies the P3/P4 Transition as a Key Stage in Rice Leaf Photosynthetic Development

Affiliations

Combined Chlorophyll Fluorescence and Transcriptomic Analysis Identifies the P3/P4 Transition as a Key Stage in Rice Leaf Photosynthetic Development

Julia C van Campen et al. Plant Physiol. 2016 Mar.

Abstract

Leaves are derived from heterotrophic meristem tissue that, at some point, must make the transition to autotrophy via the initiation of photosynthesis. However, the timing and spatial coordination of the molecular and cellular processes underpinning this switch are poorly characterized. Here, we report on the identification of a specific stage in rice (Oryza sativa) leaf development (P3/P4 transition) when photosynthetic competence is first established. Using a combined physiological and molecular approach, we show that elements of stomatal and vascular differentiation are coordinated with the onset of measurable light absorption for photosynthesis. Moreover, by exploring the response of the system to environmental perturbation, we show that the earliest stages of rice leaf development have significant plasticity with respect to elements of cellular differentiation of relevance for mature leaf photosynthetic performance. Finally, by performing an RNA sequencing analysis targeted at the early stages of rice leaf development, we uncover a palette of genes whose expression likely underpins the acquisition of photosynthetic capability. Our results identify the P3/P4 transition as a highly dynamic stage in rice leaf development when several processes for the initiation of photosynthetic competence are coordinated. As well as identifying gene targets for future manipulation of rice leaf structure/function, our data highlight a developmental window during which such manipulations are likely to be most effective.


Figures

Figure 1.
Figure 1.
Analysis of leaf growth. A, Leaf blade elongation over time for the first five leaves of IR64 rice. Error bars show sd (n = 10). B, Dissected apices to reveal leaf primordia at P1 (greater magnification in inset), P2, P3, and P4-1 (less than 1 cm) stages. Bars = 0.25 mm (P1, P2, and P3) and 1 mm (P4-1). C, Plastochron index showing the relationship between the length of leaf 3 and developmental stage (P1, P2, P3, and P4) of leaf 5 (n = 7). D, Leaf primordia at stages P3, P4-2 (less than 2 cm), P4-12 (less than 12 cm), P5, and P6 stages. Bar = 1 cm.
Figure 2.
Figure 2.
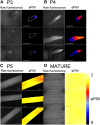
Chlorophyll fluorescence and photosynthetic efficiency during early leaf development. Raw chlorophyll fluorescence (left images) and φPSII (right images) are show at 50 µmol m−2 s−1 in P3 (A), P4 (B), P5 (C), and mature (D) leaves. Images are shown for three biological replicates for each leaf stage. φPSII value is indicated by the scale adjacent to D. Bars = 0.25 mm.
Figure 3.
Figure 3.
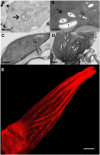
Plastid differentiation during early leaf development. A to D, Transmission electron micrographs of plastids in leaves at P3 stage (A), P4 stage (B), P5 stage (C), and mature leaves (D). E, Chlorophyll autofluorescence in a P4 stage leaf. G, Stacked grana. Asterisks indicate starch grains, and arrows indicate plastids. The locations that sections were taken from are shown in Supplemental Figure S1C. Bars = 0.5 µm (A–C), 1 µm (D), and 100 µm (E).
Figure 4.
Figure 4.
Induction kinetics of photosynthesis during early leaf development. A to D, Induction of φPSII at 50 µmol m−2 s−1 in different regions of P3 stage (A) and P4 stage (B) leaves and at 200 µmol m−2 s−1 in P5 stage (C) and mature (D) leaves. E to H, Light response of φPSII in different regions of P3 stage (E), P4 stage (F), P5 stage (G), and mature (H) leaves. Images are shown for three biological replicates for each leaf stage. Regions of measurement, from tip to base, are indicated by the color legend adjacent to E. PAR, Photosynthetically active radiation.
Figure 5.
Figure 5.
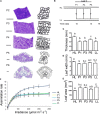
Leaf morphogenesis in response to altered irradiance during early leaf development. A, Vein differentiation in primordia at P2, P3, P4, and P5 stages and at maturity. The locations that sections were taken from are shown in Supplemental Figure S1C. Bars = 0.05 mm. B, Schematic of irradiance transfer experiments. Plants grown under HL conditions were either maintained under HL conditions or transferred to LL conditions when leaf 5 had achieved specific developmental stages (P1, P3, and P5), then maintained under LL conditions until analysis. C to E, Measurements of thickness (C), width (D), and area (E) in leaves grown under HL conditions and transferred to LL conditions at P1, P3, or P5 stage of leaf 5 development. Error bars show se (n = 7). Different letters indicate statistically significant differences (Tukey’s honestly significant difference test, P < 0.05). F, Light response curves for assimilation rates in leaf 5 of plants as described in B. Error bars show sd (n ≥ 4).
Figure 6.
Figure 6.
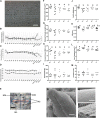
Stomatal size and density after leaf transfer between different irradiances. A, Epidermis showing an interveinal gap (IVG) with cell files containing stomatal complexes. Bar = 30 µm. B to D, Measurements of stomatal density (SD; B), interveinal distance (IVD; C), and stomatal complex area (SCA; D) in IVGs (IG) across mature rice leaves grown under HL (solid lines) and LL (broken lines) conditions. Under LL conditions, more IVGs were generated, leading to the observation of IG17 and IG18 in a few LL leaves (number indicated by value n). Error bars indicate se; n = 5 except where indicated. E, Individual stomatal complex indicating the supporting cells (SC) and the dimensions taken for SCA, stomatal complex length (SCL), and stomatal complex width (SCW). Bar = 5 µm. F to M, Measurements of SCA (F), SCL (G), SCW (H), SD (I), cell file width (CFW; J), IVD (K), vein frequency (L), and cell file number (CFN; M) in leaves either grown continually under HL or LL conditions or transferred from HL to LL conditions at P1, P3, or P5 stage. Where appropriate, identical letters in a graph indicate samples that could not be distinguished from each other by statistical analysis (see text). N to P, Scanning electron microscopy images of a P3 primordium (N), a higher magnification of the surface of a P3 primordium (no stomatal complexes visible; O), and a mature stomatal complex in a P4 primordium (P). Bars = 30 µm (N and O) and 10 µm (P).
Figure 7.
Figure 7.
Key changes in gene expression during early rice leaf development. A, Leaf developmental stages used for RNAseq analysis and their positions on the plant (not to scale; colors added for clarity). B, Key functional terms up-regulated and down-regulated during development and selected genes reaching their maximum expression levels at P3, P4, or P5 stage. Where a gene name is shown twice, rice has two orthologs of the Arabidopsis gene of interest. See also Supplemental Tables S2 to S7 and Supplemental Figure S7.

References

    1. Amiour N, Imbaud S, Clément G, Agier N, Zivy M, Valot B, Balliau T, Armengaud P, Quilleré I, Cañas R, et al. (2012) The use of metabolomics integrated with transcriptomic and proteomic studies for identifying key steps involved in the control of nitrogen metabolism in crops such as maize. J Exp Bot 63: 5017–5033 - PubMed
    1. Anders S, Huber W (2010) Differential expression analysis for sequence count data. Genome Biology, 11: R106. - PMC - PubMed
    1. Andriankaja M, Dhondt S, De Bodt S, Vanhaeren H, Coppens F, De Milde L, Mühlenbock P, Skirycz A, Gonzalez N, Beemster GTS, et al. (2012) Exit from proliferation during leaf development in Arabidopsis thaliana: a not-so-gradual process. Dev Cell 22: 64–78 - PubMed
    1. Arvidsson S, Kwasniewski M, Riano-Pachon DM, Mueller-Roeber B (2008) QuantPrime – a flexible tool for reliable high-throughput primer design for quantitative PCR. BMC Bioinformatics, 9: DOI: 10.1186/1471-2105-9-465 - DOI - PMC - PubMed
    1. Aubry S, Kelly S, Kuempers BMC, Smith-Unna RD, Hibberd JM (2014) Deep evolutionary comparison of gene expression identifies parallel recruitment of trans-factors in two independent origins of C-4 photosynthesis. PLoS Genetics 10: e1004365. - PMC - PubMed

Publication types

MeSH terms

LinkOut - more resources