

NF-κB promotes leaky expression of adenovirus genes in a replication-incompetent adenovirus vector
- PMID: 26814140
- PMCID: PMC4728692
- DOI: 10.1038/srep19922
NF-κB promotes leaky expression of adenovirus genes in a replication-incompetent adenovirus vector
Abstract
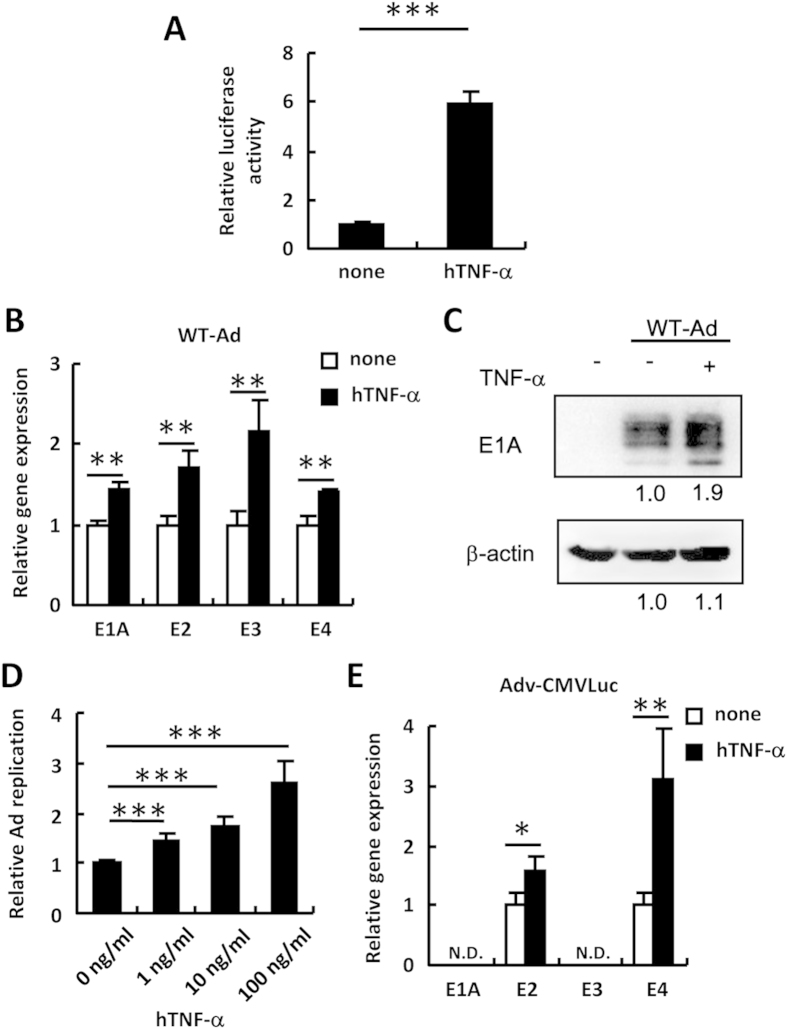
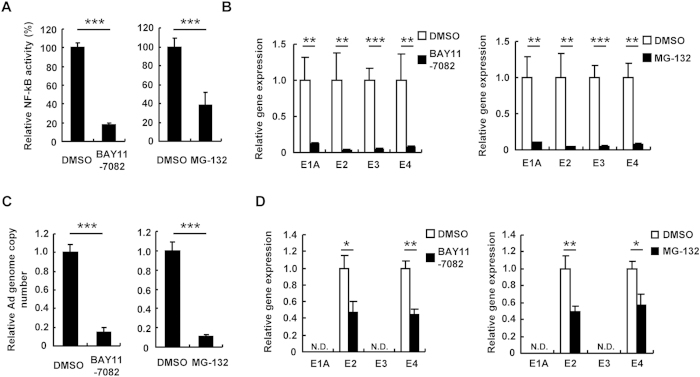
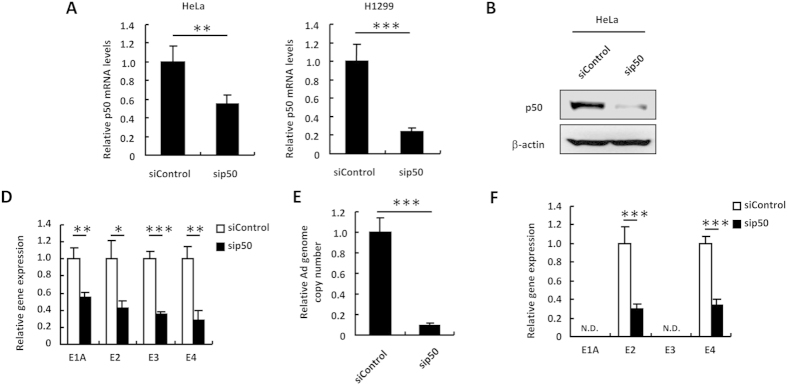
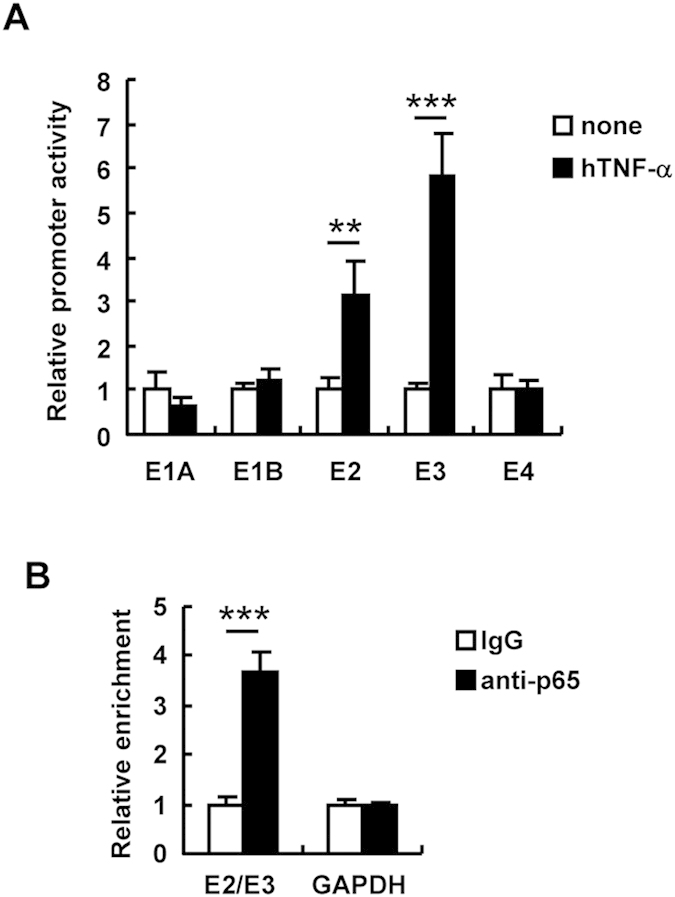
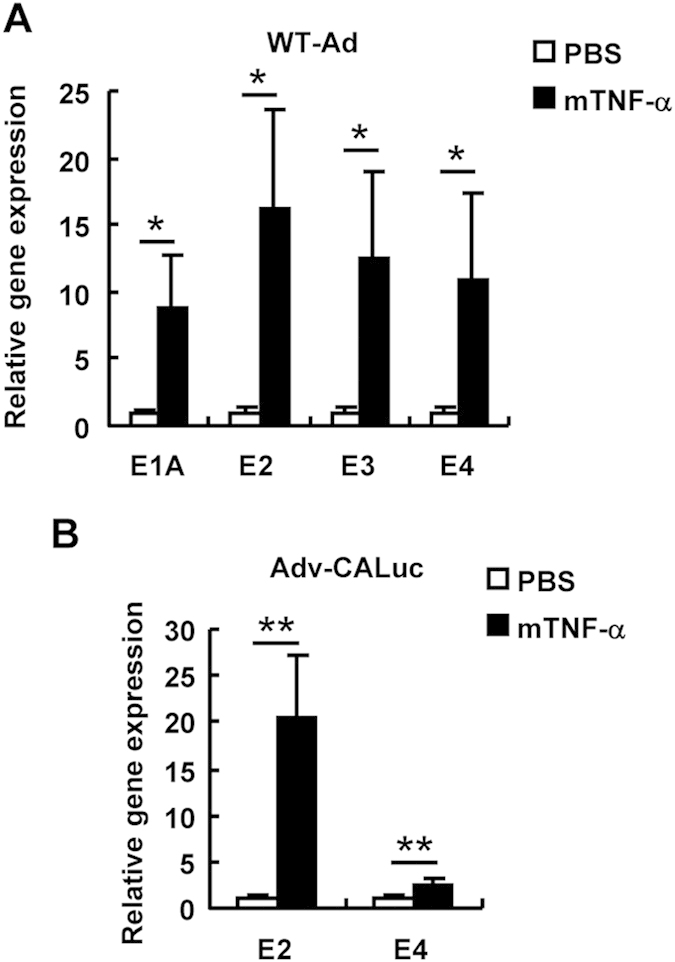
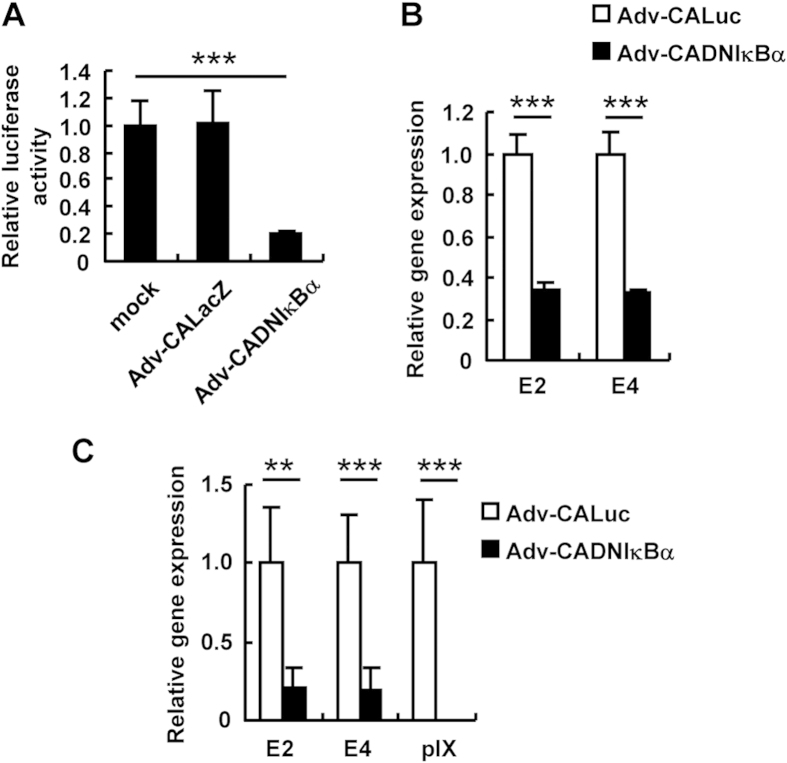
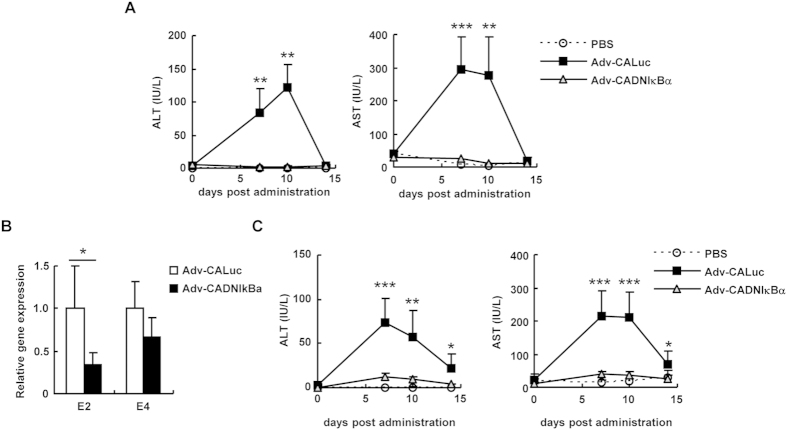
The replication-incompetent adenovirus (Ad) vector is one of the most promising vectors for gene therapy; however, systemic administration of Ad vectors results in severe hepatotoxicities, partly due to the leaky expression of Ad genes in the liver. Here we show that nuclear factor-kappa B (NF-κB) mediates the leaky expression of Ad genes from the Ad vector genome, and that the inhibition of NF-κB leads to the suppression of Ad gene expression and hepatotoxicities following transduction with Ad vectors. Activation of NF-κB by recombinant tumor necrosis factor (TNF)-α significantly enhanced the leaky expression of Ad genes. More than 50% suppression of the Ad gene expression was found by inhibitors of NF-κB signaling and siRNA-mediated knockdown of NF-κB. Similar results were found when cells were infected with wild-type Ad. Compared with a conventional Ad vector, an Ad vector expressing a dominant-negative IκBα (Adv-CADNIκBα), which is a negative regulator of NF-κB, mediated approximately 70% suppression of the leaky expression of Ad genes in the liver. Adv-CADNIκBα did not induce apparent hepatotoxicities. These results indicate that inhibition of NF-κB leads to suppression of Ad vector-mediated tissue damages via not only suppression of inflammatory responses but also reduction in the leaky expression of Ad genes.
Conflict of interest statement
The authors declare no competing financial interests.
Figures
Similar articles
-
[Development of a novel adenovirus vector exhibiting microRNA-mediated suppression of the leaky expression of adenovirus genes].Yakugaku Zasshi. 2012;132(12):1407-12. doi: 10.1248/yakushi.12-00235-5. Yakugaku Zasshi. 2012. PMID: 23208048 Review. Japanese.
-
Inhibition of NF-kappaB activation in combination with bcl-2 expression allows for persistence of first-generation adenovirus vectors in the mouse liver.J Virol. 1998 Nov;72(11):9267-77. doi: 10.1128/JVI.72.11.9267-9277.1998. J Virol. 1998. PMID: 9765474 Free PMC article.
-
[Construction of recombinant deltaN IkappaBalpha adenovirus and its suppression of NF-kappaB activity in A549 cells].Xi Bao Yu Fen Zi Mian Yi Xue Za Zhi. 2005 Mar;21(2):171-4. Xi Bao Yu Fen Zi Mian Yi Xue Za Zhi. 2005. PMID: 15766401 Chinese.
-
Adenovirus vector-induced expression of the C-X-C chemokine IP-10 is mediated through capsid-dependent activation of NF-kappaB.J Virol. 2000 May;74(9):3941-7. doi: 10.1128/jvi.74.9.3941-3947.2000. J Virol. 2000. PMID: 10756005 Free PMC article.
-
[Development and Characterization of a Novel Adenovirus Vector Exhibiting MicroRNA-mediated Suppression of the Leaky Expression of Adenovirus Genes].Yakugaku Zasshi. 2015;135(12):1349-56. doi: 10.1248/yakushi.15-00190. Yakugaku Zasshi. 2015. PMID: 26632150 Review. Japanese.
Cited by
-
Type I Interferons Impede Short Hairpin RNA-Mediated RNAi via Inhibition of Dicer-Mediated Processing to Small Interfering RNA.Mol Ther Nucleic Acids. 2017 Mar 17;6:173-182. doi: 10.1016/j.omtn.2016.12.007. Epub 2016 Dec 31. Mol Ther Nucleic Acids. 2017. PMID: 28325284 Free PMC article.
-
Adenovirus E1B-55K interferes with cellular IκB kinase complex subunit proteins.Front Immunol. 2025 Mar 4;16:1532742. doi: 10.3389/fimmu.2025.1532742. eCollection 2025. Front Immunol. 2025. PMID: 40103806 Free PMC article.
-
Coagulopathies after Vaccination against SARS-CoV-2 May Be Derived from a Combined Effect of SARS-CoV-2 Spike Protein and Adenovirus Vector-Triggered Signaling Pathways.Int J Mol Sci. 2021 Oct 6;22(19):10791. doi: 10.3390/ijms221910791. Int J Mol Sci. 2021. PMID: 34639132 Free PMC article. Review.
-
Dicer functions as an antiviral system against human adenoviruses via cleavage of adenovirus-encoded noncoding RNA.Sci Rep. 2016 Jun 7;6:27598. doi: 10.1038/srep27598. Sci Rep. 2016. PMID: 27273616 Free PMC article.
-
rAAV capsid mutants eliminate leaky expression from DNA donor template for homologous recombination.Nucleic Acids Res. 2024 Jun 24;52(11):6518-6531. doi: 10.1093/nar/gkae401. Nucleic Acids Res. 2024. PMID: 38783157 Free PMC article.
References
-
- Volpers C. & Kochanek S. Adenoviral vectors for gene transfer and therapy. J Gene Med 6, S164–171 (2004). - PubMed
-
- McConnell M. J. & Imperiale M. J. Biology of adenovirus and its use as a vector for gene therapy. Hum Gene Ther 15, 1022–1033 (2004). - PubMed
-
- Shimizu K., Sakurai F., Machitani M., Katayama K. & Mizuguchi H. Quantitative analysis of the leaky expression of adenovirus genes in cells transduced with a replication-incompetent adenovirus vector. Mol Pharm 8, 1430–1435 (2011). - PubMed
Publication types
MeSH terms
Substances
LinkOut - more resources
Full Text Sources
Other Literature Sources
Research Materials
