Human Lineage-Specific Transcriptional Regulation through GA-Binding Protein Transcription Factor Alpha (GABPa)
- PMID: 26814189
- PMCID: PMC4839217
- DOI: 10.1093/molbev/msw007
Human Lineage-Specific Transcriptional Regulation through GA-Binding Protein Transcription Factor Alpha (GABPa)
Abstract
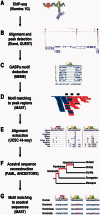
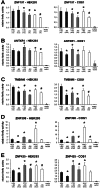
A substantial fraction of phenotypic differences between closely related species are likely caused by differences in gene regulation. While this has already been postulated over 30 years ago, only few examples of evolutionary changes in gene regulation have been verified. Here, we identified and investigated binding sites of the transcription factor GA-binding protein alpha (GABPa) aiming to discover cis-regulatory adaptations on the human lineage. By performing chromatin immunoprecipitation-sequencing experiments in a human cell line, we found 11,619 putative GABPa binding sites. Through sequence comparisons of the human GABPa binding regions with orthologous sequences from 34 mammals, we identified substitutions that have resulted in 224 putative human-specific GABPa binding sites. To experimentally assess the transcriptional impact of those substitutions, we selected four promoters for promoter-reporter gene assays using human and African green monkey cells. We compared the activities of wild-type promoters to mutated forms, where we have introduced one or more substitutions to mimic the ancestral state devoid of the GABPa consensus binding sequence. Similarly, we introduced the human-specific substitutions into chimpanzee and macaque promoter backgrounds. Our results demonstrate that the identified substitutions are functional, both in human and nonhuman promoters. In addition, we performed GABPa knock-down experiments and found 1,215 genes as strong candidates for primary targets. Further analyses of our data sets link GABPa to cognitive disorders, diabetes, KRAB zinc finger (KRAB-ZNF), and human-specific genes. Thus, we propose that differences in GABPa binding sites played important roles in the evolution of human-specific phenotypes.
Keywords: ChIP-Seq; GABP; KRAB zinc finger genes; comparative genomics.; human molecular evolution; human-specific binding sites; promoter assay.
© The Author 2016. Published by Oxford University Press on behalf of the Society for Molecular Biology and Evolution.
Figures


Similar articles
-
Expression of the human TIMM23 and TIMM23B genes is regulated by the GABP transcription factor.Biochim Biophys Acta Gene Regul Mech. 2018 Feb;1861(2):80-94. doi: 10.1016/j.bbagrm.2018.01.006. Epub 2018 Feb 3. Biochim Biophys Acta Gene Regul Mech. 2018. PMID: 29413900
-
Identification of functional elements in the murine Gabp alpha/ATP synthase coupling factor 6 bi-directional promoter.Gene. 2006 Mar 15;369:35-44. doi: 10.1016/j.gene.2005.10.009. Epub 2005 Nov 23. Gene. 2006. PMID: 16309857
-
Preferred binding of gain-of-function mutant p53 to bidirectional promoters with coordinated binding of ETS1 and GABPA to multiple binding sites.Oncotarget. 2014 Jan 30;5(2):417-27. doi: 10.18632/oncotarget.1708. Oncotarget. 2014. PMID: 24481480 Free PMC article.
-
TERT promoter mutations and GABP transcription factors in carcinogenesis: More foes than friends.Cancer Lett. 2020 Nov 28;493:1-9. doi: 10.1016/j.canlet.2020.07.003. Epub 2020 Aug 6. Cancer Lett. 2020. PMID: 32768523 Review.
-
Tinkering with transcription factor proteins: the role of transcription factor adaptation in developmental evolution.Novartis Found Symp. 2007;284:116-25; discussion 125-9, 158-63. doi: 10.1002/9780470319390.ch8. Novartis Found Symp. 2007. PMID: 17710850 Review.
Cited by
-
MethReg: estimating the regulatory potential of DNA methylation in gene transcription.Nucleic Acids Res. 2022 May 20;50(9):e51. doi: 10.1093/nar/gkac030. Nucleic Acids Res. 2022. PMID: 35100398 Free PMC article.
-
Genome-wide association study of a semicontinuous trait: illustration of the impact of the modeling strategy through the study of Neutrophil Extracellular Traps levels.NAR Genom Bioinform. 2023 Jun 28;5(2):lqad062. doi: 10.1093/nargab/lqad062. eCollection 2023 Jun. NAR Genom Bioinform. 2023. PMID: 37388819 Free PMC article.
-
Single-Cell Analysis of Alternative Splicing and Gene Regulatory Network Reveals Remarkable Expression and Regulation Dynamics During Human Early Embryonic Development.FASEB Bioadv. 2025 Jul 9;7(7):e70036. doi: 10.1096/fba.2025-00075. eCollection 2025 Jul. FASEB Bioadv. 2025. PMID: 40641848 Free PMC article.
-
Multiomics from Alzheimer's Brains and Mesenchymal Stem Cell-Derived Extracellular Vesicles Identifies Therapeutic Potential of Specific Subpopulations to Target Mitochondrial Proteostasis.J Cent Nerv Syst Dis. 2025 Apr 23;17:11795735251336302. doi: 10.1177/11795735251336302. eCollection 2025. J Cent Nerv Syst Dis. 2025. PMID: 40297324 Free PMC article.
-
Epigenetics of the far northern Yakutian population.Clin Epigenetics. 2023 Dec 6;15(1):189. doi: 10.1186/s13148-023-01600-y. Clin Epigenetics. 2023. PMID: 38053163 Free PMC article.
References
-
- Batchelor AH, Piper DE, de la Brousse FC, McKnight SL, Wolberger C. 1998. The structure of GABPalpha/beta: an ETS domain- ankyrin repeat heterodimer bound to DNA. Science 279:1037. - PubMed
-
- Bauer-Mehren A, Rautschka M, Sanz F, Furlong LI. 2010. DisGeNET: a cytoscape plugin to visualize, integrate, search and analyze gene-disease networks. Bioinformatics 26:2924–2926. - PubMed
MeSH terms
Substances
LinkOut - more resources
Full Text Sources
Other Literature Sources

