Review
. 2016 Mar;85(2):371-84.
doi: 10.1111/1365-2656.12482. Epub 2016 Jan 27.

COMADRE: a global data base of animal demography

Affiliations
Review

COMADRE: a global data base of animal demography

Roberto Salguero-Gómez et al. J Anim Ecol. 2016 Mar.

Abstract

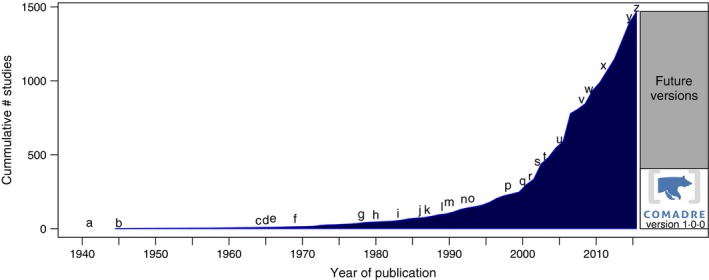
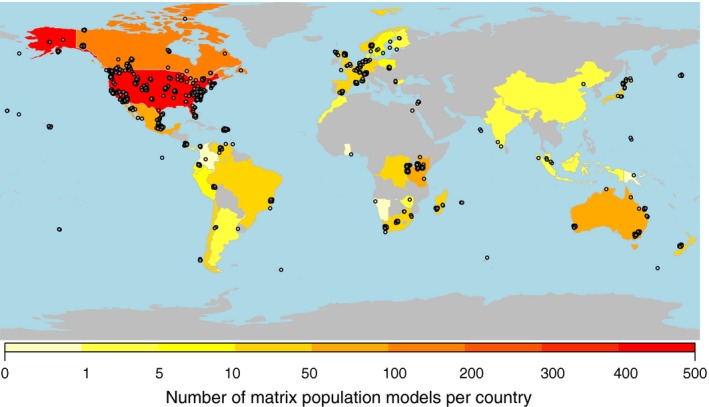
The open-data scientific philosophy is being widely adopted and proving to promote considerable progress in ecology and evolution. Open-data global data bases now exist on animal migration, species distribution, conservation status, etc. However, a gap exists for data on population dynamics spanning the rich diversity of the animal kingdom world-wide. This information is fundamental to our understanding of the conditions that have shaped variation in animal life histories and their relationships with the environment, as well as the determinants of invasion and extinction. Matrix population models (MPMs) are among the most widely used demographic tools by animal ecologists. MPMs project population dynamics based on the reproduction, survival and development of individuals in a population over their life cycle. The outputs from MPMs have direct biological interpretations, facilitating comparisons among animal species as different as Caenorhabditis elegans, Loxodonta africana and Homo sapiens. Thousands of animal demographic records exist in the form of MPMs, but they are dispersed throughout the literature, rendering comparative analyses difficult. Here, we introduce the COMADRE Animal Matrix Database, an open-data online repository, which in its version 1.0.0 contains data on 345 species world-wide, from 402 studies with a total of 1625 population projection matrices. COMADRE also contains ancillary information (e.g. ecoregion, taxonomy, biogeography, etc.) that facilitates interpretation of the numerous demographic metrics that can be derived from its MPMs. We provide R code to some of these examples.

Synthesis: We introduce the COMADRE Animal Matrix Database, a resource for animal demography. Its open-data nature, together with its ancillary information, will facilitate comparative analysis, as will the growing availability of databases focusing on other aspects of the rich animal diversity, and tools to query and combine them. Through future frequent updates of COMADRE, and its integration with other online resources, we encourage animal ecologists to tackle global ecological and evolutionary questions with unprecedented sample size.

Keywords: animal population ecology; comparative approach; matrix population model; open-data; population growth rate (λ).


Figures

Figure 1
Figure 1
The cumulative number of studies published prior to 27.07.2015 containing animal matrix population models (MPMs). The right bar represents the total number of studies, including the number released in COMADRE version 1.0.0. Important events in the development of animal MPMs: the first (a, b) applications of matrix population models in demography (Bernardelli 1941; Leslie 1945), (c) and to humans (Keyfitz 1964), (d) introduction of theory for stage‐classified MPMs (Lefkovitch 1965), (e) first spatial MPM (Rogers 1966), (f) nonlinear, density‐dependent MPMs for animals (Pennycuick 1969; Rabinovich 1969), (g) sensitivity analysis for stage‐classified MPMs and calculation of selection gradients for animals (Caswell 1978), (h) bifurcation analysis of density‐dependent MPMs in animals (Levin & Goodyear 1980), (i) calculation of the stochastic growth rate from an animal MPM (Cohen, Christensen & Goodyear 1983), (j) formalization of elasticity analyses for MPMs (de Kroon et al. 1986), (k) application of elasticity analysis to conservation biology (Crouse, Crowder & Caswell 1987) and Life Table Response Experiment analysis (Levin 1987), (l) Matrix Population Models: Construction, Analysis and Interpretation edition 1 (Caswell 1989), (m) Population Dynamics in Variable Environments (Tuljapurkar 1990), (n) presentation of multistate mark–recapture methods for estimating stage‐structured MPMs in animals (Nichols et al. 1992), (o) development of MPM from photograph identification data (Brault & Caswell 1993), (p) an early study detailing uncertainty in MPMs (Caswell et al. 1998), (q) special feature on MPMs (Heppell, Pfister & de Kroon 2000), (r) Matrix Population Models 2nd edition (Caswell 2001), (s) publication of Quantitative Conservation Biology: Theory and Practice of Population Viability Analysis (Morris & Doak 2002) (t) first application of matrix integrodifference equations to examine animal invasion speeds (Caswell, Lensink & Neubert 2003), (u) first investigation of non‐equilibrium properties for MPMs (Caswell & Neubert 2005), (v) complete perturbation analysis for nonlinear animal MPMs (Caswell 2008), (w) introduction of individual stochasticity analyses for animal MPMs (Caswell 2009; Tuljapurkar, Steiner & Orzack 2009), (x) COMADRE established at the Max Planck Institute for Demographic Research, (y) COMPADRE Plant Population Database 3.0.0 released and (z) COMADRE Animal Matrix Database 1.0.0 released online in www.comadre-db.org.
Figure 2
Figure 2
Geographic representation of animal demographic studies in COMADRE 1.0.0. The points represent study sites for which GPS coordinates are available; these have been jittered to highlight temporal replication within the same site, and close spatial overlap of certain studies. Countries with redder colour contain more matrix population models.
Figure 3
Figure 3
Most of the studies in COMADRE examine only one population per species (a; see NumberPopulations in Table 1), although they can achieve remarkable durations (in years) (b; StudyDuration). Most of the matrices in the data base detail annual population dynamics (c; Periodicity), with few (2–6) life cycle stages (d; MatrixPeriodicity) and these tend to be based on age and or ontogeny (e; MatrixCriteriaSize, MatrixCriteriaOntogeny & MatrixCriteriaAge). Panel A's x‐axis is broken between 27 and 156 populations/study.

References

    1. Adler, P.B. , Salguero‐Gómez, R. , Compagnoni, A. , Hsu, J.S. , Ray‐Mukherjee, J. , Mbeau‐Ache, C. et al (2014) Functional traits explain variation in plant life history strategies. Proceedings of the National Academy of Sciences of the United States of America, 111, 740–745. - PMC - PubMed
    1. Altwegg, R. , Dummermuth, S. , Anholt, B.R. & Flatt, T. (2005) Winter weather affects asp viper Vipera aspis population dynamics through susceptible juveniles. Oikos, 110, 55–66.
    1. Barbraud, C. , Tuck, G.N. , Thomson, R. , Delord, K. & Weimerskirch, H. (2013) Fisheries bycatch as an inadvertent human‐induced evolutionary mechanism. PLoS ONE, 8, e60353. - PMC - PubMed
    1. Barraquand, F. , Høye, T.T. , Henden, J.‐A. , Yoccoz, N.G. , Gilg, O. , Schmidt, N.M. et al (2014) Demographic responses of a site‐faithful and territorial predator to its fluctuating prey: long‐tailed skuas and arctic lemmings. Journal of Animal Ecology, 83, 375–387. - PubMed
    1. Baxter, P.W.J. , McCarthy, M.A. , Possingham, H.P. , Menkhorst, P.W. & McLean, N. (2006) Accounting for management costs in sensitivity analyses of matrix population models. Conservation Biology, 20, 893–905. - PubMed

Publication types