. 2016 Jan 27:5:e08848.
doi: 10.7554/eLife.08848.

Maternally provided LSD1/KDM1A enables the maternal-to-zygotic transition and prevents defects that manifest postnatally

Affiliations

Maternally provided LSD1/KDM1A enables the maternal-to-zygotic transition and prevents defects that manifest postnatally

Jadiel A Wasson et al. Elife. .

Abstract

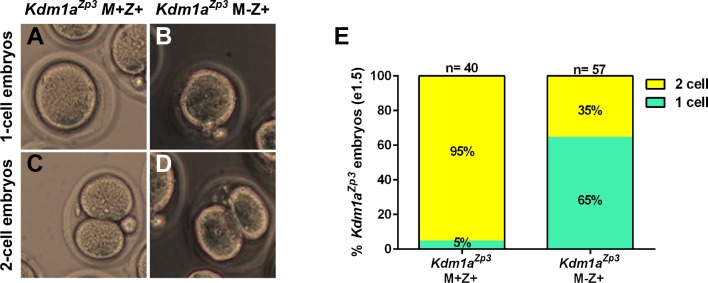
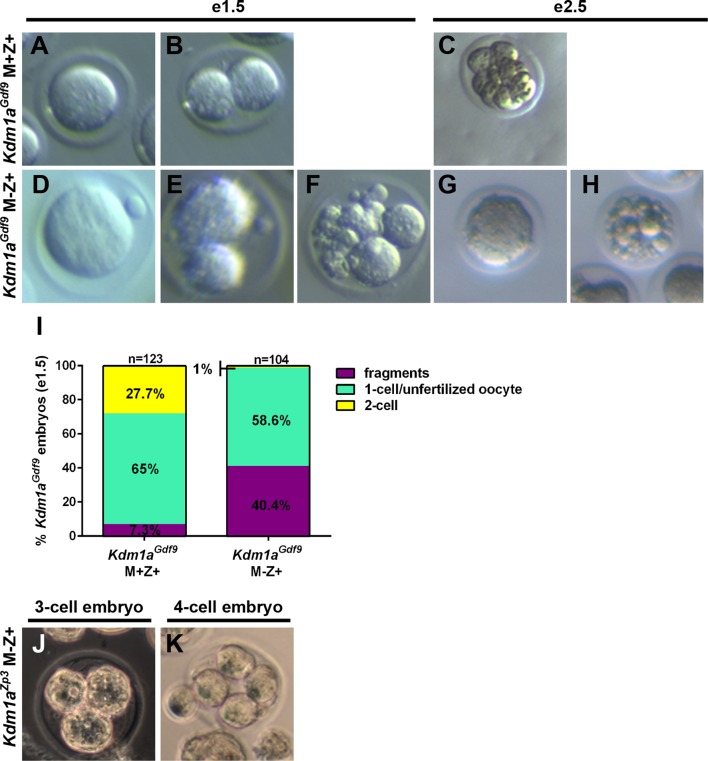
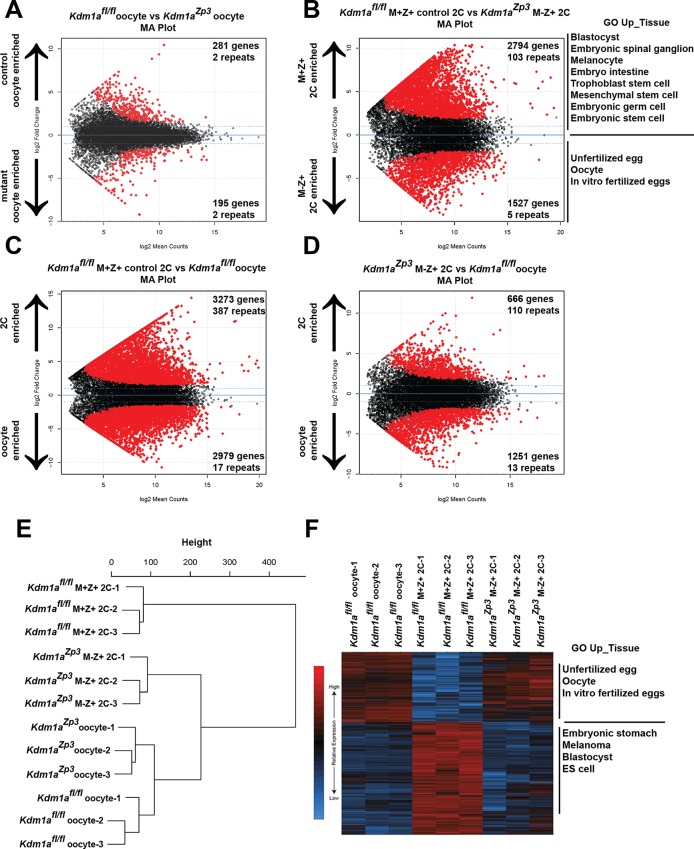
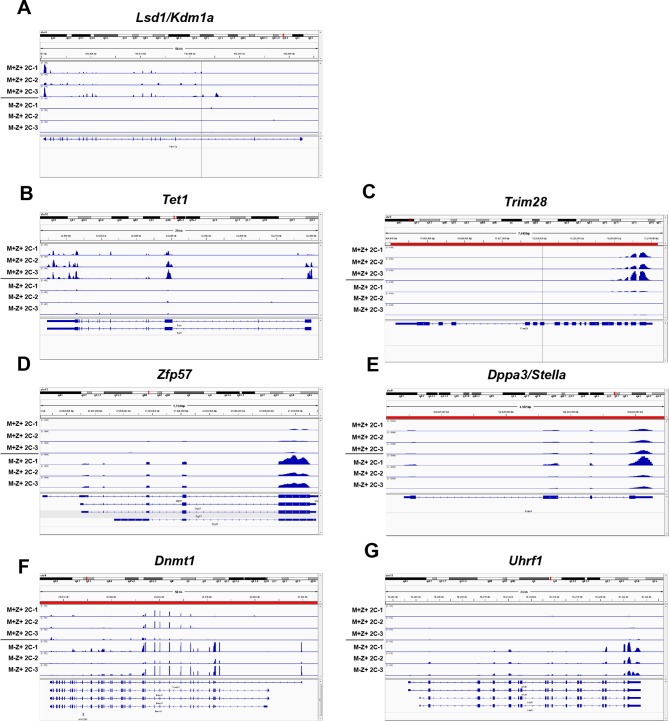
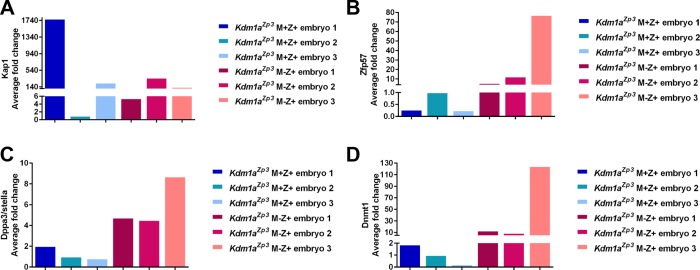
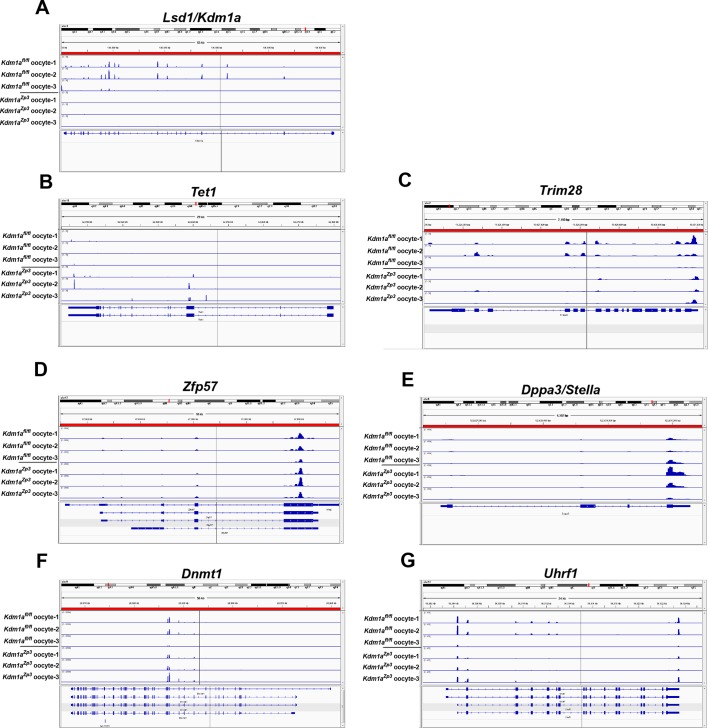
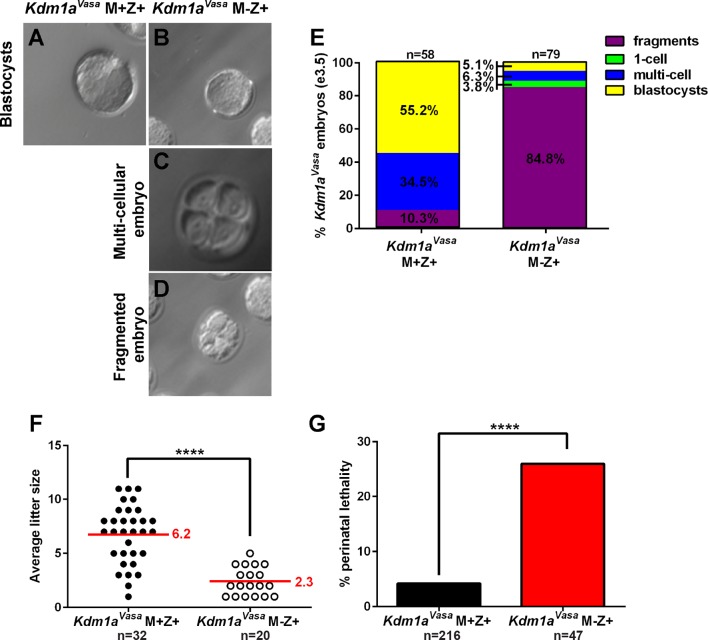
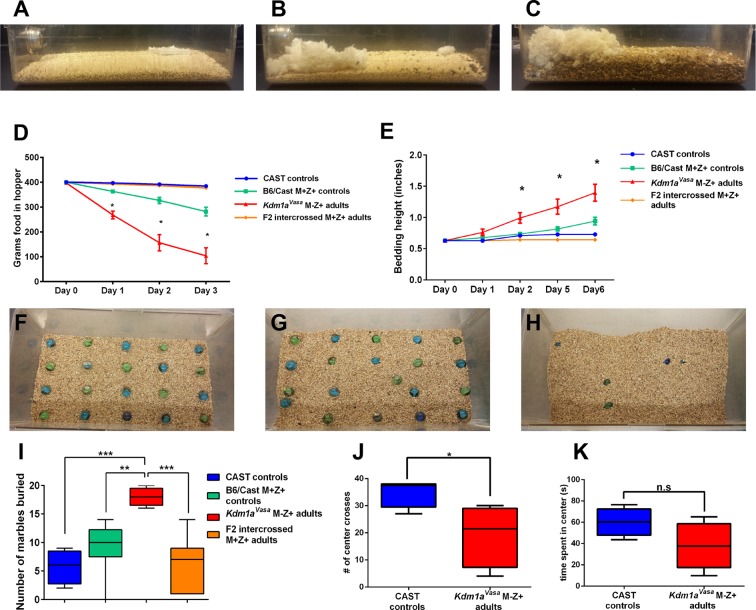
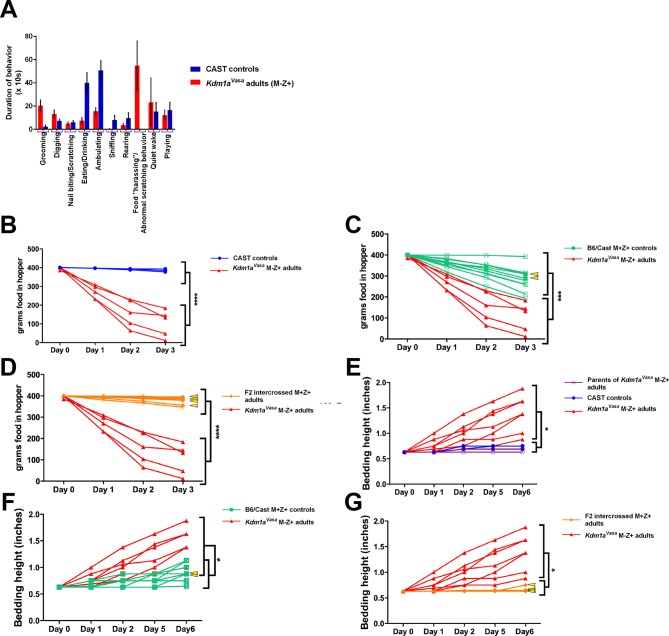
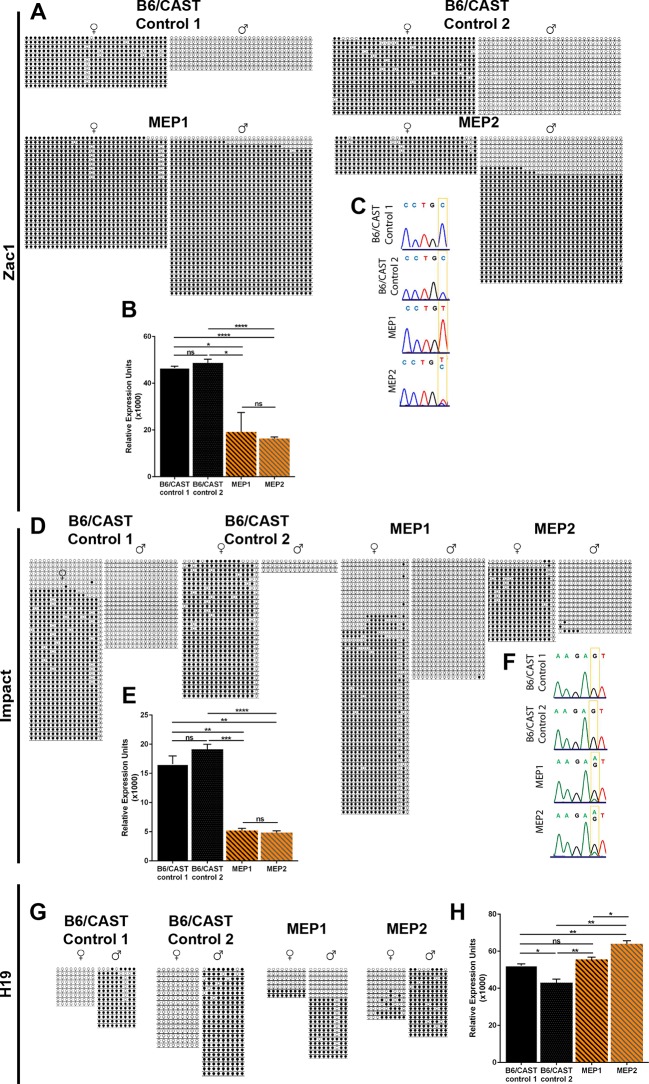
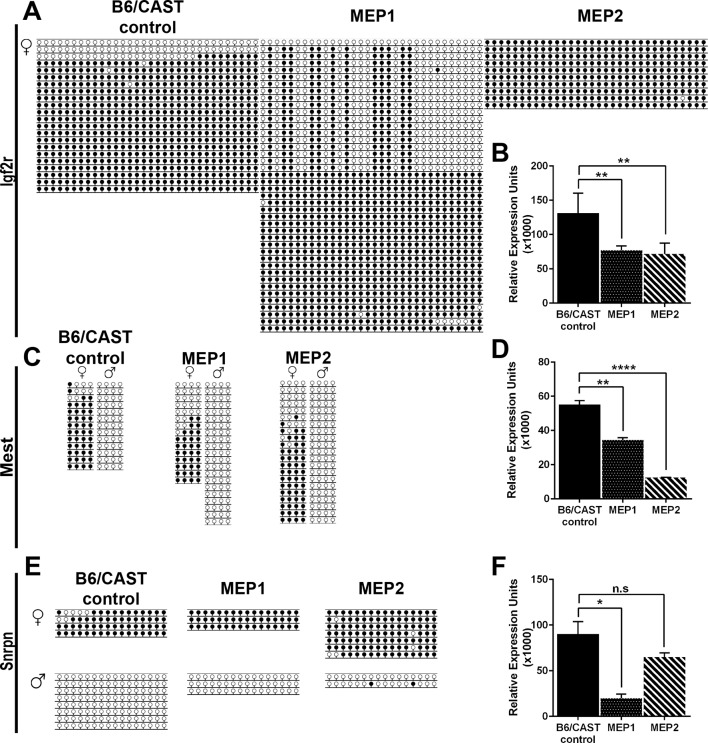
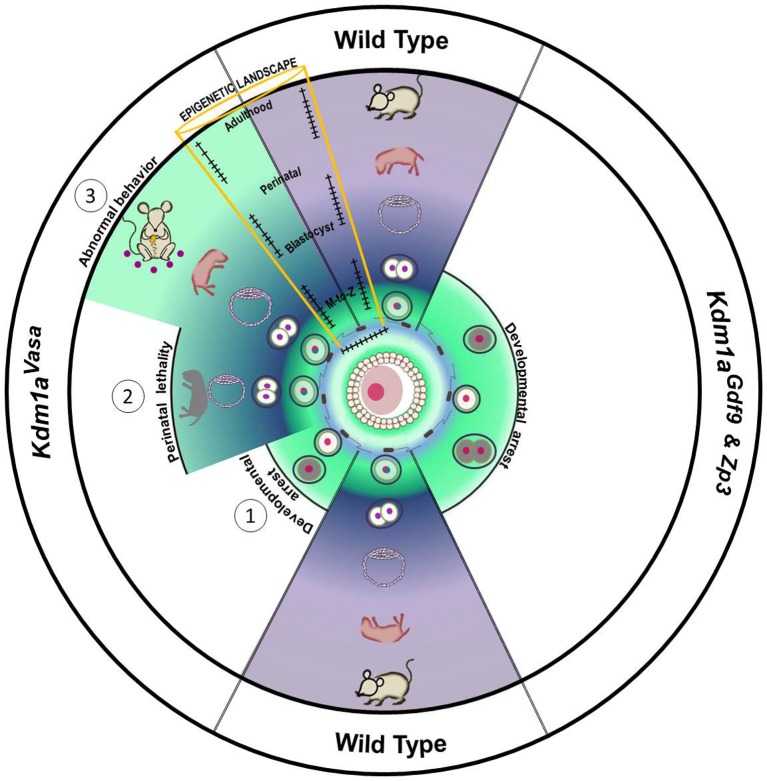
Somatic cell nuclear transfer has established that the oocyte contains maternal factors with epigenetic reprogramming capacity. Yet the identity and function of these maternal factors during the gamete to embryo transition remains poorly understood. In C. elegans, LSD1/KDM1A enables this transition by removing H3K4me2 and preventing the transgenerational inheritance of transcription patterns. Here we show that loss of maternal LSD1/KDM1A in mice results in embryonic arrest at the 1-2 cell stage, with arrested embryos failing to undergo the maternal-to-zygotic transition. This suggests that LSD1/KDM1A maternal reprogramming is conserved. Moreover, partial loss of maternal LSD1/KDM1A results in striking phenotypes weeks after fertilization; including perinatal lethality and abnormal behavior in surviving adults. These maternal effect hypomorphic phenotypes are associated with alterations in DNA methylation and expression at imprinted genes. These results establish a novel mammalian paradigm where defects in early epigenetic reprogramming can lead to defects that manifest later in development.

Keywords: KDM1a; LSD1; MZT; developmental biology; epigenetics; genomic imprinting; maternal effect; mouse; stem cells.


Conflict of interest statement

The authors declare that no competing interests exist.

Figures

Figure 1.
Figure 1.. Maternal expression and coditional deletion of Kdm1a in mouse oocytes.
(A) Wild-type mouse oocyte nucleus (white arrowhead) and surrounding follicle cells (white asterisks) stained with anti-KDM1A (green) antibody and DAPI (red). (B) Developmental timeline of maternal Cre expression (Vasa-Cre, Gdf9-Cre and Zp3-Cre transgenes) and corresponding oogenesis stages. (C,D) Immunohistochemistry (IHC) with anti-KDM1A (brown) antibody and hematoxylin (blue) showing KDM1A nuclear expression (black arrowhead) and absence of expression (white arrowheads) in Kdm1aGdf9 control (C) and mutant (D) oocytes. (E,F) Immunofluorescence (IF) with anti-KDM1A (green) antibody, phalloidin (red) and DAPI (blue) showing KDM1A nuclear expression (black arrowhead) and absence of expression (white arrowheads) in Kdm1aZp3 control (E) and mutant (F) oocytes. (G,H) IHC with anti-KDM1A (brown) antibody and hematoxylin (blue) showing KDM1A nuclear expression (black arrowhead), absence of expression (white arrowhead) and reduced expression (pink arrowhead) in Kdm1aVasa control (G) and mutant (H) oocytes. (I) Percentage of oocytes with KDM1A (green), reduced KDM1A (red) or no KDM1A blue) staining in Kdm1aGdf9and Kdm1aVasaheterozygous control versus mutant oocytes. Scale bars represent 50 μm. n=number of oocytes analyzed with percentages indicated for each category. DOI: http://dx.doi.org/10.7554/eLife.08848.003
Figure 1—figure supplement 1.
Figure 1—figure supplement 1.. KDM1A expression in stged oocytes.
(A–L) Immunohistochemistry (IHC) of primordial follicles (A–C), primary follicles (D–F), secondary follicles (G-I) and pre-antral and antral follicles (J–L) stained with anti-KDM1A(brown) antibody and hematoxylin (blue). The oocyte nucleus is indicated with black arrowheads. Scale bars represent 50 μm. DOI: http://dx.doi.org/10.7554/eLife.08848.004
Figure 1—figure supplement 2.
Figure 1—figure supplement 2.. Generation of Kdm1a mutant and control animals.
Kdm1a animals were generated by crossing multiple generations of Kdm1afl/fl animals with either Gdf9-, Zp3-, or Vasa-Cre transgenic animals. Blue indicates Mus castaneus control animals. Purple indicates Kdm1a mutant females. Green indicates B6/Cast hybrid control progeny. Red indicates Kdm1a maternal effect progeny (MEP). Orange indicates progeny resulting from intercrossing 2 MEP adult animals. All labelled progeny were used in crosses and assays presented in subsequent figures (color-coding matches animals used and graphed in each figure). DOI: http://dx.doi.org/10.7554/eLife.08848.005
Figure 2.
Figure 2.. Kdm1aZp3 embryos arrest at the 1–2 cell stage.
(A–D) Brightfield images of (A,C) M+Z+ and (B,D) M-Z+ 1- and 2-cell embryos derived from Kdm1aZp3 control and mutant mothers at e1.5. (E) Percentage of 1-cell (green) and 2-cell (yellow) embryos derived from Kdm1aZp3 control and mutant mothers at e1.5. n = 40 for Kdm1aZp3 M+Z+ embryos from 3 litters. n = 57 for Kdm1aZp3 M-Z+ embryos from 6 litters. DOI: http://dx.doi.org/10.7554/eLife.08848.006
Figure 2—figure supplement 1.
Figure 2—figure supplement 1.. Lack of normal Kdm1aGdf9 and Kdm1aZp3 embryos at embryonic day 1.5 and 2.5.
(A,B,D,E,F) Brightfield images of embryonic day 1.5 (e1.5) M+Z+ 1-cell (A) and 2-cell (B) embryos and M-Z+ 1-cell (D), 2-cell (E), and fragmented (F) embryos derived from Kdm1aGdf9 control and mutant mothers. (C,G,H) Brightfield images of e2.5 M+Z+ 8-cell (C) embryo and M-Z+ abnormal 1-cell (G), and fragmented (H) embryos derived from Kdm1aGdf9 control and mutant mothers. (I) Percentage of fragmented (purple), unfertilized oocyte or 1C (green), and 2C (yellow) embryos from Kdm1aGdf9 control and mutant mothers. n = 123 for Kdm1aGdf9 M+Z+ control embryos from 8 litters. n = 104 for Kdm1aGdf9 M-Z+ embryos from 8 litters. (J) Brightfield image of 3-cell M-Z+ embryo derived from a Kdm1aZp3 mutant mother. (K) Brightfield image of 4-cell M-Z+ embryo derived from a Kdm1aZp3 mutant mother. DOI: http://dx.doi.org/10.7554/eLife.08848.007
Figure 3.
Figure 3.. The MZT is impaired in Kdm1aZp3 mutants.
(A,B) Differential expression of mRNAs in Kdm1afl/flversus Kdm1aZp3 oocytes (A) or Kdm1afl/fl M+Z+ versus Kdm1aZp3 M-Z+ 2C embryos (B) as determined by RNA-seq. Genes/repeats highlighted in red are significant with the number of significant gene/repeats show. GO enrichment using the Up_tissue database was performed on Kdm1afl/flM+Z+ 2C enriched and Kdm1aZp3 M-Z+ 2C enriched mRNAs, with a list of the most enriched categories displayed. (C,D) Differential expression of mRNAs in Kdm1afl/fl M+Z+ 2C embryos versus Kdm1afl/fl oocytes (C) or Kdm1aZp3 M-Z+ 2C embryos versus Kdm1afl/fl oocytes (D). The numbers of zygotically activated (2C enriched) genes/repeats and zygotically repressed (oocyte enriched) genes/repeats are highlighted in each comparison. (E) Hierarchical cluster dendrogram of transcriptomes in Kdm1afl/fl oocytes, Kdm1aZp3 oocytes, Kdm1afl/flM+Z+ 2C embryos, and Kdm1aZp3 M-Z+ 2C embryos. (F) Heat map of gene expression of principal component 1 (PC1) genes in Kdm1afl/floocytes, Kdm1afl/fl M+Z+ 2C embryos, and Kdm1aZp3 M-Z+ 2C embryos. The most GO Up_tissue enriched terms are displayed for the 2 categories of PC1 genes. DOI: http://dx.doi.org/10.7554/eLife.08848.008
Figure 3—figure supplement 1.
Figure 3—figure supplement 1.. The MZT is impaired in Kdm1aZp3 mutants.
(A–H) Differential expression of mRNAs in Kdm1afl/fl versus Kdm1aZp3 oocytes (A,E), Kdm1afl/fl M+Z+ versus Kdm1aZp3 M-Z+ 2C embryos (B,F), Kdm1afl/fl M+Z+ 2C embryos versus Kdm1afl/fl oocytes (C,G), and Kdm1aZp3 M-Z+ 2C embryos versus Kdm1afl/fl oocytes (D,H) as determined by RNA-seq. Differential expression represented in mean difference plots (A–D) and normalized FPKM values on XY scatter plots (E–H). Genes/repeats highlighted in red are significant. DOI: http://dx.doi.org/10.7554/eLife.08848.013
Figure 3—figure supplement 2.
Figure 3—figure supplement 2.. Principal component analysis of Kdm1aZp3 2C embryos.
(A) Principal Component 1 is plotted on x-axis and Principal Component 2 is plotted on y-axis. Variance due to each component for Kdm1aZp3 M-Z+ 2C embryos (red), Kdm1afl/flM+Z+ 2C embryos (green), and Kdm1afl/fl oocytes (purple) are shown. DOI: http://dx.doi.org/10.7554/eLife.08848.014
Figure 3—figure supplement 3.
Figure 3—figure supplement 3.. Expression of epigenetic regulators in Kdm1aZp3 2C embryos.
Sequenced RNA-seq reads showing relative expression from Kdm1afl/fl M+Z+ 2C embryos and Kdm1aZp3 M-Z+ 2C embryos aligned to the genome for Lsd1/Kdm1a (A), Tet1 (B), Trim28 (C), Zfp57 (D), Dppa3/stella (E), Dnmt1 (F) and Uhrf1 (G). Gene tracks visualized using Integrative Genomics Viewer. DOI: http://dx.doi.org/10.7554/eLife.08848.015
Figure 3—figure supplement 4.
Figure 3—figure supplement 4.. Relative expression of epigenetic regulators in Kdm1aZp3 2C embryos.
Quantitative RT-PCR analysis of epigenetic regulators including Trim28 (A), Zfp57 (B) Dppa3/stella (C), and Dnmt1 (D) in Kdm1aZp3 M+Z+ 2C embryos compared to Kdm1aZp3 M-Z+ 2C embryos. Y-axis represents average fold change. All gene expression was normalized to Hprt expression. DOI: http://dx.doi.org/10.7554/eLife.08848.016
Figure 3—figure supplement 5.
Figure 3—figure supplement 5.. Expression of epigenetic regulators in Kdm1afl/fl and Kdm1aZp3 oocytes.
Sequenced RNA-seq reads showing relative expression from Kdm1afl/fl oocytes and Kdm1aZp3 mutant oocytes aligned to the genome for Lsd1/Kdm1a (A), Tet1 (B), Trim28 (C), Zfp57 (D), Dppa3/stella (E), Dnmt1 (F) and Uhrf1 (G). Gene tracks visualized using Integrative Genomics Viewer. DOI: http://dx.doi.org/10.7554/eLife.08848.017
Figure 4.
Figure 4.. Hypomorphic phenotype in Kdm1aVasa progeny.
(A–D) Brightfield images of M+Z+. (A) and M-Z+ (B–D) embryos derived from Kdm1aVasa control and mutant mothers at embryonic day 3.5 (e3.5). Panels show blastocysts (A,B), a multicellular embryo (C) and a fragmented embryo (D). (E) Percentage of fragmented (purple), 1-cell (green), multi-cellular (blue) and blastocyst (yellow) embryos from Kdm1aVasa control and mutant mothers at e3.5. n = 58 for Kdm1aVasa M+Z+ embryos from 7 litters. n = 79 for Kdm1aVasa M-Z+ embryos from 10 litters. (F) Litter sizes of Kdm1aVasa control and mutant mothers. Average litter size for each indicated by red line. Each circle indicates one litter and n=number of litters analyzed. p-values calculated using an unpaired t-test with **** = p<0.0001 indicating statistical significance. (G) Percentage of newborn pups from Kdm1aVasa heterozygous control and mutant mothers that died perinatally. n = number of litters analyzed. p-values calculated using an unpaired t-test with **** = p<0.0001 indicating statistical significance. DOI: http://dx.doi.org/10.7554/eLife.08848.018
Figure 5.
Figure 5.. Abnormal behaviors in Kdm1aVasa M-Z+ adults.
(A–C) Mouse cages at day 0 (A) and day 8 (B) from M. castaneus (CAST) controls compared to day 6 (C) from a Kdm1aVasa M-Z+ adult. (D) Quantification of change in weight of food in the hopper from CAST controls, B6/CAST hybrid M+Z+ controls, and F2 intercrossed M+Z+ adults versus Kdm1aVasa M-Z+ adults. Data are shown as mean for each day with error bars indicating ± S.E.M. (E) Quantification of change in bedding height from CAST controls, B6/CAST hybrid M+Z+ controls, and F2 intercrossed M+Z+ adults versus Kdm1aVasa M-Z+ adults. Data are shown as mean for each day with error bars indicating ± S.E.M. (F–H) Mouse cages before (F) and after (G,H) the marble burying assay was performed on a CAST control (G) compared to a Kdm1aVasa M-Z+ adult (H). (I) Quantification of the number of marbles buried during the marble burying assay performed on CAST controls, B6/CAST hybrid M+Z+ controls, and F2 intercrossed M+Z+ adults versus Kdm1aVasa M-Z+ adults. Data are shown as quartiles with error bars indicating ± S.E.M. (J,K) Open field test performance in CAST controls versus Kdm1aVasa M-Z+ adults scored by number of center crosses (J) and time spent in center of cage (K). Data are shown as quartiles with error bars indicating ± S.E.M. p-values calculated using an unpaired t-test with n.s. indicating p>0.05, * = p<0.05, ** = p<0.005, *** = p<0.0005. All asterisks indicate statistical significance. DOI: http://dx.doi.org/10.7554/eLife.08848.020
Figure 5—figure supplement 1.
Figure 5—figure supplement 1.. Abnormal behaviors in individual Kdm1aVasa M-Z+ adults.
(A) Behavioral ethogram of M. castaneus (CAST) controls versus Kdm1aVasa M-Z+ adults. (B) Quantification of change in weight of food in the hopper of parents of Kdm1aVasa M-Z+ adults and CAST controls versus Kdm1aVasa M-Z+ adults. (C) Quantification of change in weight of food in the hopper of B6/CAST M+Z+ controls versus Kdm1aVasa M-Z+ adults. (D) Quantification of change in weight of food in the hopper of F2 intercrossed M+Z+ adults versus Kdm1aVasa M-Z+ adults. (E) Quantification of change in bedding height of parents of Kdm1aVasa M-Z+ adults and CAST controls versus Kdm1aVasa M-Z+ adults. (F) Quantification of change in bedding height of B6/CAST M+Z+ controls versus Kdm1aVasa M-Z+ adults. (G) Quantification of change in bedding height of F2 intercrossed M+Z+ adults versus Kdm1aVasa M-Z+ adults. The measurements for each individual animal (B–D) and (E–G) correspond to the averages shown in Figure 5 (D,E). Yellow arrowheads represent animals heterozygous for Kdm1a. Data shown as mean for each day. p-values calculated using an unpaired t-test with * = p<0.05, *** = p<0.0005, **** = p<0.0001. All asterisks indicate statistical significance. DOI: http://dx.doi.org/10.7554/eLife.08848.021
Figure 6.
Figure 6.. Imprinting defects in Kdm1aVasa progeny.
(A,D,G) Allele-specific bisulfite analysis of Zac1 (A), Impact (D), and H19 (G). Each line represents the clone of an allele. Each circle represents a CpG dinucleotide where closed circles indicate methylation and open circles indicate no methylation. Maternal and paternal alleles are indicated. (B,E,H) Relative expression analysis of Zac1 (B), Impact (E), and H19 (H). Expression normalized to β-actin. Error bars indicate S.E.M. p-values calculated using an unpaired t-test with n.s. indicating p>0.05, * = p<0.05, ** = p<0.005, **** = p<0.0001. All asterisks indicate statistical significance. (C,F) Allele-specific expression of Zac1 (C) and Impact (F). The polymorphic base is highlighted in yellow. For Zac1, the maternal allele SNP is T (red) in highlighted position and paternal allele SNP is C (blue) in electrophoretogram. For Impact, the maternal allele SNP is A (green) in highlighted position and paternal allele SNP is G (black) in electrophoretogram. All analyses were performed on 2 staged matched B6/CAST hybrid control pups and 2 maternal effect progeny (MEP) exhibiting perinatal lethality. DOI: http://dx.doi.org/10.7554/eLife.08848.024
Figure 6—figure supplement 1.
Figure 6—figure supplement 1.. Imprinting analysis of Kdm1aVasa progeny.
(A,C,E) Allele-specific bisulfite analysis of, Igf2r (A), Mest (C), and Snrpn (E). Each line represents the clone of an allele. Each circle represents a CpG dinucleotide where closed circles indicate methylation and open circles indicate no methylation. Maternal and paternal alleles are indicated. (B,D,F) Relative expression analysis of Igf2r (B), Mest (D), and Snrpn (F). Expression normalized to β-actin. Error bars indicate ± S.E.M. p-values calculated using an unpaired t-test with n.s. indicating p>0.05, * = p<0.05, ** = p<0.005, **** = p<0.0001. All asterisks indicate statistical significance. All analyses were performed on a stage matched B6/CAST hybrid control pup and 2 maternal effect progeny (MEP) exhibiting perinatal lethality. DOI: http://dx.doi.org/10.7554/eLife.08848.025
Figure 7.
Figure 7.. Model.
Loss of maternal LSD1 results in defects later in development in wild-type oocytes, after fertilization (denoted by blue sperm encircling oocyte) the fertilized egg undergoes the maternal to zygotic transition (MZT; green to blue/purple) at the 1–2 cell stage. These M+Z+ embryos proceed normally through development (indicated by blastocyst, perinatal stage pup, and adult mouse). In contrast, when Lsd1 is deleted with either Gdf9- or Zp3-Cre, the resulting Lsd1Gdf9 and Lsd1Zp3 progeny become arrest at the 1–2 cell stage and never undergo the MZT (green). When Lsd1 is deleted with Vasa-Cre, we observe 3 hypomorphic outcomes in resulting Lsd1Vasa progeny: (1) developmental arrest at the 1–2 cell stage, (2) perinatal lethality and (3) abnormal behavior in surviving adult animals. These outcomes are due to reduced LSD1 in the mothers oocyte, suggesting that lowered maternal LSD1 can result in defects much later in development. These long-range outcomes are associated with imprinting defects (depicted as wild-type versus mutant changes in DNA methylation within the yellow region). DOI: http://dx.doi.org/10.7554/eLife.08848.027

Comment in

Similar articles

Cited by

References

    1. Aoki F, Worrad DM, Schultz RM. Regulation of transcriptional activity during the first and second cell cycles in the preimplantation mouse embryo. Developmental Biology. 1997;181:296–307. doi: 10.1006/dbio.1996.8466. - DOI - PubMed
    1. Arico JK, Katz DJ, van der Vlag J, Kelly WG. Epigenetic patterns maintained in early caenorhabditis elegans embryos can be established by gene activity in the parental germ cells. PLoS Genetics. 2011;7:e08848. doi: 10.1371/journal.pgen.1001391. - DOI - PMC - PubMed
    1. Bartolomei MS, Tilghman SM. Genomic imprinting in mammals. Annual Review of Genetics. 1997;31:493–525. doi: 10.1146/annurev.genet.31.1.493. - DOI - PubMed
    1. Bartolomei MS. Genomic imprinting: employing and avoiding epigenetic processes. Genes & Development. 2009;23:2124–2133. doi: 10.1101/gad.1841409. - DOI - PMC - PubMed
    1. Bock C, Reither S, Mikeska T, Paulsen M, Walter J, Lengauer T. BiQ Analyzer: visualization and quality control for DNA methylation data from bisulfite sequencing. Bioinformatics. 2005;21:4067–4068. doi: 10.1093/bioinformatics/bti652. - DOI - PubMed

LinkOut - more resources