The Elevated Secreted Immunoglobulin D Enhanced the Activation of Peripheral Blood Mononuclear Cells in Rheumatoid Arthritis
- PMID: 26814717
- PMCID: PMC4729477
- DOI: 10.1371/journal.pone.0147788
The Elevated Secreted Immunoglobulin D Enhanced the Activation of Peripheral Blood Mononuclear Cells in Rheumatoid Arthritis
Abstract
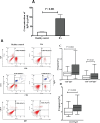
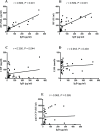
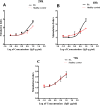
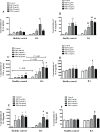
Immunoglobulin D (IgD) is a surface immunoglobulin that is expressed as either membrane IgD (mIgD) or secreted IgD (sIgD). Researchers have shown that sIgD is often elevated in patients with autoimmune diseases. The possible roles of sIgD on the function of peripheral blood mononuclear cells (PBMCs) in rheumatoid arthritis (RA) are still unclear. In this study, we compared the expression of sIgD, mIgD and IgD receptor (IgDR) in RA patients and healthy controls, and investigated the effect of sIgD on the function of PBMCs. We found that the levels of sIgD, mIgD and IgDR were significantly higher in RA patients compared with healthy controls. The concentrations of sIgD were positively correlated with soluble receptor activator of nuclear factor-κB ligand (sRANKL), rheumatoid factor (RF) and C-reactive protein (CRP) in RA patients. Strikingly, IgD could enhance the proliferation of PBMCs and induce IL-1α, IL-1β, TNF-α, IL-6 and IL-10 production from PBMCs. Moreover, the percentage of activated T cell subsets (CD4+CD69+, CD4+CD154+) and activated B cell subsets (CD19+CD23+, CD19+CD21+, CD19+IgD+ and CD19-CD138+) were increased by IgD. The percentage of unactivated T cell subset (CD4+CD62L+) and immature B cell subset (CD19+IgM+IgD-) were decreased by IgD in PBMCs. Furthermore, the expressions of IgDR on T and B cells were significantly increased by treatment with IgD. Our results demonstrate that IgD enhanced the activation of PBMCs, which may contribute to RA pathogenesis. Therefore, IgD could be a potential novel immunotherapeutic target for the management of RA.
Conflict of interest statement
Figures


Similar articles
-
An IgD-Fc-Ig fusion protein restrains the activation of T and B cells by inhibiting IgD-IgDR-Lck signaling in rheumatoid arthritis.Acta Pharmacol Sin. 2022 Feb;43(2):387-400. doi: 10.1038/s41401-021-00665-w. Epub 2021 Apr 16. Acta Pharmacol Sin. 2022. PMID: 33864023 Free PMC article.
-
The immunoglobulin D Fc receptor expressed on fibroblast-like synoviocytes from patients with rheumatoid arthritis contributes to the cell activation.Acta Pharmacol Sin. 2017 Nov;38(11):1466-1474. doi: 10.1038/aps.2017.105. Epub 2017 Aug 3. Acta Pharmacol Sin. 2017. PMID: 28770826 Free PMC article.
-
Immunoglobulin D (IgD) and IgD receptor expression in diffuse large B-cell lymphoma.Hematology. 2019 Dec;24(1):544-551. doi: 10.1080/16078454.2019.1642553. Hematology. 2019. PMID: 31315540
-
The effect of aging on IgD receptor expression by T cells and its functional implications.Immunol Rev. 1997 Dec;160:145-57. doi: 10.1111/j.1600-065x.1997.tb01035.x. Immunol Rev. 1997. PMID: 9476673 Review.
-
The therapeutic implications of activated immune responses via the enigmatic immunoglobulin D.Int Rev Immunol. 2022;41(2):107-122. doi: 10.1080/08830185.2020.1861265. Epub 2021 Jan 7. Int Rev Immunol. 2022. PMID: 33410368 Review.
Cited by
-
The role of inflammatory mediators in the pathogenesis of periodic fever, aphthous stomatitis, pharyngitis and cervical adenitis (PFAPA) syndrome.Mol Biol Rep. 2022 Aug;49(8):8061-8069. doi: 10.1007/s11033-022-07352-x. Epub 2022 Mar 23. Mol Biol Rep. 2022. PMID: 35320440 Review.
-
The Regulatory Effects of Paeoniflorin and Its Derivative Paeoniflorin-6'-O-Benzene Sulfonate CP-25 on Inflammation and Immune Diseases.Front Pharmacol. 2019 Feb 5;10:57. doi: 10.3389/fphar.2019.00057. eCollection 2019. Front Pharmacol. 2019. PMID: 30804784 Free PMC article. Review.
-
CP-25 Attenuates the Activation of CD4+ T Cells Stimulated with Immunoglobulin D in Human.Front Pharmacol. 2018 Jan 23;9:4. doi: 10.3389/fphar.2018.00004. eCollection 2018. Front Pharmacol. 2018. PMID: 29410624 Free PMC article.
-
IgD+IgM- B Cells in Common Variable Immunodeficiency.Pathogens. 2024 Feb 1;13(2):136. doi: 10.3390/pathogens13020136. Pathogens. 2024. PMID: 38392874 Free PMC article.
-
Targeting the Neonatal Fc Receptor in Autoimmune Diseases: Pipeline and Progress.BioDrugs. 2025 May;39(3):373-409. doi: 10.1007/s40259-025-00708-2. Epub 2025 Mar 29. BioDrugs. 2025. PMID: 40156757 Free PMC article. Review.
References
-
- van Vollenhoven RF, Swenson CD, Soriano A, Goidl EA, Coico RF, Thorbecke GJ, et al. Serum IgD levels in mice: effect of strain, age and autoimmune disease. J Autoimmun. 1989;2(3):259–67. - PubMed
Publication types
MeSH terms
Substances
LinkOut - more resources
Full Text Sources
Other Literature Sources
Research Materials
Miscellaneous

