. 2016 Feb 4;530(7588):113-6.
doi: 10.1038/nature16505. Epub 2016 Jan 27.

Genome-wide nucleosome specificity and function of chromatin remodellers in ES cells

Affiliations

Genome-wide nucleosome specificity and function of chromatin remodellers in ES cells

Maud de Dieuleveult et al. Nature. .

Abstract

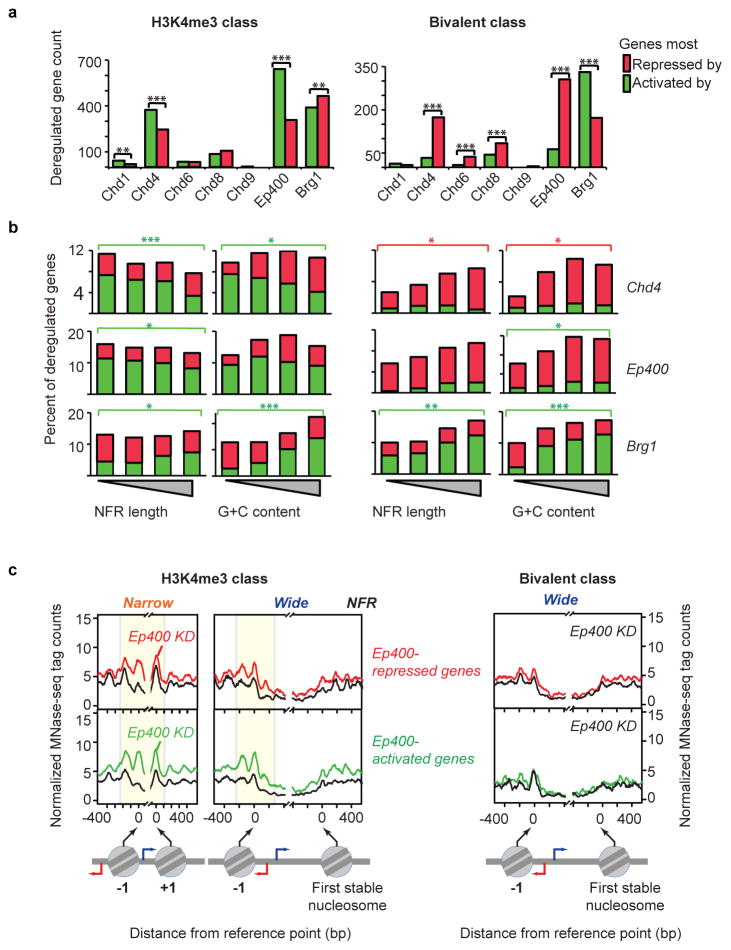
ATP-dependent chromatin remodellers allow access to DNA for transcription factors and the general transcription machinery, but whether mammalian chromatin remodellers target specific nucleosomes to regulate transcription is unclear. Here we present genome-wide remodeller-nucleosome interaction profiles for the chromatin remodellers Chd1, Chd2, Chd4, Chd6, Chd8, Chd9, Brg1 and Ep400 in mouse embryonic stem (ES) cells. These remodellers bind one or both full nucleosomes that flank micrococcal nuclease (MNase)-defined nucleosome-free promoter regions (NFRs), where they separate divergent transcription. Surprisingly, large CpG-rich NFRs that extend downstream of annotated transcriptional start sites are nevertheless bound by non-nucleosomal or subnucleosomal histone variants (H3.3 and H2A.Z) and marked by H3K4me3 and H3K27ac modifications. RNA polymerase II therefore navigates hundreds of base pairs of altered chromatin in the sense direction before encountering an MNase-resistant nucleosome at the 3' end of the NFR. Transcriptome analysis after remodeller depletion reveals reciprocal mechanisms of transcriptional regulation by remodellers. Whereas at active genes individual remodellers have either positive or negative roles via altering nucleosome stability, at polycomb-enriched bivalent genes the same remodellers act in an opposite manner. These findings indicate that remodellers target specific nucleosomes at the edge of NFRs, where they regulate ES cell transcriptional programs.


Conflict of interest statement

The authors declare no competing financial interests.

Figures

Extended Data Figure 1
Extended Data Figure 1. Experimental strategy for genome-wide remodeller-nucleosome interactions and transcriptome analysis in ES cells
Using homologous recombination in ES cells, a sequence encoding a combination of FLAG and hemagglutinin (HA) epitopes was introduced at the 3′ end of the coding sequence of the genes encoding the catalytic subunit of each remodeller. After in vivo crosslinking, chromatin was prepared and fragmented to mononucleosomes by MNase. Remodeller-bound mononucleosomes were isolated using a double immunoaffinity procedure. Immunopurification efficiency was assessed by Western blotting. Deep sequencing of the DNA from purified nucleosomes allowed the mapping of remodeller-bound nucleosomes across the mouse genome. The same tagged ES cell lines were used for shRNA-mediated depletion of remodellers and transcriptome analysis.
Extended Data Figure 2
Extended Data Figure 2. Remodeller binding profile at a representative locus
Counts indicate reads per 10 million. Promoters and enhancers are highlighted by blue and orange squares, respectively
Extended Data Figure 3
Extended Data Figure 3. Relation between remodeller enrichment at promoters and RNA expression level
Average binding profile of remodellers at promoters, divided in four quartiles based on RNA expression level of the corresponding genes. All promoters are transcribed from left to right. Promoter binding intensity of Chd1, Chd2, Chd9 and Ep400 at H3K4me3 promoters was correlated with RNA expression (see Methods). Consequently, binding of these remodellers to bivalent promoters, which are transcribed at lower levels, showed a significant reduction compared to H3K4me3 promoters. In contrast, Chd4, Chd6, and Brg1 enrichment at promoters showed little correlation with the transcription level of the corresponding genes, and was only slightly lower at bivalent, compared to H3K4me3 promoters.
Extended Data Figure 4
Extended Data Figure 4. Comparison of MNase ChIP-seq and sonication ChIP-seq for Chd4
The left panel shows the reference nucleosome map of 14,623 RefSeq genes, rank-ordered from smallest to largest NFR length, as in Fig. 2. The two on the right compare the distribution patterns obtained for Chd4 either by MNase ChIP-seq, with chromatin prepared from Chd4-tagged ES cells, or by ChIP-seq with sonicated chromatin (dataset accession number: GSM687284).
Extended Data Figure 5
Extended Data Figure 5. Nucleosome targeting by remodellers at H3K4me3-only and bivalent promoters
Remodeller-bound nucleosomal tags were aligned to the promoters of 6,481 active (H3K4me3 promoters) or 3,411 bivalent genes, rank-ordered from narrow to wide NFR. Corresponding reference nucleosomes, remodeller occupancy and the other indicated features are shown as in Fig. 2.
Extended Data Figure 6
Extended Data Figure 6. Western blot analysis of remodeller depletion by shRNA for transcriptome analysis
ES cells tagged for each remodeller were transfected with the corresponding shRNA vector, or a control plasmid. After puromycin selection, ES cells were collected for RNA preparation and Western blot analysis. Three independent experiments (indicated as 1, 2, and 3) were performed for each remodeller. Remodeller depletion was assessed using antibodies against FLAG or HA epitopes. Loading control: Gapdh. For gel source data, see Supplementary Figure 1.
Extended Data Figure 7
Extended Data Figure 7. Validation of remodeller depletion effects on transcription by RT-qPCR
Remodellers and histone marks enrichment profiles are shown as indicated on the left of each panel. A control ChIP profile, obtained with untagged ES cells, is shown for comparison. Scores indicate reads per 10 million. On the right of each panel are shown the results of RT-qPCR analysis that quantify RNA expression levels of the corresponding genes upon remodeller depletion in ES cells. Two distinct shRNA vectors (shRNA1 and shRNA2, see Methods) were used for each remodeller. Scores on the y-axis indicate the relative expression of the indicated genes compared to reference genes. Values are means and standard deviations of three independent transfection experiments.
Extended Data Figure 8
Extended Data Figure 8. Impact of remodeller depletion on chromatin accessibility at promoters
Consequence of remodeller depletion by shRNA vectors on ATAC-seq average profiles at all H3K4me3-only (top panels) and bivalent (bottom panels) promoters. Two replicate experiments are shown on each graph for both remodeller knockdown and controls.
Extended Data Figure 9
Extended Data Figure 9. Analysis of pol II distribution at promoters in remodeller depleted ES cells
a, Average pol II distribution (ChIP-exo) profile in control ES cells (black) or upon indicated remodeller knockdown (colour) at H3K4me3-only (left set) and bivalent genes (right set). Left and right panels within a set represent the set of genes that are most up- (red) or down-regulated (green) upon remodeller knockdown. Pol II occupancy is indicated within a window spanning 500 and 2000 bp on the upstream and downstream side of the TSS, respectively. All promoters are transcribed from left to right. b, Bargraphs showing Pol II occupancy change upon remodeller knockdown relative to control, measured by ChIP-exo, at genes either down-regulated (green) or up-regulated (red) following the depletion of the indicated remodeller. c, Pol II distribution of remodeller knockdown at a representative locus. Counts indicate reads per 10 million. Pol II loading is markedly reduced at the Tyms narrow NFR, H3K4me3 promoter by either Ep400 and Chd4 depletion, suggesting that these two remodellers contribute to Pol II recruitment.
Figure 1
Figure 1. Correlated occupancies across remodeller-bound nucleosomal regions
a, Heat map representing Pearson correlations between remodellers and other factors within 500 bp of 138,582 DHS midpoints. b, Same as (a) but for 16,300 promoter-like, H3K4me3-, TBP- and Pol II S5ph-positive DHSs. c, Distribution of remodeller-nucleosome interactions (MNase ChIP-seq tags for the indicated remodellers in blue) aligned at 14,623 individual RefSeq TSSs (rows), sorted by H3K4me3 levels. Corresponding RNA expression levels (red) are shown.
Figure 2
Figure 2. Patterns of remodeller-nucleosome interactions and chromatin features around promoter NFRs
a, Distribution of remodeller-nucleosome interactions, as in Fig. 1c, except aligned by NFR midpoint and sorted by NFR length. Standard MNase-defined nucleosomes (grey) and TSS (green) are shown. Narrow and wide NFRs are delineated by the dashed line. b, Same as in (a) for other genomic features. c, Averaged distribution of remodeller-nucleosome interactions from (a, b) at narrow and wide NFRs, aligned to the dyad of −1 (left portion of each graph) or the first MNase-resistant nucleosome downstream of the noncanonical chromatin (right portion). Standard nucleosomes (grey fill) and GRO-Seq RNA (blue and red dashed lines) are shown. A gap in the NFR midpoint was introduced to account for variations in NFR length inside each class.
Figure 3
Figure 3. Remodellers differentially regulate active versus bivalent genes
a, The number of genes whose RNA was either down- (green) or up-regulated (red) following remodeller depletion by >1.5 fold is shown for H3K4me3-only or bivalent genes. Statistical analysis involved a 2-sample test for equality of proportions with continuity correction: * P < 0.05, ** P < 0.01, *** P < 0.001. b, The percentages of H3K4me3 (left) or bivalent (right) genes up- (red) or down-regulated (green) by remodeller depletion are shown in four subgroups based on NFR length, as defined in Fig. 2, and in quartiles for C+G content. Statistical significance metrics (described in panel a) are colour-matched and applied to the first and last group. c, Averaged nucleosome distribution (MNase-seq) upon control (black) or Ep400 (colour) knockdown at H3K4me3-only (narrow versus wide NFR) and bivalent gene groups. Upper and lower panels represent genes that are up- (red) or down-regulated (green) (>1.5 fold) upon Ep400 knockdown.
Figure 4
Figure 4. Model of how remodellers might regulate distinct classes of genes in ES cells
Three gene classes are indicated, having remodeller-bound nucleosomes (coloured circles on top of grey circles) at specific positions relative to the TSS (horizontal blue arrow). MNase-sensitive noncanonical chromatin, having histone variants and active marks, is shown as half circles. Curved green and orange ribbons indicate transcriptional activation and repression, respectively. Single digit numbers denote corresponding Chd remodellers.

Comment in

  • Epigenomics: Custom remodelling.
    Burgess DJ. Burgess DJ. Nat Rev Genet. 2016 Mar;17(3):126-7. doi: 10.1038/nrg.2016.16. Epub 2016 Feb 8. Nat Rev Genet. 2016. PMID: 26852808 No abstract available.

Similar articles

Cited by

References

    1. Narlikar GJ, Sundaramoorthy R, Owen-Hughes T. Mechanisms and functions of ATP-dependent chromatin-remodeling enzymes. Cell. 2013;154:490–503. doi: 10.1016/j.cell.2013.07.011. - DOI - PMC - PubMed
    1. Becker PB, Workman JL. Nucleosome remodeling and epigenetics. Cold Spring Harbor perspectives in biology. 2013;5 doi: 10.1101/cshperspect.a017905. - DOI - PMC - PubMed
    1. Cairns BR. The logic of chromatin architecture and remodelling at promoters. Nature. 2009;461:193–198. doi: 10.1038/nature08450. - DOI - PubMed
    1. Yen K, Vinayachandran V, Batta K, Koerber RT, Pugh BF. Genome-wide nucleosome specificity and directionality of chromatin remodelers. Cell. 2012;149:1461–1473. doi: 10.1016/j.cell.2012.04.036. - DOI - PMC - PubMed
    1. Simic R, et al. Chromatin remodeling protein Chd1 interacts with transcription elongation factors and localizes to transcribed genes. The EMBO journal. 2003;22:1846–1856. doi: 10.1093/emboj/cdg179. - DOI - PMC - PubMed

Publication types

MeSH terms

Associated data