. 2016 Feb 4;530(7588):57-62.
doi: 10.1038/nature16546. Epub 2016 Jan 27.

Active medulloblastoma enhancers reveal subgroup-specific cellular origins

Affiliations

Active medulloblastoma enhancers reveal subgroup-specific cellular origins

Charles Y Lin et al. Nature. .

Abstract

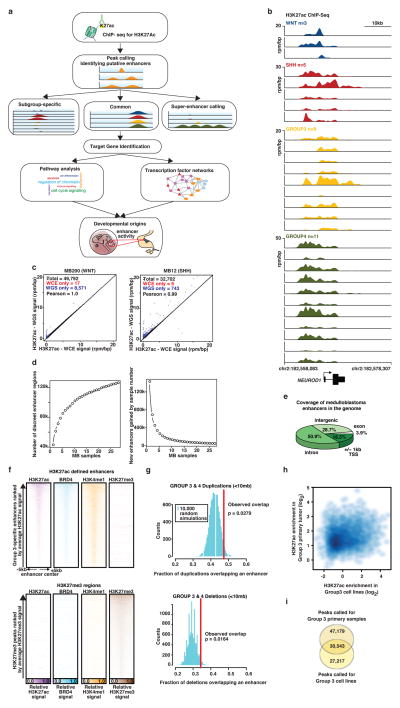
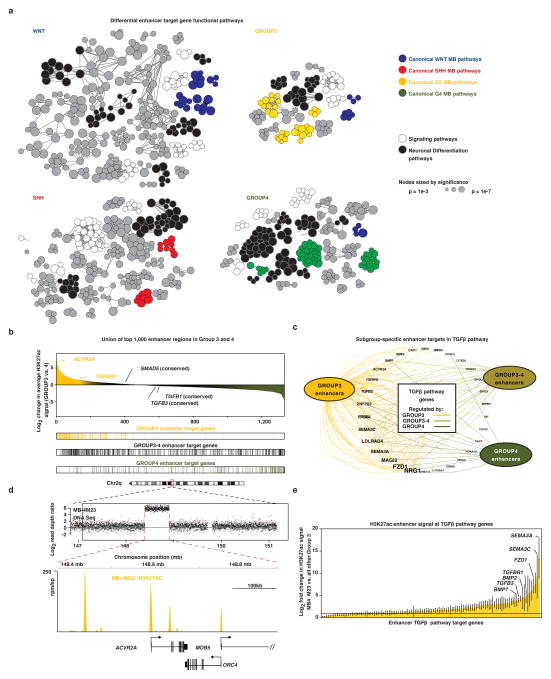
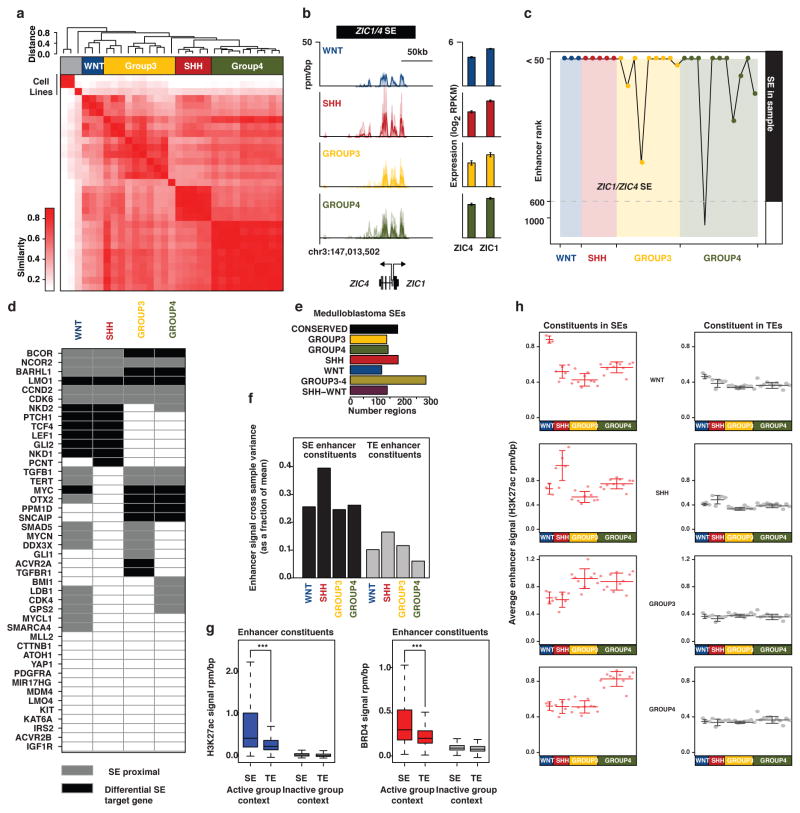
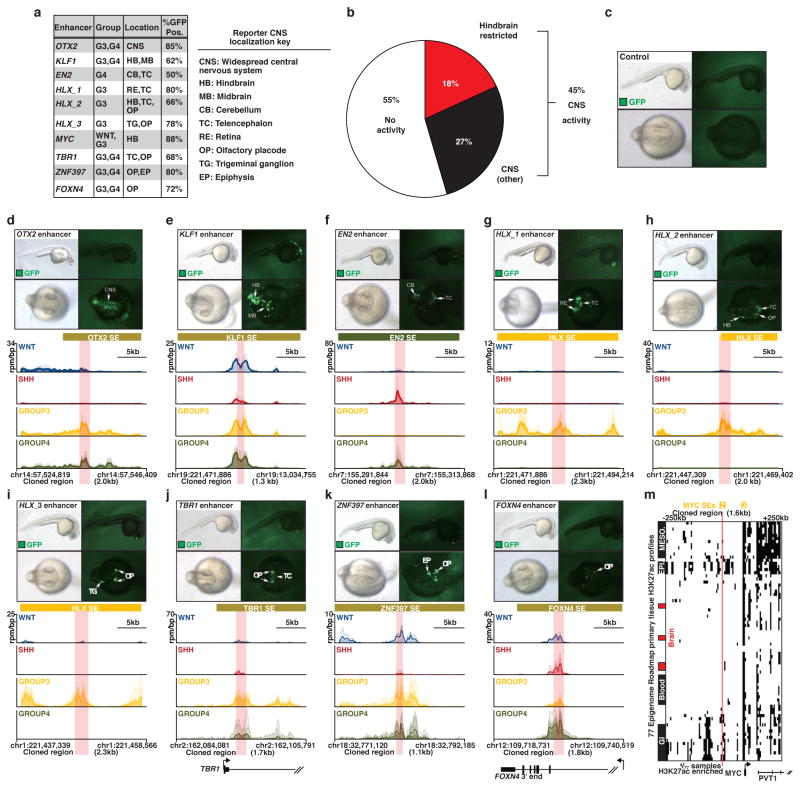
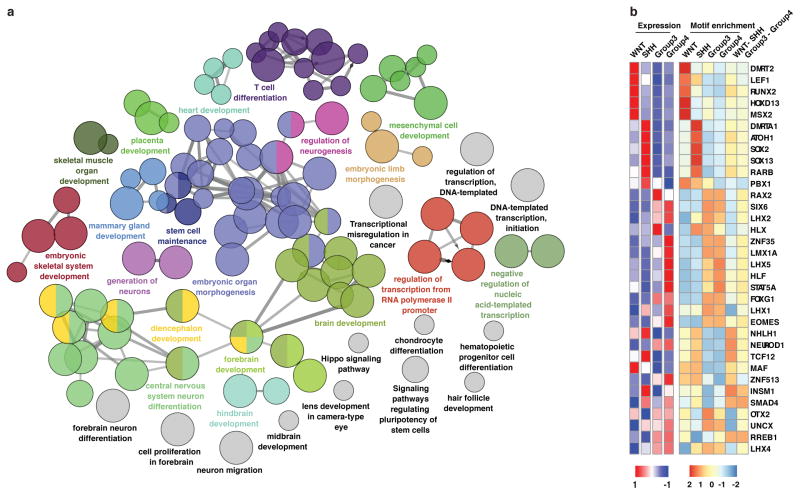
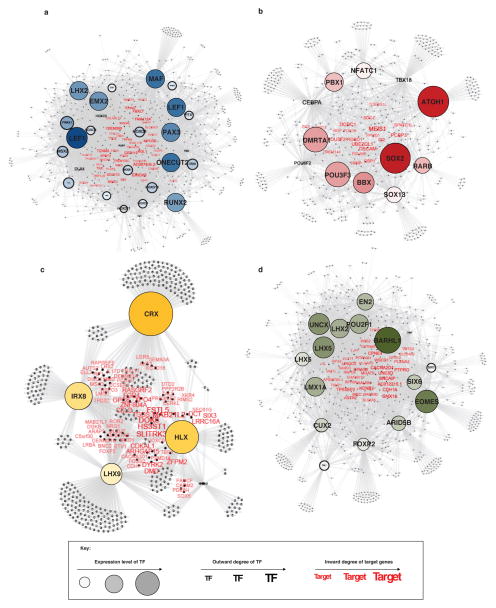
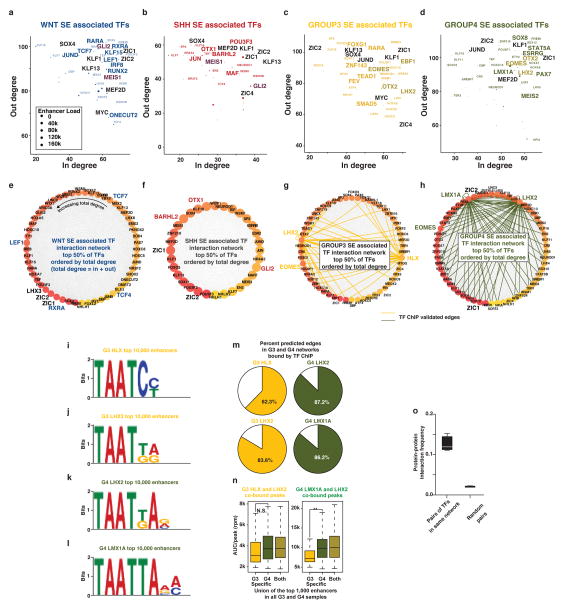
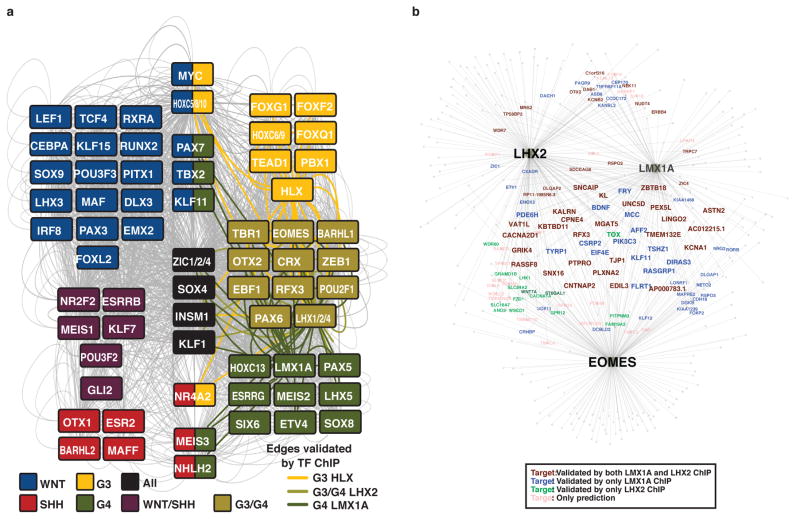
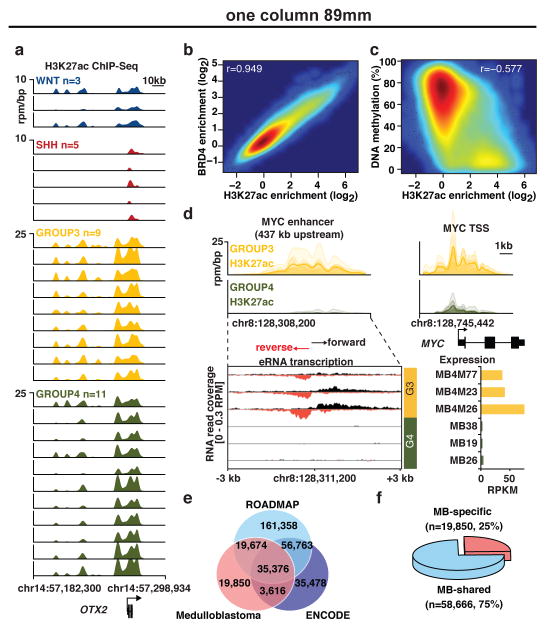
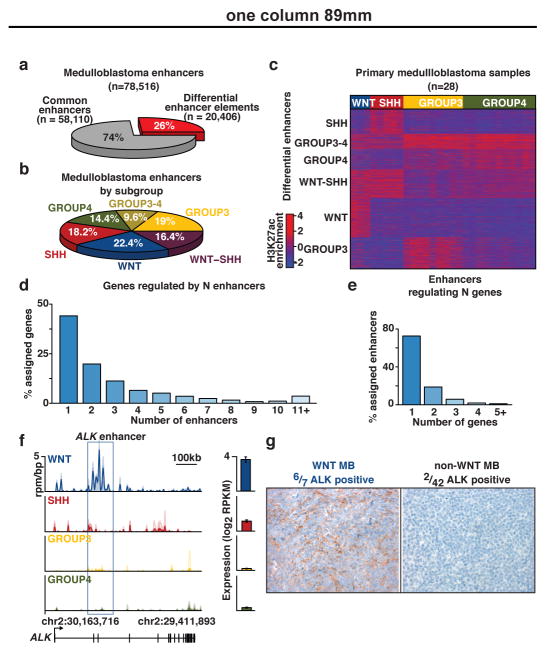
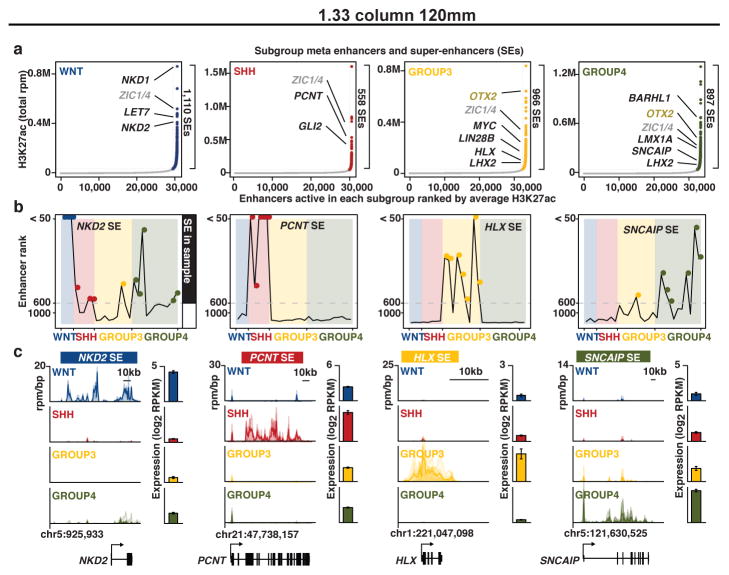
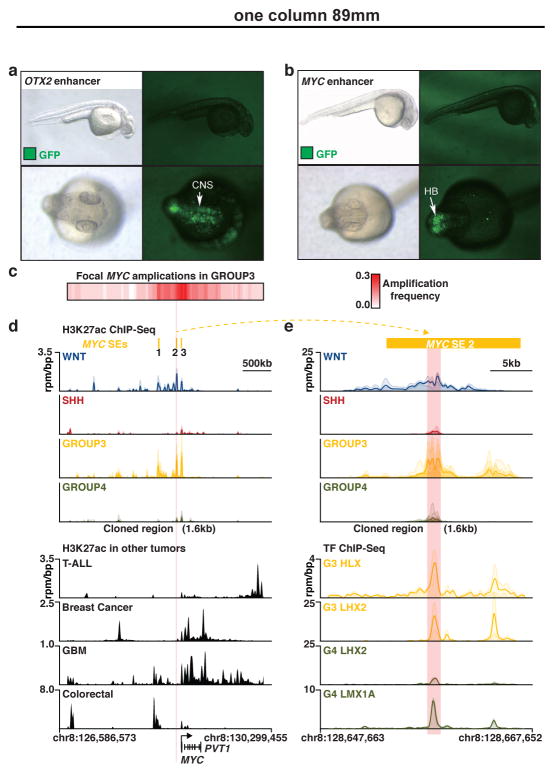
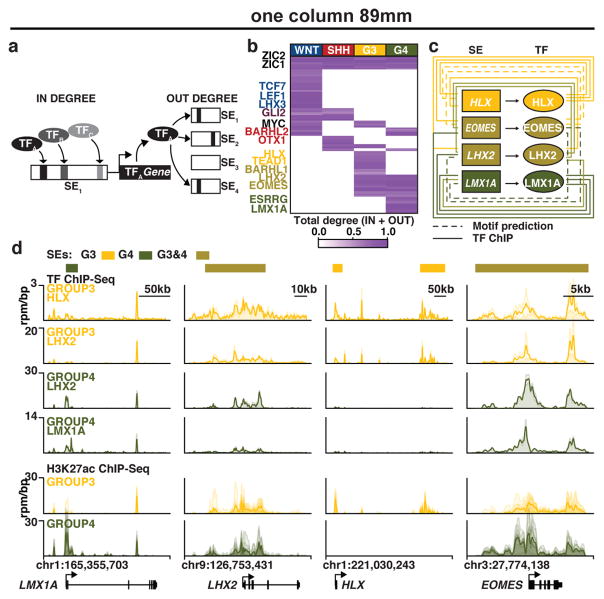
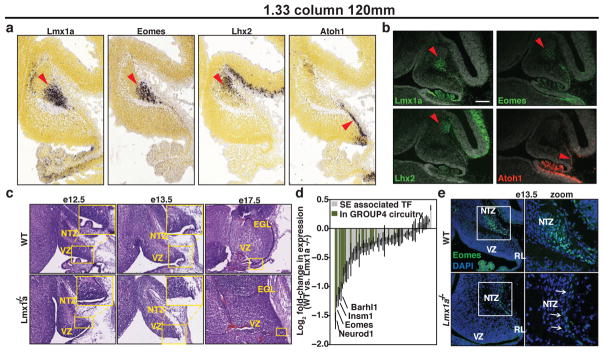
Medulloblastoma is a highly malignant paediatric brain tumour, often inflicting devastating consequences on the developing child. Genomic studies have revealed four distinct molecular subgroups with divergent biology and clinical behaviour. An understanding of the regulatory circuitry governing the transcriptional landscapes of medulloblastoma subgroups, and how this relates to their respective developmental origins, is lacking. Here, using H3K27ac and BRD4 chromatin immunoprecipitation followed by sequencing (ChIP-seq) coupled with tissue-matched DNA methylation and transcriptome data, we describe the active cis-regulatory landscape across 28 primary medulloblastoma specimens. Analysis of differentially regulated enhancers and super-enhancers reinforced inter-subgroup heterogeneity and revealed novel, clinically relevant insights into medulloblastoma biology. Computational reconstruction of core regulatory circuitry identified a master set of transcription factors, validated by ChIP-seq, that is responsible for subgroup divergence, and implicates candidate cells of origin for Group 4. Our integrated analysis of enhancer elements in a large series of primary tumour samples reveals insights into cis-regulatory architecture, unrecognized dependencies, and cellular origins.


Conflict of interest statement

The authors declare no competing financial interests.

Figures

Extended Data Figure 1 (accompanies 
<sans-serif>Figure 1</sans-serif>)
Extended Data Figure 1 (accompanies Figure 1). Enhancer landscape of primary medulloblastoma
(a) Experimental workflow for studying enhancers and super-enhancers in primary medulloblastomas. (b) H3K27ac ChIP-Seq data showing a highly active enhancer at the NEUROD1 locus across all 28 primary medulloblastoma samples from our series. (c) Scatter plots showing Pearson correlation of H3K27ac peaks called using either sample-matched WGS or whole cell extract (WCE) sequences as background for two samples from our series. (d) Saturation analysis showing the number of discreet enhancer regions identified as a function of increasing sample number (top), or the fraction of newly gained discreet enhancer regions as a function of increasing sample number (bottom). Error bars represent 95% confidence intervals obtained from 1,000 permutations of sample order. (e) Pie chart showing the genomic distribution of enhancer elements in medulloblastoma. (f) Heatmaps of ChIP-Seq data showing the scaled read densities for H3K27ac, BRD4, H3K4me1, and H3K27me3 in regions located ± 5kb from Group 3-specific H3K27ac (top panel) and H3K27me3 peak midpoints (bottom panel). (g) Histograms showing the fractional overlap of enhancers with focal amplifications (top) or focal deletions (bottom) in Group 3 and Group 4 medulloblastoma samples. The blue distributions represent expected fractional overlap generated from 10,000 random simulations. The red line depicts the actual observed fractional overlap with empirical p-value noted. (h) Scatter plot correlating average H3K27ac enrichment in Group 3 cell lines with average H3K27ac enrichment in Group 3 primary medulloblastomas. Enrichments are calculated for peaks called in primary Group 3 samples. (i) Venn diagram showing the overlap between H3K27ac peaks called for primary Group 3 medulloblastomas and Group 3 medulloblastoma cell lines.
Extended Data Figure 2 (accompanies 
<sans-serif>Figure 2</sans-serif>)
Extended Data Figure 2 (accompanies Figure 2). Enhancer/gene assignments in medulloblastoma
(a) Meta H3K27ac ChIP-Seq tracks of the Group 3-specific enhancers (E1 and E2) in the TAD containing ATP10A, GABRB3, and GABRA5. (b) Zoom in meta H3K27ac ChIP-Seq tracks of enhancer E1 from (a). (c–e) Scatter plots correlating sample-matched gene expression (log2 RPKM, x-axis) of ATP10A (c), GABRB3 (d), and GABRA5 (e) with H3K27ac enrichment (log2; y-axis) for the Group 3-specific enhancer shown in (b). (f) Zoom in meta H3K27ac ChIP-Seq tracks of enhancers E2 from (a). (g–i) Scatter plots correlating sample-matched gene expression (log2 RPKM, x-axis) of ATP10A (g), GABRB3 (h), and GABRA5 (i) with H3K27ac enrichment (log2; y-axis) for the Group 3-specific enhancer shown in (f). (j, k) 4C-Seq validation of TGFBR1 (j) and SMAD9 (k) enhancer/promoter interactions in a Group 3 cell line (HD-MB03).
Extended Data Figure 3 (accompanies 
<sans-serif>Figure 2</sans-serif>)
Extended Data Figure 3 (accompanies Figure 2). Enhancer-driven TGFβ activity in Group 3 medulloblastoma
(a) Functional annotation of target genes assigned to subgroup-specific enhancers based on their significant overlap with gene sets annotated in Gene Ontology (GO Biological Process) and pathway databases (KEGG, Reactome). (b) Waterfall plot discriminating the top 1,000 Group 3 and Group 4 subgroup-specific enhancers as defined by total H3K27ac signal. The distribution of assigned targets in Group 3, Group 4, and shared Group 3–4 targets are shown below the waterfall. (c) Convergence of Group 3-specific enhancers on TGFβ pathway genes. Subgroup-specific enhancers are summarized as nodes according to their respective medulloblastoma enhancer class – Group 3, Group 4, and shared Group 3/Group 4 – with edges representing individual enhancer/TGFβ pathway gene assignments. (d) Amplification of the TGFβ type II receptor, ACVR2A, in a Group 3 medulloblastoma from the ChIP-Seq cohort (MB-4M23). Log2 read depth data (tumour versus matched germline) derived from WGS data for this case is shown (upper panel). Highly active H3K27ac enhancer peaks overlapping the amplified ACVR2A locus are shown for the same case (lower panel). (e) Bar plot showing the difference in H3K27ac enhancer signal between MB-4M23 (ACVR2A-amplified Group 3 sample) and all other Group 3 samples. Bar plot shows H3K27ac log2 fold change at all enhancers regulating TGFβ component genes. Enhancers are ranked by increasing change in H3K27ac. Error bars represent standard error of the mean fold change.
Extended Data Figure 4 (accompanies 
<sans-serif>Figure 3</sans-serif>)
Extended Data Figure 4 (accompanies Figure 3). Features of medulloblastoma super-enhancers
(a) Unsupervised hierarchical clustering of primary medulloblastomas and cell lines using H3K27ac signal calculated at all SEs identified in each individual sample. (b) Meta tracks of H3K27ac ChIP-Seq signal for the ZIC1/ZIC4 SE locus. Expression (mean RPKM) for both ZIC4 (left) and ZIC1 (right) is displayed as bar graphs to the right of each H3K27ac track with error bars representing s.d. of the mean (n = 140 samples). (c) Line plot showing the enhancer rank for the ZIC1/ZIC4 SE locus across all samples according to subgroup. (d) Heatmap showing the SE association of known medulloblastoma driver genes and chromatin modifiers. Genes with called differential SEs are shaded black, whereas genes with proximal SEs (within 100kb of TSS) are shaded grey, according to their respective subgroup. (e) Bar plot showing the number of SE regions assigned to individual enhancer classes in medulloblastoma. (f) Bar plot of enhancer signal cross sample variance (y-axis) displayed as a fraction of the mean for SE enhancer constituents (left, black) or TE enhancer constituents (right, grey) identified in each medulloblastoma subgroup. (g) Boxplots of H3K27ac (left, blue) or BRD4 (right, red) enhancer signal at SEs or typical enhancers (TE) in their active group-specific context or in their inactive group context (e.g. for SEs or TEs present in Group 3, active group context includes all Group 3 samples and inactive group context includes all other samples). Differences in the means of the distributions is quantified by a Welch’s two-tailed t test (*** p<1e−9). (h) Dot plots of average H3K27ac enhancer signal in the constituents of SEs (left) or TEs (right) for enhancer constituents identified in WNT, SHH, Group 3, or Group 4 samples, respectively. Error bars represent standard deviation of the mean across all samples in a subgroup.
Extended Data Figure 5 (accompanies 
<sans-serif>Figure 4</sans-serif>)
Extended Data Figure 5 (accompanies Figure 4). In vivo validation of Group 3 and Group 4 medulloblastoma super-enhancers
(a) Summary of zebrafish reporter assays. (b) Pie chart showing the fraction of all tested medulloblastoma enhancer regions that demonstrate any CNS localized reporter activity. (c–l) Representative bright-field and fluorescence images of embryos (1 dpf) injected with individual enhancer-containing Tol2 vectors. Lateral views (60x) show GFP reporter expression in the whole body and dorsal views show GFP expression in the CNS (120x). White arrows indicate the locations of GFP signal. CNS, central nervous system; HB, hindbrain; MB, midbrain; CB, cerebellum; TC, telencephalon; RE, retina; OP, olfactory placode; TG, trigeminal ganglion. For each tested enhancer, meta tracks of H3K27ac ChIP-Seq signal across medulloblastoma subgroups for the cloned regulatory element are shown. (m) Heatmap showing H3K27ac enrichment at the +/− 250kb region flanking the medulloblastoma MYC SE described in Figure 4 (SE #2; panels f, h–j) across 77 Epigenome Roadmap tissues. Each row represents a single tissue. Each column represents a region of the MYC gene desert locus. Black shaded regions indicate the presence of H3K27ac enrichment. The samples are ordered by similarity of H3K27ac enrichment pattern. Notable clusters of mesoderm (MESO.), epithelial (EPI.), blood, brain, or GI lineage derived samples are noted. The cloned enhancer reporter region described in Figure 4 (panels f, h–j) is depicted as a vertical line and shows overlap with only 4/77 H3K27ac Epigenome Roadmap samples.
Extended Data Figure 6 (accompanies 
<sans-serif>Figure 5</sans-serif>)
Extended Data Figure 6 (accompanies Figure 5). Pathways regulated by super-enhancer associated transcription factors in medulloblastoma
(a) Functional pathways regulated by SE-associated TFs in medulloblastoma. (b) Heatmap of select subgroup-specific TFs showing their expression (left columns) and enhancer motif enrichment (right columns). Enhancer motif enrichment was calculated at differential enhancer elements in the respective enhancer classes.
Extended Data Figure 7 (accompanies 
<sans-serif>Figure 5</sans-serif>)
Extended Data Figure 7 (accompanies Figure 5). Medulloblastoma subgroup-specific transcription factors and their associated target genes
(a–d) Network of subgroup-specific TFs and their predicted target genes for WNT (a), SHH (b), Group 3 (c) and Group 4 (d) subgroups. Nodes represent subgroup-specific TFs. In each subgroup, node size is scaled and shaded according to the expression level of the TF and node font is scaled and shaded according to the number of inferred target genes (i.e. OUT degree). TF target genes are shown in red font scaled according to the number of TFs predicted to target that gene (i.e. IN degree).
Extended Data Figure 8 (accompanies 
<sans-serif>Figure 5</sans-serif>)
Extended Data Figure 8 (accompanies Figure 5). Super-enhancers define medulloblastoma regulatory circuitry
(a–d) Scatter plots of IN (x-axis) and OUT (y-axis) regulatory degree for SE-associated TFs in each medulloblastoma subgroup. (e–h) TF interaction networks for each medulloblastoma subgroup. Nodes represent the top 50% of SE-associated TFs in each subgroup as ranked by total degree (counter clockwise). Each node is colored by total degree and predicted binding interactions with other TF SEs are shown as edges. For Group 3 and Group 4 networks, edges validated by TF ChIP-Seq binding are colored. (i–l) Position weight matrices showing the top statistically enriched motif identified for each transcription factor at the top 10,000 bound enhancers in each subgroup. (m) Pie charts showing the fraction of predicted edges in each Group 3 and Group 4 TF networks that are validated by the presence of the respective TF ChIP-Seq binding at the enhancer. (n) Medulloblastoma subgroup distribution of shared, co-bound peaks for master regulatory TFs analysed by ChIP-Seq. TF binding is quantified as area under curve per peak (AUC/peak) in units of rpm. Differences in the means of the distributions is quantified by a Welch’s two-tailed t test (N.S. p > 0.1, ** p<1e−6). (o) Boxplot of protein-protein interaction frequency (y-axis) calculated from STRING database for pairs of SE-associated TFs showing patterns of subgroup-specific SE co-regulation (left) or randomized pairs (right).
Extended Data Figure 9 (accompanies 
<sans-serif>Figure 5</sans-serif>)
Extended Data Figure 9 (accompanies Figure 5). LMX1A, EOMES, and LHX2 are master transcriptional regulators of Group 4 medulloblastoma
(a) Subgroup-specific regulatory circuitry. Nodes are TFs associated with an SE in a subgroup-specific context. Edges indicate co-regulating TFs as defined by enrichment of TF binding motifs in respective regulatory regions. Edges validated by TF ChIP-Seq are coloured according to their respective subgroup association. (b) Network involving LHX2, LMX1A, and EOMES TFs and target genes inferred based on the presence of the respective TF motifs in Group 4-specific enhancers. Target genes are colored according to their validation status based on LMX1A and LHX2 ChIP-Seq, with genes arranged in the center of the network inferred to be targeted by all three master TFs. For visualization purposes, these common targets are displayed with a larger font size compared to the genes in the surrounding network.
Figure 1
Figure 1. The enhancer landscape of primary medulloblastoma
(a) Highly active enhancers at the OTX2 locus across 28 primary medulloblastomas. (b) H3K27ac versus BRD4 ChIP-Seq signals at medulloblastoma enhancers (n=78,516). (c) H3K27ac ChIP-Seq signal versus DNA methylation (WGBS) at medulloblastoma enhancers (n=78,516). (d) Group 3-specific eRNA expression (lower left) overlapping a Group 3-specific MYC enhancer (upper left) in a subset of medulloblastomas (n=6). MYC gene expression (RPKM) is also shown for the same cases (lower right). (e, f) Overlap of medulloblastoma enhancers with ENCODE and Roadmap enhancers.
Figure 2
Figure 2. Differentially regulated enhancers in medulloblastoma subgroups
(a) ANOVA classification of medulloblastoma enhancers. (b) Distribution of differentially regulated enhancers among medulloblastoma enhancer classes. (c) K-means clustering of differentially regulated medulloblastoma enhancers (n=20,406). (d) Proportion of enhancer/gene assignments to N enhancers. (e) Proportion of enhancer/gene assignments to N genes. (f) WNT-specific enhancer activity (rpm/bp) and expression (log2 RPKM, n=140) of ALK. Error bars represent standard deviation (s.d.) of the mean. (g) Immunohistochemical validation of ALK expression in WNT medulloblastoma patients (n=49).
Figure 3
Figure 3. Medulloblastoma super-enhancers characterize subgroup-specific identity
(a) Ranked enhancer plots defined across composite H3K27ac landscapes of WNT, SHH, Group 3, and Group 4 medulloblastomas. Select genes associated with SEs in each subgroup are highlighted and shaded according to enhancer class specificity. (b) Enhancer rankings for candidate subgroup-specific SEs across all samples according to subgroup. (c) Meta tracks of H3K27ac ChIP-Seq signal (rpm/bp) across medulloblastoma subgroups for the loci shown in (b). Candidate gene expression (mean RPKM) is shown to the right of each H3K27ac track (n=140). Error bars represent standard deviation (s.d.) of the mean.
Figure 4
Figure 4. In vivo validation of medulloblastoma super-enhancers
(a, b) Zebrafish reporter assays for OTX2 (a) and MYC (b) enhancers observed in medulloblastoma. Arrows indicate the locations of GFP signal. CNS, central nervous system; HB, hindbrain. (c) Heatmap summarizing MYC copy-number data derived from a published series of Group 3 medulloblastomas (n=168). (d, e) H3K27ac ChIP-Seq (upper panels) data showing a shared WNT/Group 3 MYC enhancer not found in other human cancers (d, lower panel) and occupied by SE-regulated TFs HLX, LHX2, and LMX1A as determined by TF ChIP-Seq (e, lower panel).
Figure 5
Figure 5. Super-enhancers characterize medulloblastoma regulatory circuitry
(a) Methodology for inferring medulloblastoma core regulatory circuitry. (b) Heatmap of all SE-associated TFs in medulloblastoma (rows) clustered by similarity of regulatory degree. Selected TFs with similar subgroup-specific patterns of regulatory degree are annotated. (c) Subgroup-specific regulatory circuitry in Group 3 and Group 4 medulloblastoma. (d) TF and H3K27ac ChIP-Seq meta tracks for the SE-regulated TFs LMX1A, LHX2, HLX, and EOMES.
Figure 6
Figure 6. Master transcription factors implicate Group 4 cellular origins
(a) Expression (In situ hybridization) of Lmx1a, Eomes, Lhx2, and Atoh1 in the embryonic cerebellum (e13.5). (b) Immunofluorescence microscopy for the TFs shown in (a) performed on sagittal sections of the e13.5 murine cerebellum. (c) H&E-stained cerebellar sections (sagittal) of wild-type and drJ/drJ (Lmx1a−/−) embryos. The RL is demarcated by a yellow box in each panel. (d) Differentially expressed TFs in the e13.5 RL of Lmx1a−/− embryos versus wild-type controls. Error bars represent standard error of the mean (n=3). (e) Immunofluorescence microscopy confirming Eomes down-regulation in Lmx1a−/− embryos (e13.5).

References

    1. Northcott PA, Korshunov A, Pfister SM, Taylor MD. The clinical implications of medulloblastoma subgroups. Nature reviews. Neurology. 2012;8:340–351. doi: 10.1038/nrneurol.2012.78. - DOI - PubMed
    1. Jones DT, et al. Dissecting the genomic complexity underlying medulloblastoma. Nature. 2012;488:100–105. doi: 10.1038/nature11284. - DOI - PMC - PubMed
    1. Northcott PA, et al. Enhancer hijacking activates GFI1 family oncogenes in medulloblastoma. Nature. 2014;511:428–434. doi: 10.1038/nature13379. - DOI - PMC - PubMed
    1. Northcott PA, et al. Subgroup-specific structural variation across 1,000 medulloblastoma genomes. Nature. 2012;488:49–56. doi: 10.1038/nature11327. - DOI - PMC - PubMed
    1. Northcott PA, et al. Medulloblastomics: the end of the beginning. Nature reviews. Cancer. 2012;12:818–834. doi: 10.1038/nrc3410. - DOI - PMC - PubMed

Publication types

MeSH terms

Substances