. 2016 Jun;48(3):175-88.
doi: 10.1007/s10863-016-9644-1. Epub 2016 Jan 27.

Mg(2+) differentially regulates two modes of mitochondrial Ca(2+) uptake in isolated cardiac mitochondria: implications for mitochondrial Ca(2+) sequestration

Affiliations

Mg(2+) differentially regulates two modes of mitochondrial Ca(2+) uptake in isolated cardiac mitochondria: implications for mitochondrial Ca(2+) sequestration

Christoph A Blomeyer et al. J Bioenerg Biomembr. 2016 Jun.

Abstract

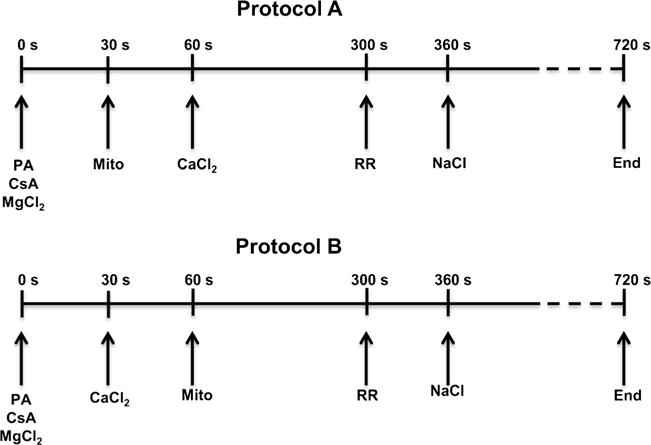
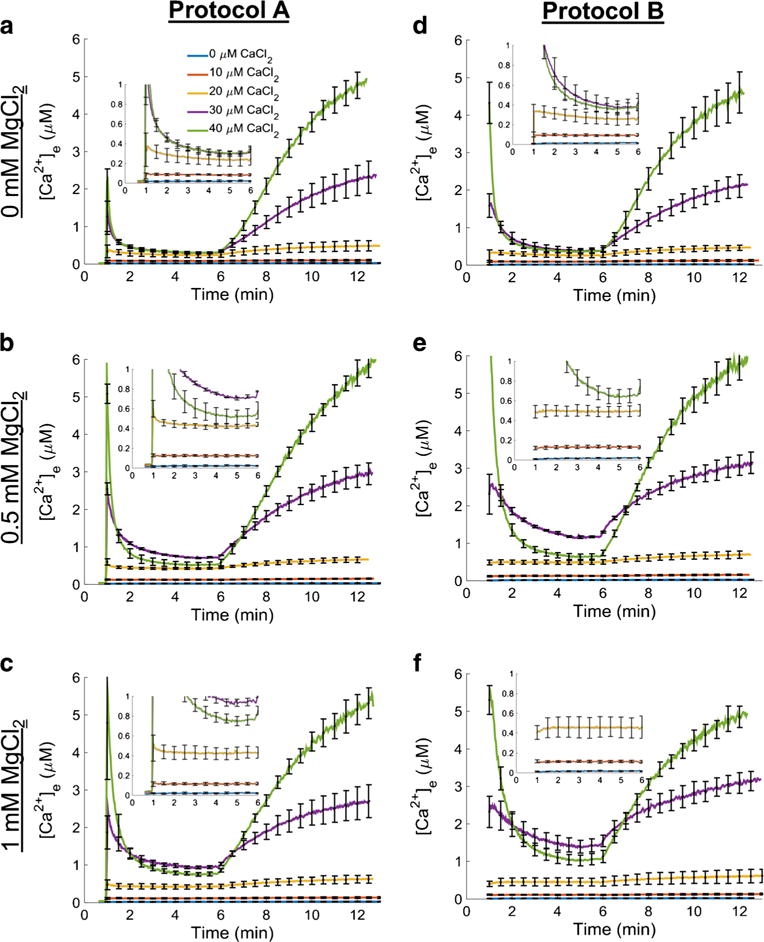
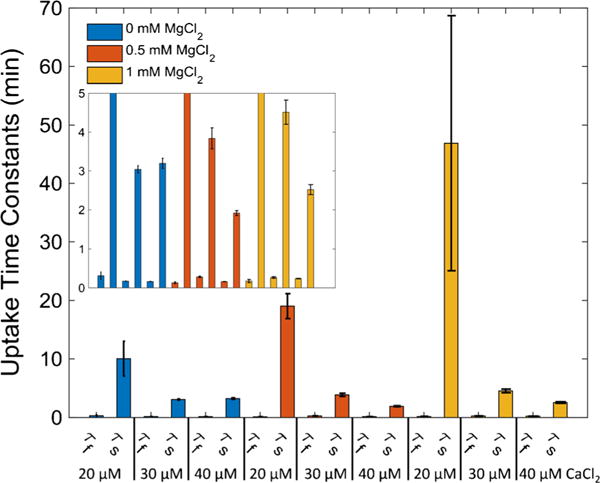
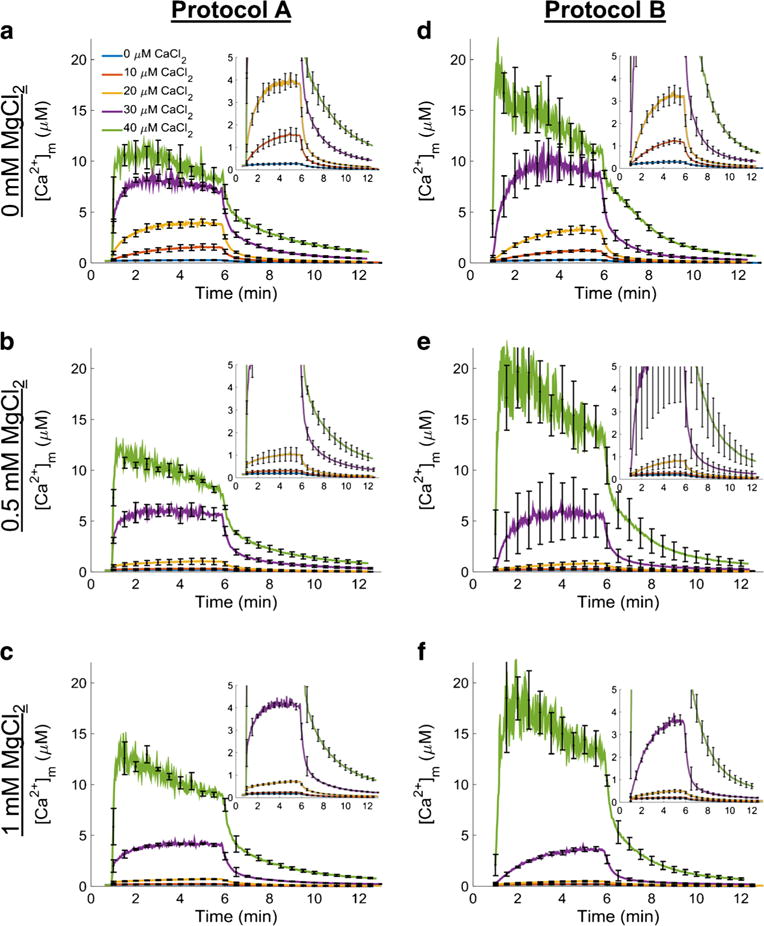
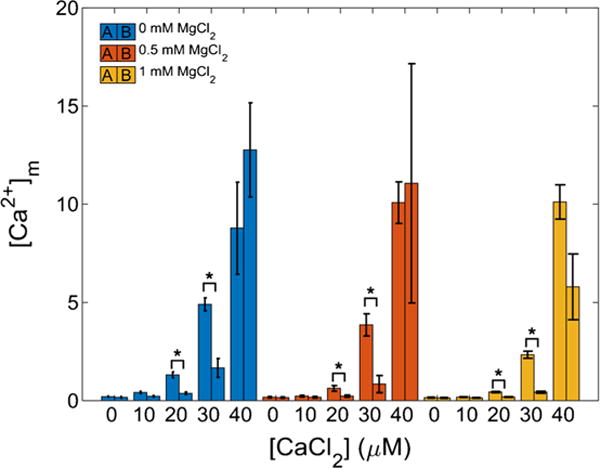
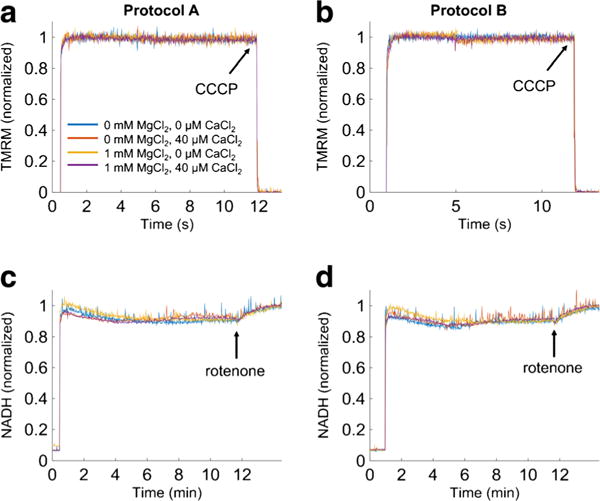
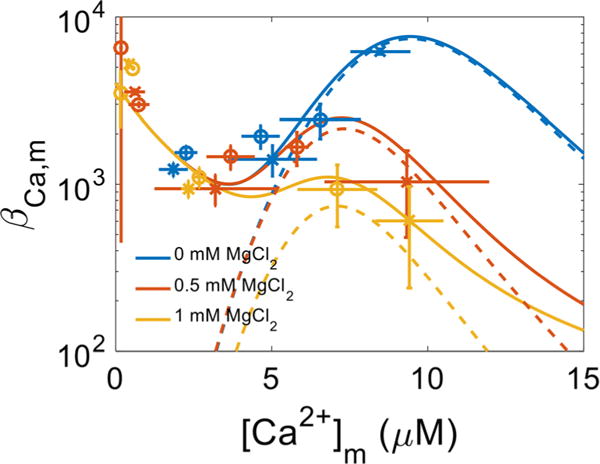
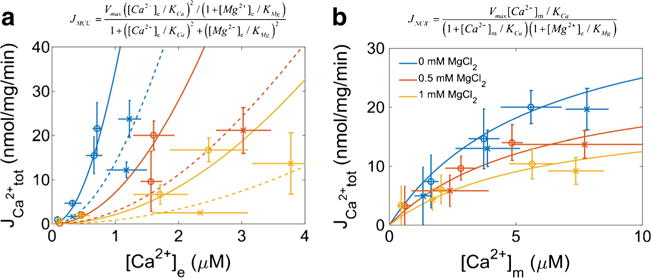
The manner in which mitochondria take up and store Ca(2+) remains highly debated. Recent experimental and computational evidence has suggested the presence of at least two modes of Ca(2+) uptake and a complex Ca(2+) sequestration mechanism in mitochondria. But how Mg(2+) regulates these different modes of Ca(2+) uptake as well as mitochondrial Ca(2+) sequestration is not known. In this study, we investigated two different ways by which mitochondria take up and sequester Ca(2+) by using two different protocols. Isolated guinea pig cardiac mitochondria were exposed to varying concentrations of CaCl2 in the presence or absence of MgCl2. In the first protocol, A, CaCl2 was added to the respiration buffer containing isolated mitochondria, whereas in the second protocol, B, mitochondria were added to the respiration buffer with CaCl2 already present. Protocol A resulted first in a fast transitory uptake followed by a slow gradual uptake. In contrast, protocol B only revealed a slow and gradual Ca(2+) uptake, which was approximately 40 % of the slow uptake rate observed in protocol A. These two types of Ca(2+) uptake modes were differentially modulated by extra-matrix Mg(2+). That is, Mg(2+) markedly inhibited the slow mode of Ca(2+) uptake in both protocols in a concentration-dependent manner, but not the fast mode of uptake exhibited in protocol A. Mg(2+) also inhibited Na(+)-dependent Ca(2+) extrusion. The general Ca(2+) binding properties of the mitochondrial Ca(2+) sequestration system were reaffirmed and shown to be independent of the mode of Ca(2+) uptake, i.e. through the fast or slow mode of uptake. In addition, extra-matrix Mg(2+) hindered Ca(2+) sequestration. Our results indicate that mitochondria exhibit different modes of Ca(2+) uptake depending on the nature of exposure to extra-matrix Ca(2+), which are differentially sensitive to Mg(2+). The implications of these findings in cardiomyocytes are discussed.

Keywords: Calcium efflux; Calcium sequestration; Calcium uptake; Cardiac; Mitochondria.


Figures

Fig. 1
Fig. 1
Timelines show the two experimental protocols used to characterize and quantify mitochondrial Ca2+ handling (influx, efflux, sequestration) in isolated guinea pig cardiac mitochondria. In protocol A, mitochondria were added to the experimental buffer before CaCl2 was added. In protocol B, mitochondria were added to respiration buffer with CaCl2 already present. All other additions were identical between protocols. 40 μM EGTA was present in all the experimental buffers; 0.5 μM CsA was added to all mitochondrial suspensions. Inset axes are the same as the main figure panels
Fig. 2
Fig. 2
Extra-matrix free Ca2+ ([Ca2+]e) dynamics. Ca2+ uptake and Ca2+ release for each combination of CaCl2 and MgCl2 concentrations are shown using the protocol depicted in Fig. 1. CaCl2 was added to respiring mitochondrial suspension (left column; protocol A) or mitochondria were added to the buffer containing a given CaCl2 concentration (right column; protocol B) at 60 s followed by ruthenium red (RR) at 300 s and NaCl at 360 s. The results for protocol A are shown in the left column and the results for protocol B are shown in the right column. Each row corresponds to the buffer MgCl2 indicated on the left of each row. Insets show [Ca2+]e dynamics for 0, 10, and 20 μM CaCl2 in more detail. The axes are the same as the axes in the main figure panels. Error bars signify standard error of the mean
Fig. 3
Fig. 3
Two modes of Ca2+ uptake. For CaCl2 concentrations of 20 μM and greater, a double exponential function was fit between 65 s and 150 s to the [Ca2+]e dynamics observed in protocol A (Fig. 2). The fit time constants show that there was a fast and slow component of Ca2+ uptake associated with each bolus of CaCl2 administered. The inset axes labels are the same as the main figure panel. Error bars signify propagated standard deviations
Fig. 4
Fig. 4
Matrix free Ca2+ ([Ca2+]m) dynamics. Ca2+ uptake and Ca2+ release for each combination of CaCl2 and MgCl2 concentrations are shown using the protocol depicted in Fig. 1. CaCl2 was added to the respiring mitochondrial suspension (left column; protocol A) or mitochondria were added to the buffer containing a given CaCl2 concentration (right column; protocol B) at 60 s followed by ruthenium red (RR) at 300 s and NaCl at 360 s. The results for protocol A are shown in the left column and the results for protocol B in the right column. In protocol B when CaCl2 was 40 μM, the fluorescent signal was close to Rmax, so the calculated [Ca2+]m is likely an overestimation of the true value of [Ca2+]m. Each row corresponds to the buffer MgCl2 indicated on the left of each row. Insets show [Ca2+]m dynamics for 0, 10, and 20 μM CaCl2 in more detail. The axes are the same as the axes in the main figure panels. Error bars signify standard error of the mean
Fig. 5
Fig. 5
Ca2+ uptake by mitochondria. The amount of Ca2+ uptake by mitochondria depends on method of CaCl2 delivery. The bar plots show [Ca2+]m just after addition of CaCl2 to mitochondria (protocol A, left bar) or after addition of mitochondria to buffer containing CaCl2 (protocol B, right bar). These data correspond to a time of approximately 65 s. For all 20 and 30 μM CaCl2 conditions, the rate of Ca2+ uptake in protocol A was significantly different from that of protocol B (p ≤ 0.05) for most of the [CaCl2] and even in the presence of Mg2+. Error bars signify standard error of the mean
Fig. 6
Fig. 6
ΔΨm and NADH dynamics. The bioenergetics responses during protocols A and B were monitored in parallel using the ΔΨm sensitive dye TMRM and NADH autofluorescence. Traces are individual recordings. In averaged data there were no significant differences between the two MgCl2 and CaCl2 groups. The increases in signals mark the addition of mitochondria at 30 s (protocol A) and at 60 s (protocol B). The number of experimental groups was reduced to consist of only 0 and 1 mM MgCl2 and 0 and 40 μM CaCl2
Fig. 7
Fig. 7
Mitochondrial Ca2+ buffering power. The Ca2+ sequestration system consists of at least two classes of buffers that bind Ca2+ with a differential affinity and capacity. Class 1 buffers are of the prototypical type whereby a single Ca2+ ion binds to a single site in an uncooperative manner. Class 2 buffers are atypical and bind multiple Ca2+ ions in a cooperative fashion. Class 1 buffers are not affected by Mg2+; however, in the presence of Mg2+, both the binding capacity and affinity of the Class 2 buffers are compromised. The blue, yellow and red colors correspond to the added 0 mM MgCl2, 0.5 mM MgCl2 and 1 mM MgCl2 conditions, respectively. The circles (O) and x’s (x) represent rates obtained using the data from Protocols A and B, respectively. The lines correspond to model simulations of the two classes of Ca2+ buffers using Eq. 2 with the parameters listed in Table 1. Error bars signify propagated standard deviations. Dashed lines represent contributions to mitochondrial buffering power from the class 2 buffers only
Fig. 8
Fig. 8
Mg2+ inhibition of Ca2+ uptake and extrusion. Panel 8a shows slow mode of Ca2+ uptake (via MCU) was attenuated by extra-matrix Mg2+ in the physiological concentration range. The model parameters for the simplified MCU model are: Vmax, 900 nmol/mg/min; KCa, 6 μM; and KMg, 0.3 mM. Solid lines correspond to slow mode of MCU rates observed during protocol A, and dotted lines correspond to the slow mode of MCU rates observed during protocol B. The rates of Ca2+ uptake in protocol B were approximately 40 % of the rates observed in protocol A. Panel 8b shows buffer Mg2+ in the physiological range used in this study also affected the rate of Ca2+ efflux (via mNCE). The model parameters for the simplified NCE are: Vmax, 40 nmol/mg/min; KCa, 5 μM; and KMg, 1 mM. The blue, yellow and red colors correspond to the 0 mM MgCl2, 0.5 mM MgCl2 and 1 mM MgCl2 conditions, respectively. Extra-matrix [Na+] was assumed constant (10 mM) and thus not included in the equation. The circles (O) and x’s (x) represent rates obtained using the data from Protocols A and B, respectively. The lines correspond to model simulations with the equations given above their respective panels. Error bars signify propagated standard deviations

References

    1. Agarwal B, Camara AK, Stowe DF, Bosnjak ZJ, Dash RK. Enhanced charge-independent mitochondrial free Ca(2+) and attenuated ADP-induced NADH oxidation by isoflurane: implications for cardioprotection. Biochim Biophys Acta. 2012;1817(3):453–465. doi: 10.1016/j.bbabio.2011.11.011. - DOI - PMC - PubMed
    1. Agarwal B, Dash RK, Stowe DF, Bosnjak ZJ, Camara AK. Isoflurane modulates cardiac mitochondrial bioenergetics by selectively attenuating respiratory complexes. Biochim Biophys Acta. 2014;1837(3):354–365. doi: 10.1016/j.bbabio.2013.11.006. - DOI - PMC - PubMed
    1. Aldakkak M, Camara AK, Heisner JS, Yang M, Stowe DF. Ranolazine reduces Ca2+ overload and oxidative stress and improves mitochondrial integrity to protect against ischemia reperfusion injury in isolated hearts. Pharmacol Res. 2011;64(4):381–392. doi: 10.1016/j.phrs.2011.06.018. - DOI - PMC - PubMed
    1. Aldakkak M, Stowe DF, Dash RK, Camara AK. Mitochondrial handling of excess Ca2+ is substrate-dependent with implications for reactive oxygen species generation. Free Radic Biol Med. 2013;56:193–203. doi: 10.1016/j.freeradbiomed.2012.09.020. - DOI - PMC - PubMed
    1. An J, Varadarajan SG, Camara A, Chen Q, Novalija E, Gross GJ, et al. Blocking Na(+)/H(+) exchange reduces [Na(+)](i) and [Ca(2+)](i) load after ischemia and improves function in intact hearts. Am J Physiol Heart Circ Physiol. 2001a;281(6):H2398–H2409. - PubMed

Publication types

LinkOut - more resources