. 2016 Jul;68(7):1614-26.
doi: 10.1002/art.39608.

Critical Role of Glucose Metabolism in Rheumatoid Arthritis Fibroblast-like Synoviocytes

Affiliations

Critical Role of Glucose Metabolism in Rheumatoid Arthritis Fibroblast-like Synoviocytes

Ricard Garcia-Carbonell et al. Arthritis Rheumatol. 2016 Jul.

Abstract

Objective: Up-regulation of glucose metabolism has been implicated not only in tumor cell growth but also in immune cells upon activation. However, little is known about the metabolite profile in rheumatoid arthritis (RA), particularly in fibroblast-like synoviocytes (FLS). This study was undertaken to evaluate whether changes in glucose metabolism in RA FLS could play a role in inflammation and joint damage.

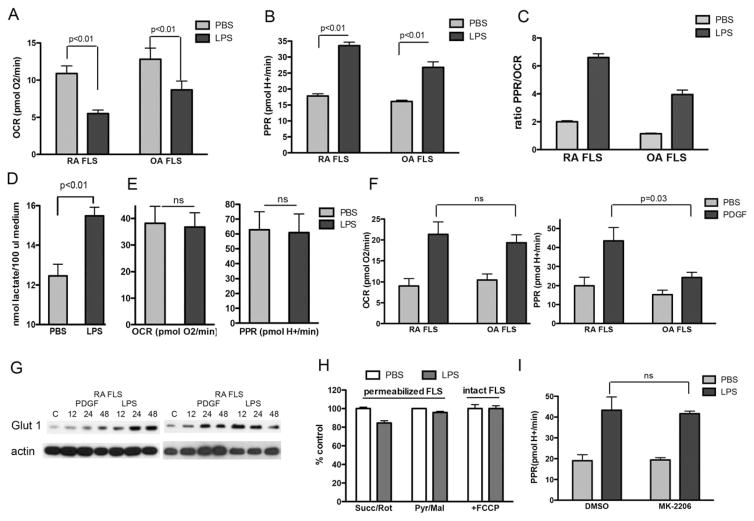
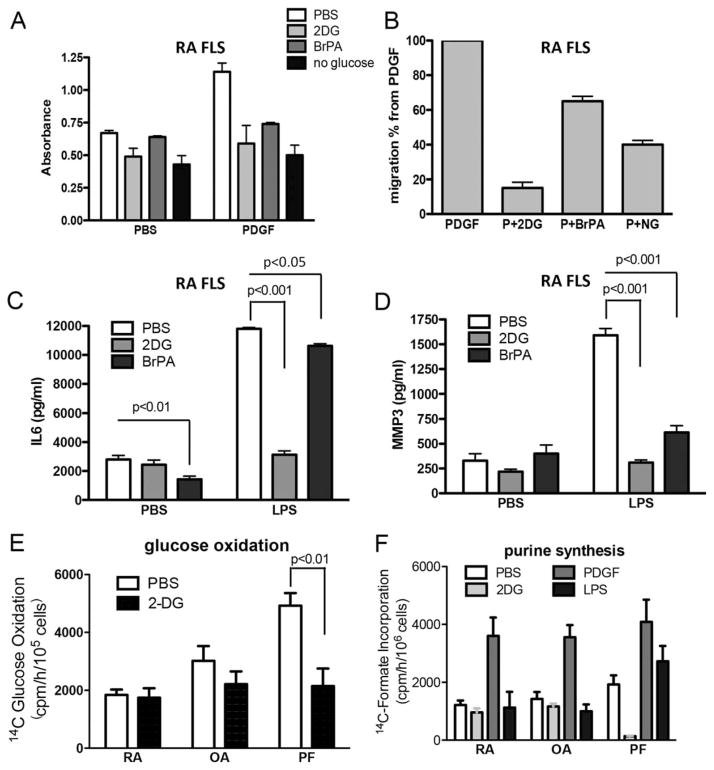
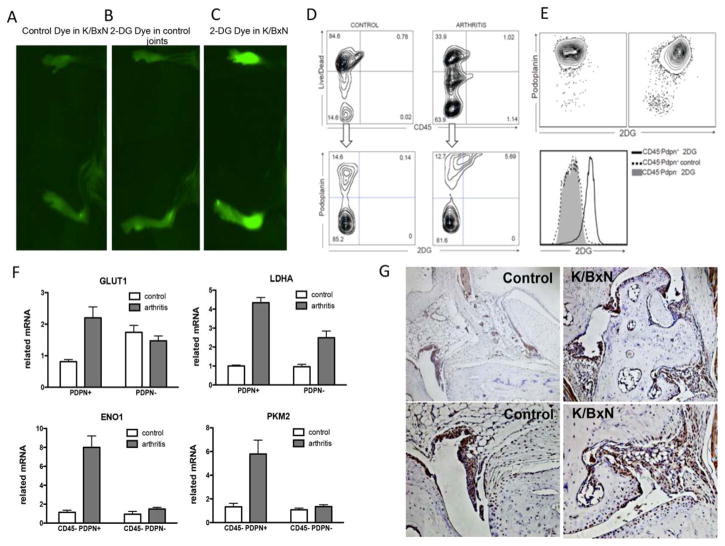
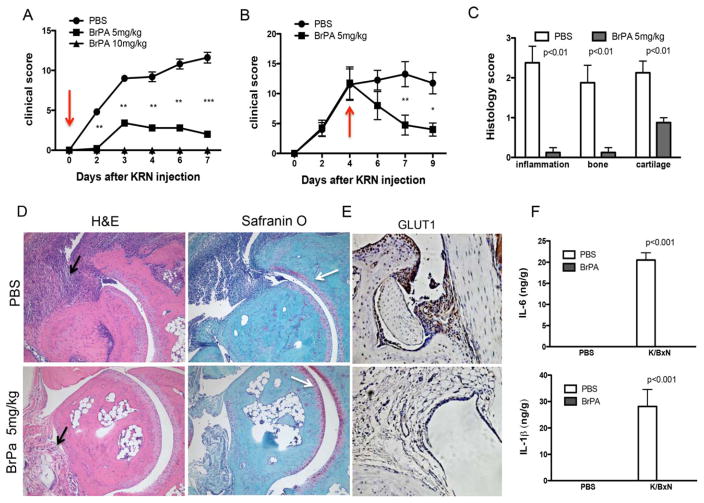
Methods: Synovium and FLS were obtained from patients with RA and patients with osteoarthritis (OA). The rate of glycolysis after stimulation of FLS with lipopolysaccharide and platelet-derived growth factor BB was measured using glycolysis stress test technology. FLS function was evaluated using a glycolysis inhibitor, 2-deoxy-d-glucose (2-DG). After stimulation of the FLS, a migration scratch assay, MTT assay, and enzyme-linked immunosorbent assay were performed to measure the effect of 2-DG on FLS migration, viability of the FLS, and cytokine secretion, respectively. IRDye 800CW 2-DG was used to assess glucose uptake in the arthritic joints and stromal cells of mice after K/BxN mouse serum transfer. The mice were injected daily, intraperitoneally, with 3-bromopyruvate (BrPa; 5 mg/kg) to assess the effect of inhibition of glycolysis in vivo.

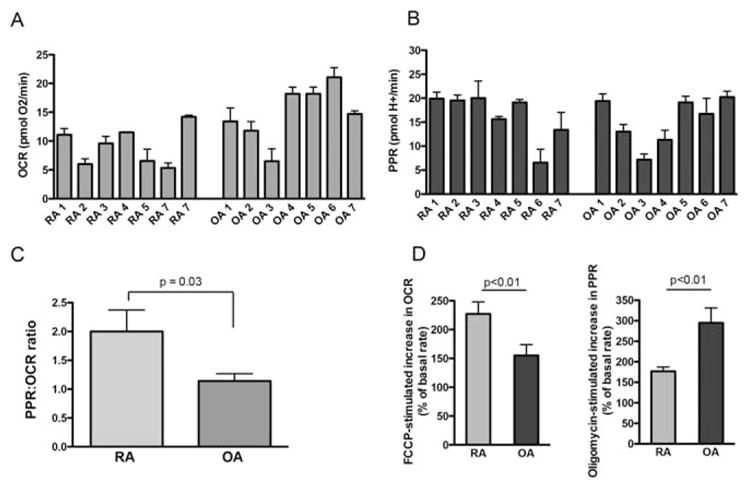
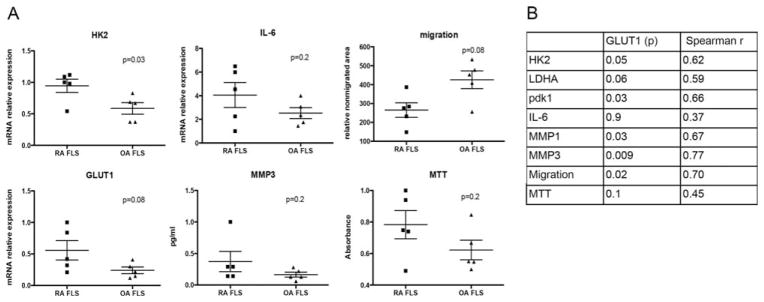
Results: Compared to human OA FLS, the balance between glycolysis and oxidative phosphorylation was shifted toward glycolysis in RA FLS. Glucose transporter 1 (GLUT1) messenger RNA (mRNA) expression correlated with baseline functions of the RA FLS. Glucose deprivation or incubation of the FLS with glycolytic inhibitors impaired cytokine secretion and decreased the rate of proliferation and migration of the cells. In a mouse model of inflammatory arthritis, GLUT1 mRNA expression in the synovial lining cells was observed, and increased levels of glucose uptake and glycolytic gene expression were detected in the stromal compartment of the arthritic mouse joints. Inhibition of glycolysis by BrPa, administered in vivo, significantly decreased the severity of arthritis in this mouse model.

Conclusion: Targeting metabolic pathways is a novel approach to understanding the mechanisms of disease. Inhibition of glycolysis may directly modulate synoviocyte-mediated inflammatory functions and could be an effective treatment strategy for arthritis.


Figures

Figure 1
Figure 1
Baseline levels of mitochondrial respiration in fibroblast-like synoviocytes (FLS). A and B, Basal rates of mitochondrial respiration (oxygen consumption rate [OCR]) in 7 rheumatoid arthritis (RA) cell lines and 7 osteoarthritis (OA) cell lines (A), and the proton production rate (PPR) in the same cell lines (B). Values are the mean±SEM pooled results from 5 technical replicates (2–5 biologic replicates for each cell line, with 5 technical replicates for each cell line per experiment). C, PPR:OCR ratio in pooled RA FLS and OA FLS. D, FCCP-stimulated increase in the OCR (left) and oligomycin-stimulated increase in the PPR (right), expressed as a percentage increase from the basal rate, in pooled RA FLS and OA FLS. Values in C and D are the mean±SEM pooled results from the same cells as in A and B.
Figure 2
Figure 2
Correlation of glucose transporter 1 (GLUT1) mRNA expression with baseline FLS functions. A, Expression of select genes, as assessed by quantitative polymerase chain reaction, in RA FLS and OA FLS (n=5 cell lines per group), and migration and viability (as determined by MTT assay) of the FLS. Each symbol represents an individual sample; bars show the mean±SEM. B, Correlations of GLUT1 mRNA expression with the expression levels of select genes in the FLS and with migration and viability of the FLS. P values and Spearman’s correlation coefficients are shown. See Figure 1 for definitions.
Figure 3
Figure 3
FLS respiration following exposure to inflammatory mediators. A–C, RA FLS and OA FLS (n=7 cell lines per group) were stimulated with lipopolysaccharide (LPS; 1 μg/ml), or phosphate buffered saline (PBS) as vehicle control, for 24 hours, followed by measurement of the OCR (A), rate of proton efflux (PPR) (B), and PPR:OCR ratio (C). Values are the mean±SEM pooled results from 2–4 biologic replicates for each cell line, with 5 technical replicates for each cell line per experiment. D, The lactate concentration was measured in supernatants of cultured RA FLS (n=7 cell lines) after 24 hours of stimulation with LPS (1 μg/ml) or PBS vehicle control. E, The OCR and PPR were determined in human pulmonary fibroblasts (n=3 cell lines) after 24 hours of stimulation with LPS (1 μg/ml) or PBS vehicle control. Values are the mean±SEM pooled results from 1–3 biologic replicates, with 5 technical replicates for each cell line per experiment. F, The OCR and PPR were determined in RA FLS and OA FLS (n=6 cell lines per group) after 24 hours of stimulation with platelet-derived growth factor (PDGF; 10 ng/ml) or PBS vehicle control. Values are the mean±SEM pooled results from 5 technical replicates for each cell line. G, RA FLS (n=2 cell lines) were stimulated with either PDGF (10 ng/ml) or LPS (1 μg/ml) for 12, 24, or 48 hours, and glucose transporter 1 (GLUT-1) protein expression was determined by Western blotting. The control (C) comprised unstimulated FLS at 48 hours. H, RA FLS (n=3 cell lines) were incubated for 24 hours with LPS (1 μg/ml) or PBS vehicle control, and permeabilized cell respiration was then measured in the presence of either succinate plus rotenone (Succ/Rot) or pyruvate plus malate (Pyr/Mal) as substrates. In addition, the pooled rate of FCCP uncoupler–stimulated respiration was determined in 3 intact RA FLS cell lines following 24 hours of exposure to LPS. I, The PPR was determined in 4 different RA FLS cell lines after stimulation with LPS for 24 hours in the absence or presence of the Akt inhibitor MK-2206 (5 μM). Values in D, H, and I are the mean±SEM. NS=not significant (see Figure 1 for other definitions).
Figure 4
Figure 4
Effect of glycolytic inhibition on FLS functions. A, RA FLS were cultured in the presence of platelet-derived growth factor (PDGF; 10 ng/ml) or phosphate buffered saline (PBS) as vehicle control, with or without pretreatment with 2-deoxy-D-glucose (2-DG; 50 mM in PBS) or 3-bromopyruvate (BrPa; 25 μM in PBS) or no glucose (NG) medium. Cellular proliferation was determined on day 4 using an MTT assay. B, Migration of the RA FLS was assessed in the presence of PDGF (10 ng/ml) alone or PDGF (P) along with 2-DG, BrPA, or NG medium. C and D, RA FLS were cultured in the presence of lipopolysaccharide (LPS; 1 μg/ml) or PBS as vehicle control, with or without pretreatment with 2-DG (50 mM) or BrPa (25 μM). Supernatants from the RA cell cultures were prepared after 24 hours of LPS stimulation and were analyzed for secretion of interleukin-6 (IL-6) (C) and matrix metalloproteinase 3 (MMP-3) (D). Results in A–D are pooled from 4 different cell lines. E, Glucose oxidation was determined in RA FLS, OA FLS, or primary human pulmonary fibroblasts (PFs) in the presence or absence of 2-DG (50 mM). Results are pooled from 3 different cell lines assayed in duplicate. F, RA FLS, OA FLS, and PFs were stimulated with or without 2-DG (50 mM), PDGF (10 ng/ml), or LPS (1 μM) for a total of 8 hours, and purine synthesis was determined. Results are pooled from 3 different cell lines assayed in triplicate. Values are the mean±SEM. See Figure 1 for other definitions.
Figure 5
Figure 5
Glucose metabolism, as assessed using fluorescent 2-deoxy-D-glucose (2-DG) as a reporter, is increased in fibroblast-like synoviocytes from the joints of arthritic mice. A–C, Images of IRDye 800CW fluorescence intensity (mean±SD excitation 730±42 nm, emission 800 nm long pass) was assessed 24 hours after intravenous injection of IRDye 800CW carboxyl control dye in arthritic mice (A), IRDye 800CW 2-DG dye in nonarthritic control mice (B), or IRDye 800CW 2-DG dye in arthritic mice (C). D, Control and arthritic mice were injected with IRDye 800CW 2-DG on day 5 after arthritis induction, and 24 hours later, the joints were digested and stained with anti-CD45 and anti-podoplanin (anti-PDPN) antibodies. Plots show the 2-DG staining in the live CD45− cell population. E, Single cells were enriched for CD45−PDPN+ cells. Plots show the 2-DG staining in both the PDPN+ and PDPN− cell populations. F, Populations of CD45−PDPN+ and CD45−PDPN− cells obtained after enrichment were analyzed by quantitative polymerase chain reaction for the expression of selected genes. Values are the mean± SEM of 4 mice per group. G, Sections of the ankle joints of control nonarthritic mice and arthritic K/BxN mice were stained for GLUT1 expression on day 7 after arthritis induction. Representative results are shown. Original magnification × 100 in top panels; × 200 in bottom panels.
Figure 6
Figure 6
Glycolytic inhibition decreases histologic scores and levels of inflammatory mediators in the K/BxN mouse model of arthritis. A and B, Clinical arthritis scores were determined in phosphate buffered saline (PBS)–treated animals and 3-bromopyruvate (BrPa)–treated animals after injection of 150 μl of K/BxN mouse serum on day 0. Treatment with BrPa was administered every day from day 0 (arrow) at doses of 5 mg/kg or 10 mg/kg (A) or administered every day from day 4 (arrow) to day 9 at a dose of 5 mg/kg (B). Values are the mean±SEM of 5 mice per group. * =P<0.05; **=P<0.01; ***=P<0.001. C, Histologic scores were determined on day 7 after serum transfer in PBS-treated or BrPA-treated mice. D, Sections of the ankle joints of PBS-treated or BrPA-treated mice were stained with hematoxylin and eosin (H&E) or Safranin O on day 7 after arthritis induction. Black arrows indicate joint inflammation, and white arrows highlight cartilage damage, which was reduced in BrPa-treated mouse ankles. Representative results are shown. Original magnification × 200. E, Sections of the ankle joints of PBS-treated or BrPA-treated mice were stained for GLUT1 expression on day 7 after arthritis induction. Representative results are shown. Original magnification × 200. F, Mice were injected with K/BxN mouse serum to induce arthritis or injected with PBS alone as the nonarthritic control on day 0, and then treated with either PBS or BrPa (5 mg/kg). Levels of interleukin-6 (IL-6) and IL-1β in the mouse joints were analyzed by enzyme-linked immunosorbent assay on day 5 after serum transfer. Values in C and F are the mean±SEM in 5 mice per group.

References

    1. Firestein GS. Evolving concepts of rheumatoid arthritis. Nature. 2003;423:356–61. - PubMed
    1. Bartok B, Firestein GS. Fibroblast-like synoviocytes: key effector cells in rheumatoid arthritis. Immunol Rev. 2010;233:233–55. - PMC - PubMed
    1. Bottini N, Firestein GS. Duality of fibroblast-like synoviocytes in RA: passive responders and imprinted aggressors. Nat Rev Rheumatol. 2013;9:24–33. - PMC - PubMed
    1. Cairns RA, Harris IS, Mak TW. Regulation of cancer cell metabolism. Nat Rev Cancer. 2011;11:85–95. - PubMed
    1. Vander Heiden MG, Cantley LC, Thompson CB. Understanding the Warburg effect: the metabolic requirements of cell proliferation. Science. 2009;324:1029–33. - PMC - PubMed

Publication types