

Skeletal Characterization of Smurf2-Deficient Mice and In Vitro Analysis of Smurf2-Deficient Chondrocytes
- PMID: 26815610
- PMCID: PMC4729489
- DOI: 10.1371/journal.pone.0148088
Skeletal Characterization of Smurf2-Deficient Mice and In Vitro Analysis of Smurf2-Deficient Chondrocytes
Abstract
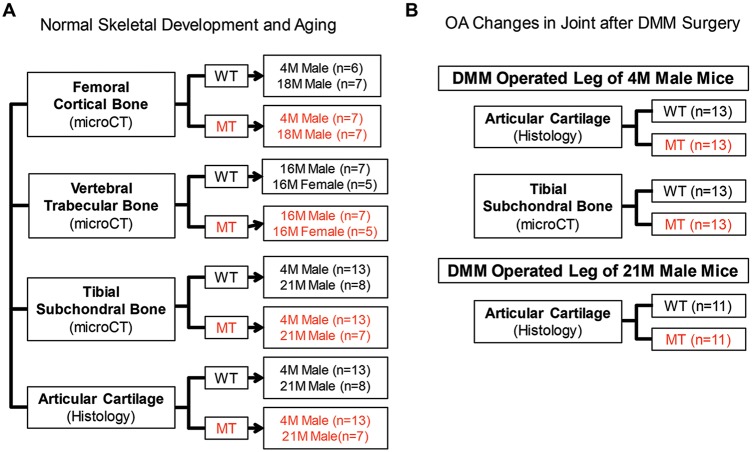
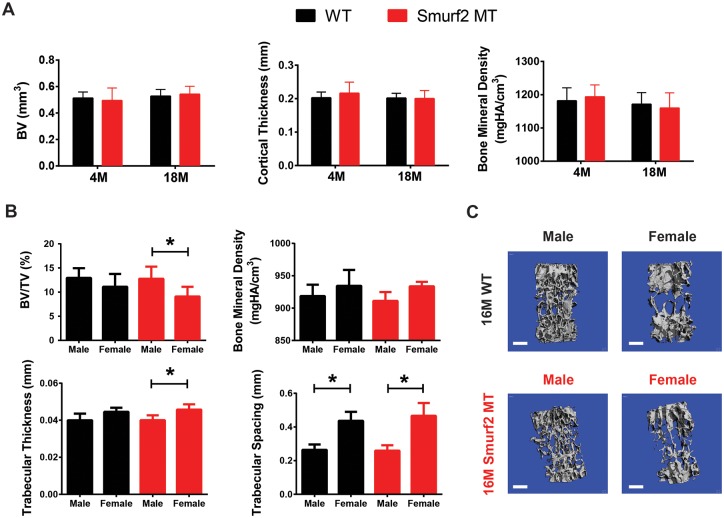
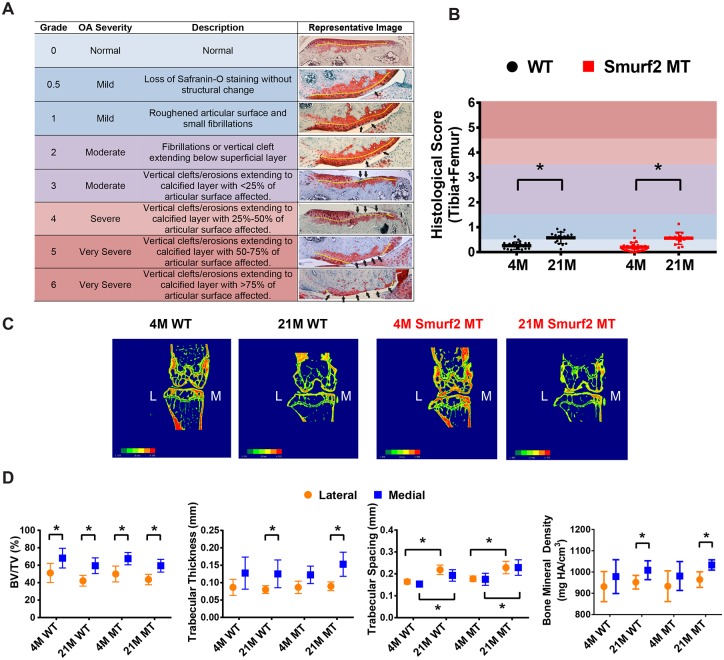
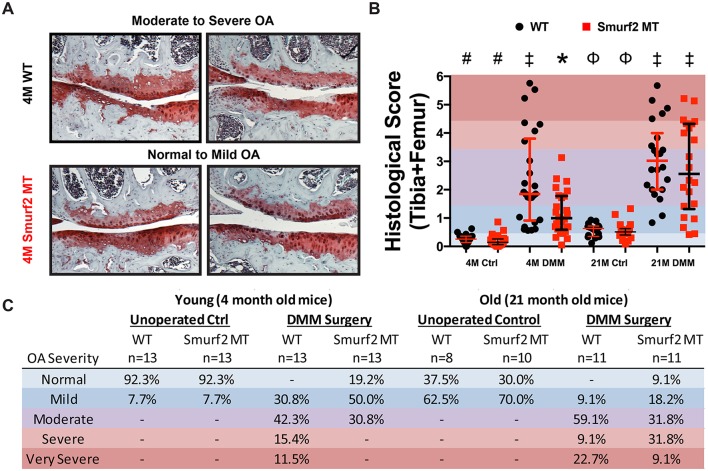
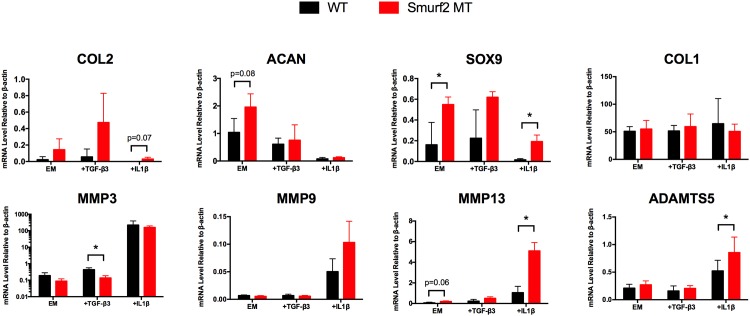
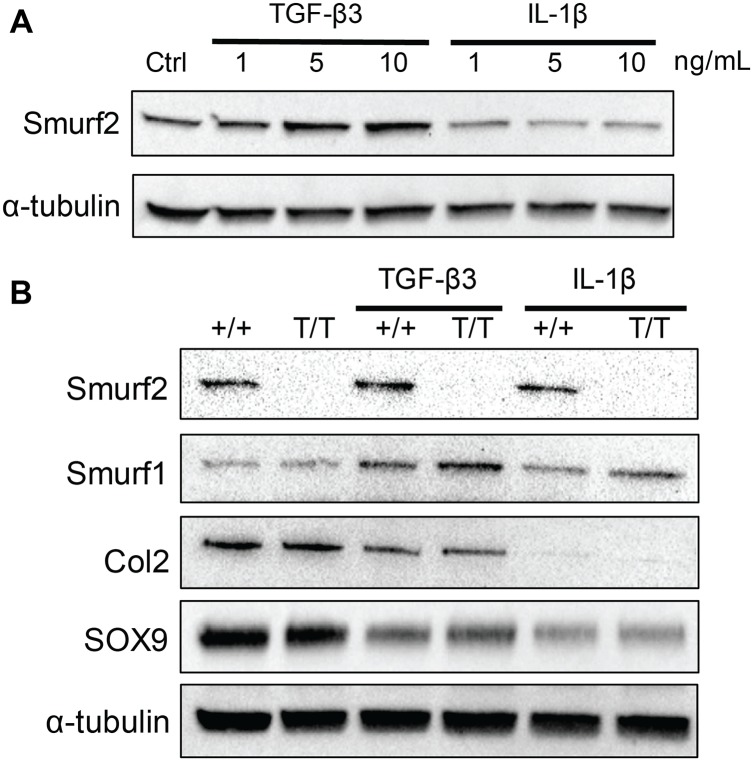
Overexpression of Smad ubiquitin regulatory factor 2 (Smurf2) in chondrocytes was reported to cause spontaneous osteoarthritis (OA) in mice. However, it is unclear whether Smurf2 is involved in bone and cartilage homeostasis and if it is required for OA pathogenesis. Here we characterized age-related changes in the bone and articular cartilage of Smurf2-deficient (MT) mice by microCT and histology, and examined whether reduced Smurf2 expression affected the severity of OA upon surgical destabilization of the medial meniscus (DMM). Using immature articular chondrocytes (iMAC) from MT and wild-type (WT) mice, we also examined how Smurf2 deficiency affects chondrogenic and catabolic gene expressions and Smurf2 and Smurf1 proteins upon TGF-β3 or IL-1β treatment in culture. We found no differences in cortical, subchondral and trabecular bone between WT and MT in young (4 months) and old mice (16-24 months). The articular cartilage and age-related alterations between WT and MT were also similar. However, 2 months following DMM, young MT showed milder OA compared to WT (~70% vs ~30% normal or exhibiting only mild OA cartilage phenotype). The majority of the older WT and MT mice developed moderate/severe OA 2 months after DMM, but a higher subset of aged MT cartilage (27% vs. 9% WT) remained largely normal. Chondrogenic gene expression (Sox9, Col2, Acan) trended higher in MT iMACs than WT with/without TGF-β3 treatment. IL-1β treatment suppressed chondrgenic gene expression, but Sox9 expression in MT remained significantly higher than WT. Smurf2 protein in WT iMACs increased upon TGF-β3 treatment and decreased upon IL-1β treatment in a dose-dependent manner. Smurf1 protein elevated more in MT than WT upon TGF-β3 treatment, suggesting a potential, but very mild compensatory effect. Overall, our data support a role of Smurf2 in regulating OA development but suggest that inhibiting Smurf2 alone may not be sufficient to prevent or consistently mitigate post-traumatic OA across a broad age range.
Conflict of interest statement
Figures
Similar articles
-
Chaperonin 60 regulation of SOX9 ubiquitination mitigates the development of knee osteoarthritis.J Mol Med (Berl). 2016 Jul;94(7):755-69. doi: 10.1007/s00109-016-1422-3. Epub 2016 Apr 27. J Mol Med (Berl). 2016. PMID: 27118120
-
Fibroblast Growth Factor Receptor 3 Inhibits Osteoarthritis Progression in the Knee Joints of Adult Mice.Arthritis Rheumatol. 2016 Oct;68(10):2432-43. doi: 10.1002/art.39739. Arthritis Rheumatol. 2016. PMID: 27159076
-
Induction of an osteoarthritis-like phenotype and degradation of phosphorylated Smad3 by Smurf2 in transgenic mice.Arthritis Rheum. 2008 Oct;58(10):3132-44. doi: 10.1002/art.23946. Arthritis Rheum. 2008. PMID: 18821706 Free PMC article.
-
Beta-catenin, cartilage, and osteoarthritis.Ann N Y Acad Sci. 2010 Mar;1192(1):344-50. doi: 10.1111/j.1749-6632.2009.05212.x. Ann N Y Acad Sci. 2010. PMID: 20392258 Free PMC article. Review.
-
Glutathione as a mediator of cartilage oxidative stress resistance and resilience during aging and osteoarthritis.Connect Tissue Res. 2020 Jan;61(1):34-47. doi: 10.1080/03008207.2019.1665035. Epub 2019 Sep 15. Connect Tissue Res. 2020. PMID: 31522568 Free PMC article. Review.
Cited by
-
The roles and regulatory mechanisms of TGF-β and BMP signaling in bone and cartilage development, homeostasis and disease.Cell Res. 2024 Feb;34(2):101-123. doi: 10.1038/s41422-023-00918-9. Epub 2024 Jan 24. Cell Res. 2024. PMID: 38267638 Free PMC article. Review.
-
Hematopoietic PBX-interacting protein mediates cartilage degeneration during the pathogenesis of osteoarthritis.Nat Commun. 2019 Jan 18;10(1):313. doi: 10.1038/s41467-018-08277-5. Nat Commun. 2019. PMID: 30659184 Free PMC article.
-
Network-based cytokine inference implicates Oncostatin M as a driver of an inflammation phenotype in knee osteoarthritis.Aging Cell. 2024 Feb;23(2):e14043. doi: 10.1111/acel.14043. Epub 2023 Dec 18. Aging Cell. 2024. PMID: 38111237 Free PMC article.
-
Age-dependent Changes in the Articular Cartilage and Subchondral Bone of C57BL/6 Mice after Surgical Destabilization of Medial Meniscus.Sci Rep. 2017 Feb 9;7:42294. doi: 10.1038/srep42294. Sci Rep. 2017. PMID: 28181577 Free PMC article.
-
Elucidating the role of ubiquitination and deubiquitination in osteoarthritis progression.Front Immunol. 2023 Jun 9;14:1217466. doi: 10.3389/fimmu.2023.1217466. eCollection 2023. Front Immunol. 2023. PMID: 37359559 Free PMC article. Review.
References
-
- Redini F, Galera P, Mauviel A, Loyau G, Pujol JP. Transforming growth factor beta stimulates collagen and glycosaminoglycan biosynthesis in cultured rabbit articular chondrocytes. FEBS Lett 1988;234(1):172–6. - PubMed
Publication types
MeSH terms
Substances
Grants and funding
LinkOut - more resources
Full Text Sources
Other Literature Sources
Molecular Biology Databases
Research Materials
