Lack of α2C-Adrenoceptor Results in Contrasting Phenotypes of Long Bones and Vertebra and Prevents the Thyrotoxicosis-Induced Osteopenia
- PMID: 26815679
- PMCID: PMC4729682
- DOI: 10.1371/journal.pone.0146795
Lack of α2C-Adrenoceptor Results in Contrasting Phenotypes of Long Bones and Vertebra and Prevents the Thyrotoxicosis-Induced Osteopenia
Abstract
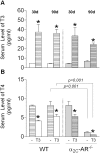
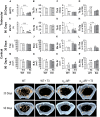
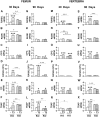
A series of studies have demonstrated that activation of the sympathetic nervous system (SNS) causes osteopenia via β2-adrenoceptor (β2-AR) signaling. However, in a recent study, we found an unexpected and generalized phenotype of high bone mass in female mice with chronic sympathetic hyperactivity, due to double gene inactivation of adrenoceptors that negatively regulate norepinephrine release, α2A-and α2C-AR (α2A/2C-AR-/-). These findings suggest that β2-AR is not the single adrenoceptor involved in bone turnover regulation and show that α2-AR signaling may also mediate the SNS actions in the skeleton. In addition, we found that α2A/2C-AR-/- animals are resistant to the thyrotoxicosis-induced osteopenia, suggesting that thyroid hormone (TH), when in supraphysiological levels, interacts with the SNS to control bone mass and structure, and that this interaction may also involve α2-AR signaling. In the present study, to further investigate these hypotheses and to discriminate the roles of α2-AR subtypes, we have evaluated the bone phenotype of mice with the single gene inactivation of α2C-AR subtype, which mRNA expression was previously shown to be down regulated by triiodothyronine (T3). A cohort of 30 day-old female α2CAR-/- mice and their wild-type (WT) controls were treated with a supraphysiological dose of T3 for 30 or 90 days, which induced a thyrotoxic state in both mouse lineages. The micro-computed tomographic (μCT) analysis showed that α2C-AR-/- mice present lower trabecular bone volume (BV/TV) and number (Tb.N), and increased trabecular separation (Tb.Sp) in the femur compared with WT mice; which was accompanied by decreased bone strength (determined by the three-point bending test) in the femur and tibia. The opposite was observed in the vertebra, where α2C-AR-/- mice show increased BV/TV, Tb.N and trabecular thickness (Tb.Th), and decreased Tb.Sp, compared with WT animals. In spite of the contrasting bone phenotypes of the femur and L5, thyrotoxicosis negatively regulated most of the micro architectural features of the trabecular bone in both skeletal sites of WT, but not of α2C-AR-/- mice. T3 treatment also decreased biomechanical properties (maximum load and ultimate load) in the femur and tibia of WT, but not of knockout mice. The mRNA expression of osteocalcin, a marker of mature osteoblasts, and tartrate-resistant acid phosphatase, which is expressed by osteoclasts and is involved in collagen degradation, was increased by T3 treatment only in WT, and not in α2C-AR-/- mice. Altogether, these findings suggest that α2C-AR subtype mediates the effects of the SNS in the bone in a skeletal site-dependent manner, and that thyrotoxicosis depends on α2C-AR signaling to promote bone loss, which sustains the hypothesis of a TH-SNS interaction to modulate bone remodeling and structure.
Conflict of interest statement
Figures


Similar articles
-
Global Disruption of α2A Adrenoceptor Barely Affects Bone Tissue but Minimizes the Detrimental Effects of Thyrotoxicosis on Cortical Bone.Front Endocrinol (Lausanne). 2018 Aug 28;9:486. doi: 10.3389/fendo.2018.00486. eCollection 2018. Front Endocrinol (Lausanne). 2018. PMID: 30233491 Free PMC article.
-
Thyrotoxicosis Involves β2-Adrenoceptor Signaling to Negatively Affect Microarchitecture and Biomechanical Properties of the Femur.Thyroid. 2019 Aug;29(8):1060-1072. doi: 10.1089/thy.2018.0259. Thyroid. 2019. PMID: 31264512
-
Double disruption of α2A- and α2C-adrenoceptors results in sympathetic hyperactivity and high-bone-mass phenotype.J Bone Miner Res. 2011 Mar;26(3):591-603. doi: 10.1002/jbmr.243. J Bone Miner Res. 2011. PMID: 20814988
-
α2C-adrenoceptor modulators: a patent review.Expert Opin Ther Pat. 2011 Apr;21(4):455-81. doi: 10.1517/13543776.2011.565333. Expert Opin Ther Pat. 2011. PMID: 21413828 Review.
-
Therapeutic Potential of Selectively Targeting the α2C-Adrenoceptor in Cognition, Depression, and Schizophrenia-New Developments and Future Perspective.Front Psychiatry. 2017 Aug 14;8:144. doi: 10.3389/fpsyt.2017.00144. eCollection 2017. Front Psychiatry. 2017. PMID: 28855875 Free PMC article. Review.
Cited by
-
Impact of the Autonomic Nervous System on the Skeleton.Physiol Rev. 2018 Jul 1;98(3):1083-1112. doi: 10.1152/physrev.00014.2017. Physiol Rev. 2018. PMID: 29717928 Free PMC article. Review.
-
Antipsychotic-induced bone loss: the role of dopamine, serotonin and adrenergic receptor signalling.Front Cell Dev Biol. 2023 May 25;11:1184550. doi: 10.3389/fcell.2023.1184550. eCollection 2023. Front Cell Dev Biol. 2023. PMID: 37305679 Free PMC article. Review.
-
Transferrin receptor 1-mediated iron uptake regulates bone mass in mice via osteoclast mitochondria and cytoskeleton.Elife. 2022 Jun 27;11:e73539. doi: 10.7554/eLife.73539. Elife. 2022. PMID: 35758636 Free PMC article.
-
Autonomic Nervous System in Bone Remodeling: From Mechanisms to Novel Therapies in Orthopedic Diseases.Orthop Surg. 2025 Jun;17(6):1561-1576. doi: 10.1111/os.70010. Epub 2025 Mar 12. Orthop Surg. 2025. PMID: 40071773 Free PMC article. Review.
-
Global Disruption of α2A Adrenoceptor Barely Affects Bone Tissue but Minimizes the Detrimental Effects of Thyrotoxicosis on Cortical Bone.Front Endocrinol (Lausanne). 2018 Aug 28;9:486. doi: 10.3389/fendo.2018.00486. eCollection 2018. Front Endocrinol (Lausanne). 2018. PMID: 30233491 Free PMC article.
References
-
- Bassett JH, O'Shea PJ, Sriskantharajah S, Rabier B, Boyde A, et al. (2007) Thyroid hormone excess rather than thyrotropin deficiency induces osteoporosis in hyperthyroidism. Mol Endocrinol 21: 1095–1107. - PubMed
-
- Melsen F, Mosekilde L (1977) Morphometric and dynamic studies of bone changes in hyperthyroidism. Acta Pathol Microbiol Scand A 85A: 141–150. - PubMed
-
- Coindre JM, David JP, Riviere L, Goussot JF, Roger P, et al. (1986) Bone loss in hypothyroidism with hormone replacement. A histomorphometric study. Arch Intern Med 146: 48–53. - PubMed
-
- Eriksen EF, Mosekilde L, Melsen F (1985) Trabecular bone remodeling and bone balance in hyperthyroidism. Bone 6: 421–428. - PubMed
Publication types
MeSH terms
Substances
LinkOut - more resources
Full Text Sources
Other Literature Sources
Molecular Biology Databases
Research Materials

