

Disparate Response to Methotrexate in Stem Versus Non-Stem Cells
- PMID: 26815725
- PMCID: PMC4880537
- DOI: 10.1007/s12015-016-9645-9
Disparate Response to Methotrexate in Stem Versus Non-Stem Cells
Abstract
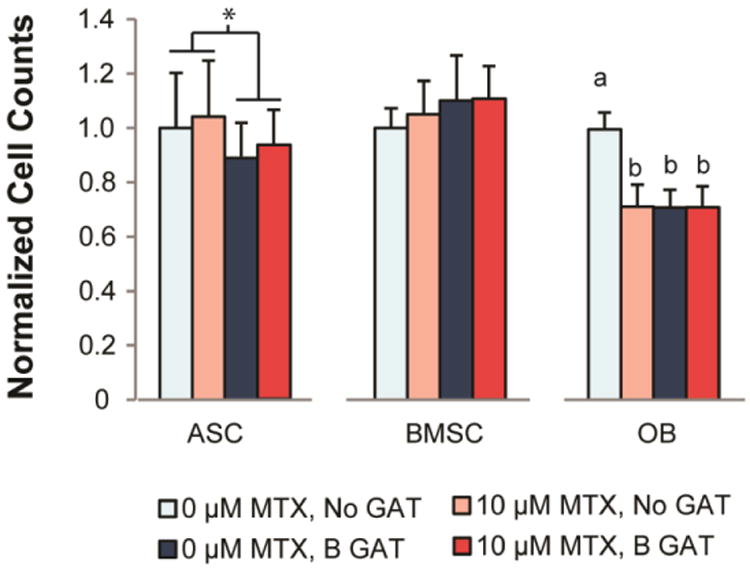
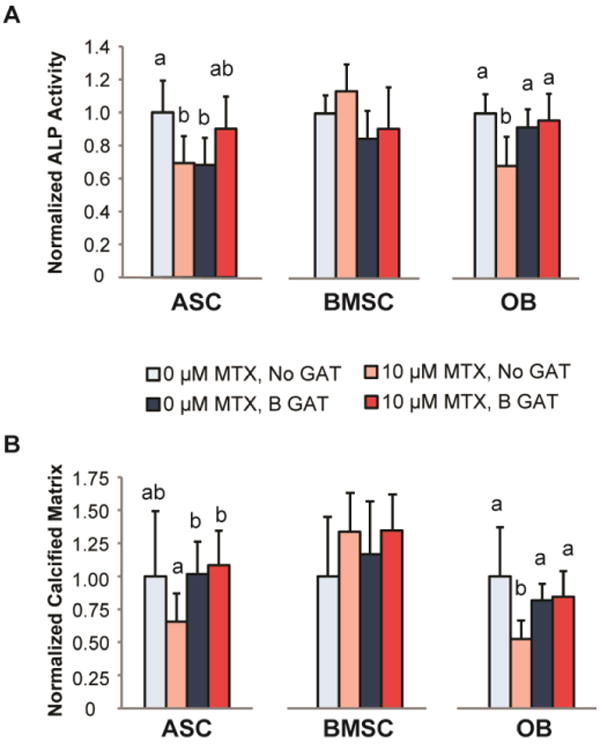
Methotrexate (MTX) is a commonly used chemotherapeutic agent that kills cancer cells by binding dihydrofolate reductase (DHFR) as a competitive inhibitor. Due to its non-selectivity, MTX also impairs normal (non-cancerous) cell function and causes long-term damage to healthy tissue. These consequences have been investigated extensively in bone-derived cells due to their sensitivity to the drug. While DHFR likely plays a role in normal cell response to MTX, research in this area is limited. Moreover, how MTX sensitivity differs among cell types responsible for maintaining connective tissues is unknown. The goal of this study was to investigate the role of DHFR and subsequent nucleotide synthesis in normal cell response to MTX. We also sought to compare adverse effects of MTX among normal cell types to identify sensitive populations and resistant cell sources for regenerative procedures targeting patients undergoing chemotherapy. DHFR overexpression or exogenous amino acid + nucleoside delivery rescued normal cells from adverse MTX effects. Conversely, DHFR knockdown impaired MTX-treated adipose-derived stem cell (ASC) osteogenesis. Proliferation of ASCs and bone marrow stem cells was more resistant to MTX than that of terminally differentiated osteoblasts. However, stem cells became susceptible to the drug after beginning differentiation. These results suggest that the ability of stem cells to survive and to maintain their surrounding tissues likely depends on whether they are in a "stem" state when exposed to MTX. Therapeutic strategies that delay the differentiation of stem cells until clearance of the drug may produce more favorable outcomes in the long-term health of treated tissues.
Keywords: Cancer; Chemotherapy; Mesenchymal stem cell; Methotrexate; Regenerative medicine.
Conflict of interest statement
The authors declare no potential conflict of interest.
Figures


Similar articles
-
Adipose-derived stem cells retain their regenerative potential after methotrexate treatment.Exp Cell Res. 2014 Oct 1;327(2):222-33. doi: 10.1016/j.yexcr.2014.06.015. Epub 2014 Jun 30. Exp Cell Res. 2014. PMID: 24992046 Free PMC article.
-
Maintenance of differential methotrexate toxicity between cells expressing drug-resistant and wild-type dihydrofolate reductase activities in the presence of nucleosides through nucleoside transport inhibition.Biochem Pharmacol. 2000 Jan 15;59(2):141-51. doi: 10.1016/s0006-2952(99)00311-1. Biochem Pharmacol. 2000. PMID: 10810448
-
Methotrexate preconditioning allows sufficient engraftment to confer drug resistance in mice transplanted with marrow expressing drug-resistant dihydrofolate reductase activity.J Pharmacol Exp Ther. 2005 Aug;314(2):668-74. doi: 10.1124/jpet.104.082982. Epub 2005 Apr 27. J Pharmacol Exp Ther. 2005. PMID: 15857949
-
Drug-resistant dihydrofolate reductases: generation, expression and therapeutic application.Bone Marrow Transplant. 1996 Dec;18 Suppl 3:S50-4. Bone Marrow Transplant. 1996. PMID: 8971409 Review.
-
Biochemical factors in the selectivity of leucovorin rescue: selective inhibition of leucovorin reactivation of dihydrofolate reductase and leucovorin utilization in purine and pyrimidine biosynthesis by methotrexate and dihydrofolate polyglutamates.NCI Monogr. 1987;(5):17-26. NCI Monogr. 1987. PMID: 2448654 Review.
Cited by
-
Paclitaxel's Mechanistic and Clinical Effects on Breast Cancer.Biomolecules. 2019 Nov 27;9(12):789. doi: 10.3390/biom9120789. Biomolecules. 2019. PMID: 31783552 Free PMC article. Review.
-
LncRNA-PCAT1 targeting miR-145-5p promotes TLR4-associated osteogenic differentiation of adipose-derived stem cells.J Cell Mol Med. 2018 Dec;22(12):6134-6147. doi: 10.1111/jcmm.13892. Epub 2018 Oct 19. J Cell Mol Med. 2018. PMID: 30338912 Free PMC article.
-
Assessment of Ante- and Postnatal Development of the Offspring of Male Rats Crossed in Delayed Periods after Treatment with Methotrexate in Low Doses.Bull Exp Biol Med. 2023 Aug;175(4):503-507. doi: 10.1007/s10517-023-05895-y. Epub 2023 Sep 30. Bull Exp Biol Med. 2023. PMID: 37775703
-
[Immunosuppressive treatment and bone healing].Unfallchirurg. 2019 Jul;122(7):518-525. doi: 10.1007/s00113-019-0685-x. Unfallchirurg. 2019. PMID: 31190108 Review. German.
-
Assessment and Comparison of the Efficacy of Methotrexate, Prednisolone, Adalimumab, and Tocilizumab on Multipotency of Mesenchymal Stem Cells.Front Pharmacol. 2020 Jul 3;11:1004. doi: 10.3389/fphar.2020.01004. eCollection 2020. Front Pharmacol. 2020. PMID: 32719606 Free PMC article.
References
-
- Berry DA, Cronin KA, Plevritis SK, et al. Effect of screening and adjuvant therapy on mortality from breast cancer. The New England journal of medicine. 2005;353:1784–92. - PubMed
-
- Saltz LB, Kemeny NE. Adjuvant Chemotherapy of Colorectal Cancer. The oncologist. 1996;1:22–29. - PubMed
-
- Gerber DE. Targeted therapies: a new generation of cancer treatments. American family physician. 2008;77:311–9. - PubMed
MeSH terms
Substances
Grants and funding
LinkOut - more resources
Full Text Sources
Other Literature Sources
Medical
Miscellaneous
