. 2016 Jan 15;351(6270):275-281.
doi: 10.1126/science.aab4138.

Metabolism. AMP-activated protein kinase mediates mitochondrial fission in response to energy stress

Affiliations

Metabolism. AMP-activated protein kinase mediates mitochondrial fission in response to energy stress

Erin Quan Toyama et al. Science. .

Abstract

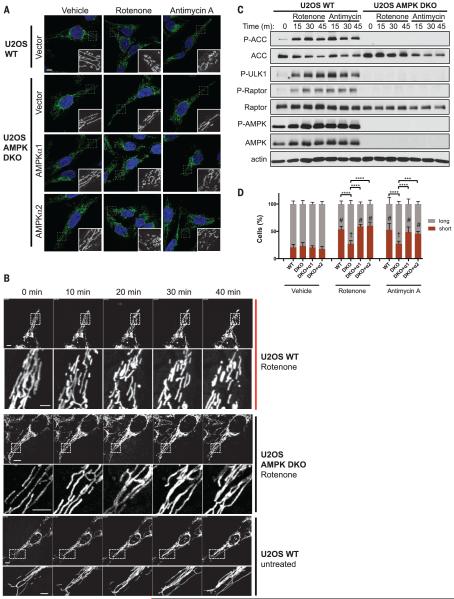
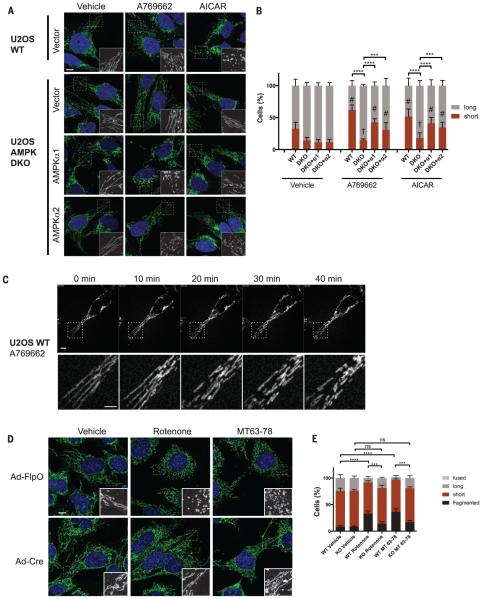
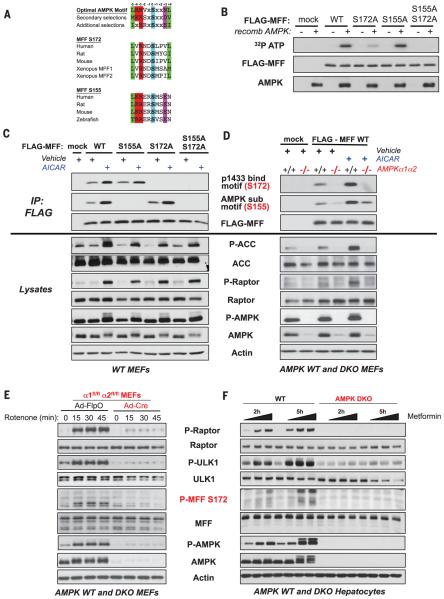
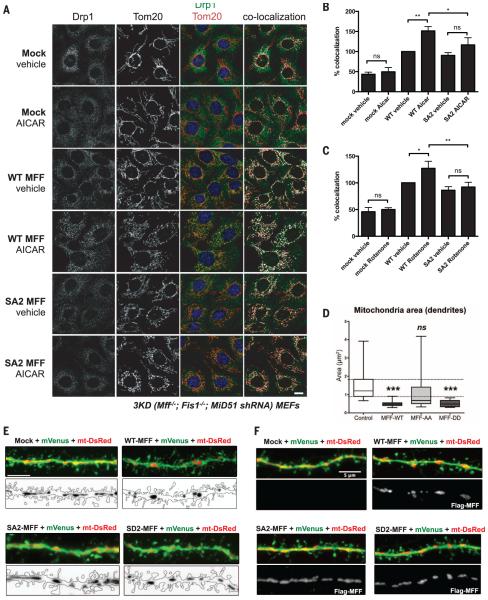
Mitochondria undergo fragmentation in response to electron transport chain (ETC) poisons and mitochondrial DNA-linked disease mutations, yet how these stimuli mechanistically connect to the mitochondrial fission and fusion machinery is poorly understood. We found that the energy-sensing adenosine monophosphate (AMP)-activated protein kinase (AMPK) is genetically required for cells to undergo rapid mitochondrial fragmentation after treatment with ETC inhibitors. Moreover, direct pharmacological activation of AMPK was sufficient to rapidly promote mitochondrial fragmentation even in the absence of mitochondrial stress. A screen for substrates of AMPK identified mitochondrial fission factor (MFF), a mitochondrial outer-membrane receptor for DRP1, the cytoplasmic guanosine triphosphatase that catalyzes mitochondrial fission. Nonphosphorylatable and phosphomimetic alleles of the AMPK sites in MFF revealed that it is a key effector of AMPK-mediated mitochondrial fission.


Figures

Fig. 1
Fig. 1. Requirement of AMPK for rotenone- and antimycin A–induced mitochondrial fragmentation
(A) Representative confocal images of the mitochondrial morphology of U2OS wild-type (WT) (parental) or AMPK DKO cells, stably transduced with an empty vector or a vector encoding AMPKa1 or AMPKa2 cDNAs, and treated for 1 hour with vehicle (dimethyl sulfoxide, DMSO), 250 ng/ml of rotenone, or 10 mM antimycin A. Mitochondria were visualized using an antibody to TOM20. (B) Time-lapse images of U2OS WT (parental) or AMPK DKO cells stained with MitoTracker Green. The indicated treatment was started at 0 min. A magnification of a portion of the mitochondrial network (dotted square) is included for each image (movies S1 to S3). (C) Time course of AMPK activation by protein immunoblotting of cell lines and treatments shown in (A) (m, minute). (D) Quantification of the mitochondrial morphology of the cells shown in (A). Data are shown as the mean ± SEM of three independent experiments with 200 cells counted for each replicate; colors indicate the morphology of the mitochondria (long or short). ***P < 0.001; ****P < 0.0001 by two-way analysis of variance (ANOVA) using Tukey’s multiple comparison test; #P < 0.0001 compared with vehicle. The dagger indicates no significant difference relative to vehicle. Scale bars, 10 μm.
Fig. 2
Fig. 2. AMPK activation is sufficient for mitochondrial fragmentation in the absence of mitochondrial inhibitors
(A) Representative confocal images of the mitochondrial morphology of WT (parental) or AMPK DKO U2OS cells, stably transduced with an empty vector or a vector encoding human AMPKa1 or AMPKa2 cDNAs, and treated for 1 hour with vehicle (DMSO), 300 mM A769662, or 2 mM AICAR. Mitochondria were visualized using an antibody to TOM20. (B) Quantification of the mitochondrial morphology of cells shown in (A). (C) Time-lapse images of WT (parental) U2OS cells stained with MitoTracker Green and treated with 300 mM A769662 at 0 min. A magnification of a portion of the mitochondrial network (dotted square) is included for each image (bottom panel; movie S4). (D) Representative confocal images of the mitochondrial morphology of AMPKα1fl/flα2fl/fl (fl, floxed) MEFs transduced with FlpO (control)–or Cre-encoding adenoviruses (Ad) and treated for 1 hour with vehicle (DMSO), 100 ng/ml of rotenone, or 50 μM MT63-78. Mitochondria were visualized using an antibody to TOM20. (E) Quantification of the mitochondrial morphology of cells shown in (D). Data in (B) and (E) are shown as the mean ± SEM of three independent experiments with 200 cells counted for each replicate and statistically analyzed as in Fig. 1 (ns, not significant). Scale bars, 10 μm.
Fig. 3
Fig. 3. MFF is a conserved substrate of AMPK
(A) ClustalW alignment of two conserved sites on MFF that match the AMPK optimal substrate motif. Ser172 (S172) matches the well-defined AMPK motif found in most substrates (27, 39), and Ser155 (S155) contains additional selections including +4N that also have been previously described (39). (B) Incorporation of γ-32P-ATP into MFF in vitro. Human embryonic kidney–293 Tcells transfected with empty vector (mock), WT MFF, or the indicated MFF mutants were lysed, and the FLAG immunoprecipitates were combined with recombinant (recomb) active AMPK where indicated and γ-32P-ATP in an in vitro kinase reaction. Proteins were resolved on a SDS–polyacrylamide gel electrophoresis gel, and parallel non-radioactive kinase assays were immunoblotted as indicated. (C) Phosphorylation of MFF mutants. WT MEFs stably expressing a control vector (mock), WT MFF, or the indicated MFF mutants were treated with vehicle or 2 mM AICAR for 1 hour. FLAG immunoprecipitates and lysates were immunoblotted with the indicated antibodies and phosphomotif antibodies that recognize phosphorylated Ser172 or Ser155. (D) Phosphorylation in WT (+/+) or AMPK DKO (−/−) MEFs stably expressing a control vector (mock) or WT MFF. Cells were treated with vehicle or 2 mM AICAR for 1 hour and processed as in (C). (E) Protein immunoblot showing the time course of AMPK activation in WT and AMPK DKO MEFs, as generated in Fig. 2D, after treatment with 250 ng/ml of rote-none for the indicated times. Phosphorylation of endogenous MFF was detected by the antibody to MFF P-Ser172. (F) Protein immunoblot of primary hepatocytes prepared from WT or AMPK DKO livers and treated with increasing concentrations of metformin (0, 0.5, 1.0, and 2.0 mM), showing phosphorylation of endogenous MFF as detected by the anti-body to MFF P-Ser172.
Fig. 4
Fig. 4. MFF Ser155 and Ser172 are required for recruitment of DRP1 to mitochondria after AMPK activation
(A) Representative images of 3KD MEFs stably transduced with a control vector (mock), WT MFF, or the SA2 MFF mutant, treated for 1 hour with vehicle (DMSO) or 2 mM AICAR and fixed and visualized with antibodies to endogenous TOM20 and DRP1. The merge of both channels as well as the result of the colocalization highlighter plugin (ImageJ) are shown. Scale bar, 10 μm. (B) Quantification of mitochondrial DRP1 in samples shown in (A) (details are included in the supplementary materials). Data are shown as the mean ± SEM of four independent experiments, each with at least five images representing >40 cells per condition. *P < 0.05; **P < 0.01 by one-way ANOVA. (C) Quantification of mitochondrial DRP1 after treatment with 250 ng/ml of rotenone for 1 hour, as in panels (A) and (B). (D) Quantification of the in vivo dendritic mitochondrial area upon overexpression of mVenus, mt-DsRED, and the indicated construct (AA, SA2; DD, SD2). Data are shown as 0 to 100% whisker box plots with the 25th, 50th, and 75th percentiles as the lower, middle, and upper boundaries of the box, respectively. Data were analyzed using a nonparametric Kruskal-Wallis ANOVA with Dunn’s multiple comparisons (nControl = 19 neurons, nMFF-WT = 19 neurons, nMFF-AA = 27 neurons, and nMFF-DD = 26 neurons from four distinct animals per genotype). ***P < 0.001. (E) Maximum projection images of layer 2/3 postnatal day–30 apical dendrite branches, demonstrating mitochondrial morphology upon expression of the labeled constructs via in utero electroporation at embryonic day 15.5. The upper panel in each section is the merge of mVenus and mt-DsRED; the lower panel shows the outline of the cell and mt-DsRED. (F) Maximum projection images of 21-day in vitro apical dendrite collaterals from cortical neurons electroporated with the indicated constructs via ex utero electroporation at embryonic day 15.5. The upper panel in each section is the merge of mVenus and mt-DsRED; the lower panel shows MFF expression via staining by the antibody to FLAG. Scale bars, 5 μm.

Comment in

References

    1. Mishra P, Chan DC. Nat. Rev. Mol. Cell Biol. 2014;15:634–646. - PMC - PubMed
    1. Benard G, et al. J. Cell Sci. 2007;120:838–848. - PubMed
    1. Twig G, et al. EMBO J. 2008;27:433–446. - PMC - PubMed
    1. Montessuit S, et al. Cell. 2010;142:889–901. - PMC - PubMed
    1. Karbowski M, et al. J. Cell Biol. 2002;159:931–938. - PMC - PubMed

Publication types

MeSH terms

LinkOut - more resources