

Cortical morphological markers in children with autism: a structural magnetic resonance imaging study of thickness, area, volume, and gyrification
- PMID: 26816612
- PMCID: PMC4727390
- DOI: 10.1186/s13229-016-0076-x
Cortical morphological markers in children with autism: a structural magnetic resonance imaging study of thickness, area, volume, and gyrification
Abstract
Background: Individuals with autism spectrum disorder (ASD) have been characterized by altered cerebral cortical structures; however, the field has yet to identify consistent markers and prior studies have included mostly adolescents and adults. While there are multiple cortical morphological measures, including cortical thickness, surface area, cortical volume, and cortical gyrification, few single studies have examined all these measures. The current study analyzed all of the four measures and focused on pre-adolescent children with ASD.
Methods: We employed the FreeSurfer pipeline to examine surface-based morphometry in 60 high-functioning boys with ASD (mean age = 8.35 years, range = 4-12 years) and 41 gender-, age-, and IQ-matched typically developing (TD) peers (mean age = 8.83 years), while testing for age-by-diagnosis interaction and between-group differences.
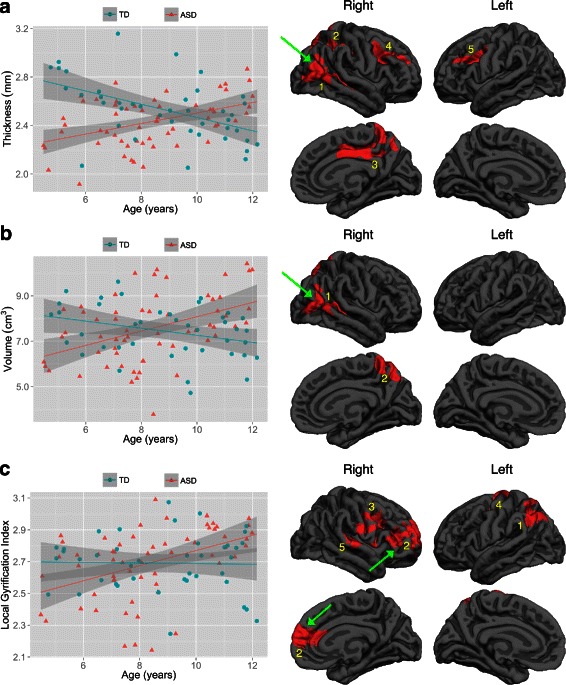
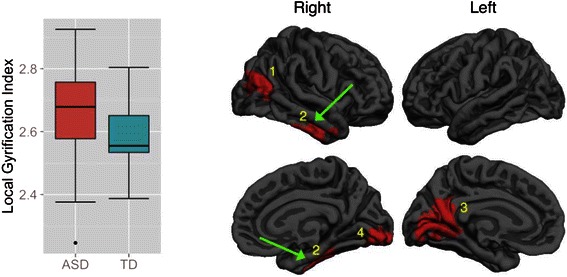
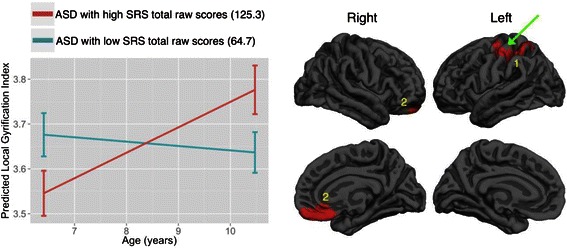
Results: During childhood and in specific regions, ASD participants exhibited a lack of normative age-related cortical thinning and volumetric reduction and an abnormal age-related increase in gyrification. Regarding surface area, ASD and TD exhibited statistically comparable age-related development during childhood. Across childhood, ASD relative to TD participants tended to have higher mean levels of gyrification in specific regions. Within ASD, those with higher Social Responsiveness Scale total raw scores tended to have greater age-related increase in gyrification in specific regions during childhood.
Conclusions: ASD is characterized by cortical neuroanatomical abnormalities that are age-, measure-, statistical model-, and region-dependent. The current study is the first to examine the development of all four cortical measures in one of the largest pre-adolescent samples. Strikingly, Neurosynth-based quantitative reverse inference of the surviving clusters suggests that many of the regions identified above are related to social perception, language, self-referential, and action observation networks-those frequently found to be functionally altered in individuals with ASD. The comprehensive, multilevel analyses across a wide range of cortical measures help fill a knowledge gap and present a complex but rich picture of neuroanatomical developmental differences in children with ASD.
Keywords: Autism spectrum disorder; Brain development; Brain structure; Neuroanatomy; Surface-based morphometry.
Figures
Similar articles
-
Surface-based morphometry of the cortical architecture of autism spectrum disorders: volume, thickness, area, and gyrification.Neuropsychologia. 2014 Sep;62:1-10. doi: 10.1016/j.neuropsychologia.2014.07.001. Epub 2014 Jul 11. Neuropsychologia. 2014. PMID: 25019362
-
Reduced Gyrification Is Related to Reduced Interhemispheric Connectivity in Autism Spectrum Disorders.J Am Acad Child Adolesc Psychiatry. 2015 Aug;54(8):668-76. doi: 10.1016/j.jaac.2015.05.011. Epub 2015 Jun 5. J Am Acad Child Adolesc Psychiatry. 2015. PMID: 26210336
-
The autism puzzle: Diffuse but not pervasive neuroanatomical abnormalities in children with ASD.Neuroimage Clin. 2015 Apr 15;8:170-9. doi: 10.1016/j.nicl.2015.04.008. eCollection 2015. Neuroimage Clin. 2015. PMID: 26106541 Free PMC article.
-
A systematic review of structural MRI biomarkers in autism spectrum disorder: A machine learning perspective.Int J Dev Neurosci. 2018 Dec;71:68-82. doi: 10.1016/j.ijdevneu.2018.08.010. Epub 2018 Aug 30. Int J Dev Neurosci. 2018. PMID: 30172895
-
Cortical and Subcortical Gray Matter Volume in Youths With Conduct Problems: A Meta-analysis.JAMA Psychiatry. 2016 Jan;73(1):64-72. doi: 10.1001/jamapsychiatry.2015.2423. JAMA Psychiatry. 2016. PMID: 26650724 Review.
Cited by
-
Heschl's Gyrus Duplication Pattern in Individuals at Risk of Developing Psychosis and Patients With Schizophrenia.Front Behav Neurosci. 2021 Apr 20;15:647069. doi: 10.3389/fnbeh.2021.647069. eCollection 2021. Front Behav Neurosci. 2021. PMID: 33958991 Free PMC article.
-
Altered gyrification in chemotherapy-treated older long-term breast cancer survivors.Brain Behav. 2024 Aug;14(8):e3634. doi: 10.1002/brb3.3634. Brain Behav. 2024. PMID: 39169605 Free PMC article.
-
The Role of Structure MRI in Diagnosing Autism.Diagnostics (Basel). 2022 Jan 11;12(1):165. doi: 10.3390/diagnostics12010165. Diagnostics (Basel). 2022. PMID: 35054330 Free PMC article.
-
Observational Learning in Low-Functioning Children With Autism Spectrum Disorders: A Behavioral and Neuroimaging Study.Front Psychol. 2019 Jan 9;9:2737. doi: 10.3389/fpsyg.2018.02737. eCollection 2018. Front Psychol. 2019. PMID: 30687188 Free PMC article.
-
Boys with autism spectrum disorder have distinct cortical folding patterns underpinning impaired self-regulation: a surface-based morphometry study.Brain Imaging Behav. 2020 Dec;14(6):2464-2476. doi: 10.1007/s11682-019-00199-0. Brain Imaging Behav. 2020. PMID: 31512098
References
-
- Blumberg SJ, Bramlett MD, Kogan MD, Schieve LA, Jones JR, Lu MC. Changes in prevalence of parent-reported autism spectrum disorder in school-aged U.S. children: 2007 to 2011-2012. Natl. Health Stat. Rep. 2013;65:1–11. - PubMed
-
- APA . Diagnostic and statistical manual of mental disorders: DSM-5. 5. Washington, D.C: American Psychiatric Publishing; 2013.
Publication types
MeSH terms
Grants and funding
LinkOut - more resources
Full Text Sources
Other Literature Sources
Medical
Miscellaneous
