

GEP analysis validates high risk MDS and acute myeloid leukemia post MDS mice models and highlights novel dysregulated pathways
- PMID: 26817437
- PMCID: PMC4728810
- DOI: 10.1186/s13045-016-0235-8
GEP analysis validates high risk MDS and acute myeloid leukemia post MDS mice models and highlights novel dysregulated pathways
Abstract
Background: In spite of the recent discovery of genetic mutations in most myelodysplasic (MDS) patients, the pathophysiology of these disorders still remains poorly understood, and only few in vivo models are available to help unravel the disease.
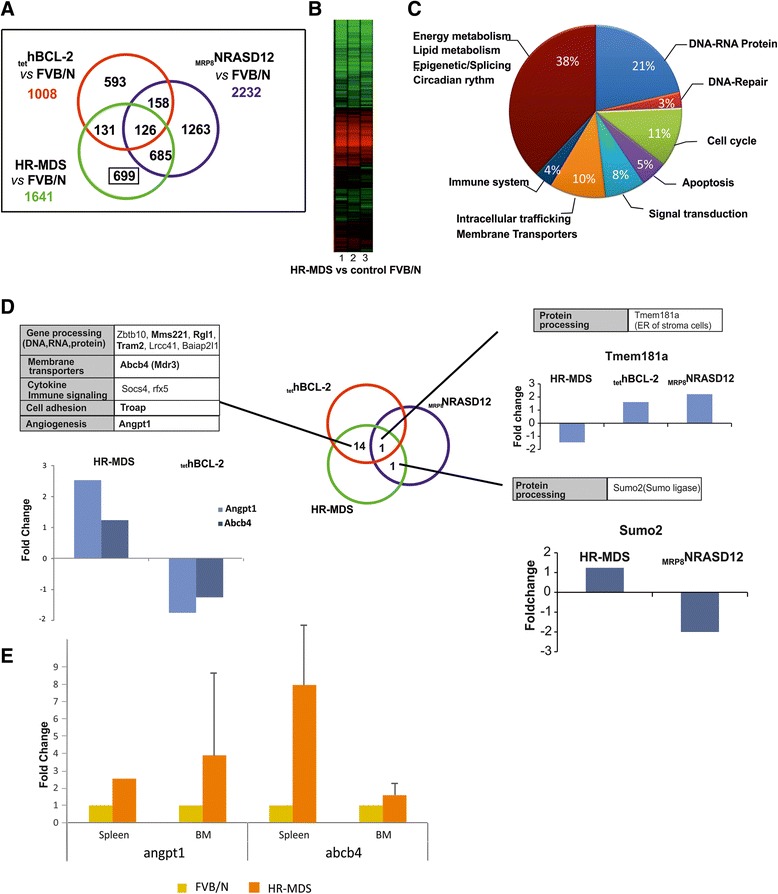
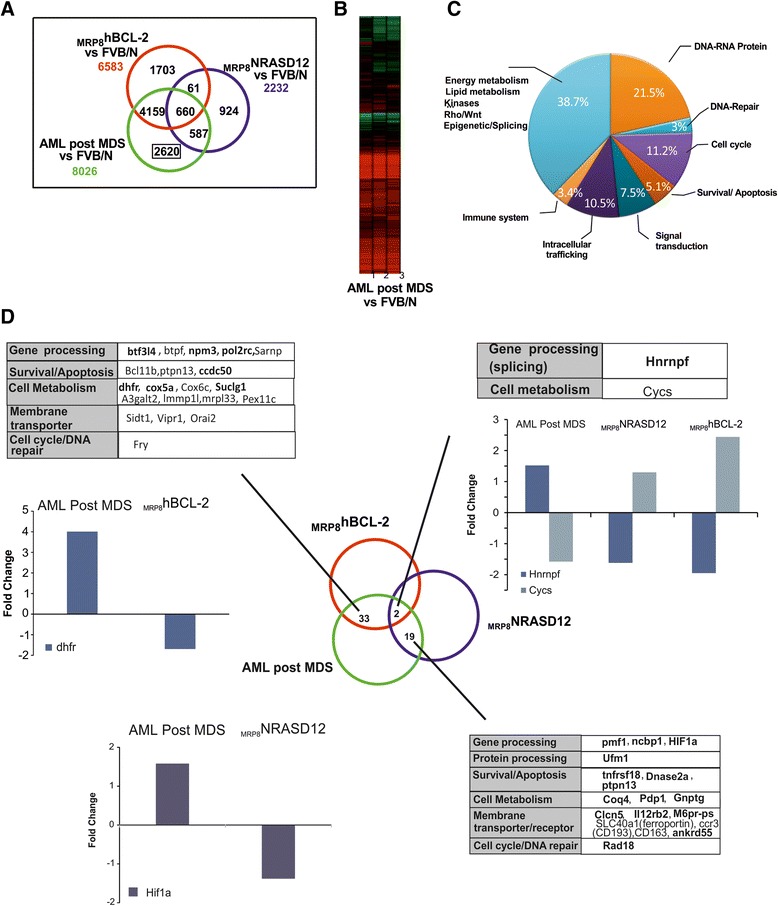
Methods: We performed global specific gene expression profiling and functional pathway analysis in purified Sca1+ cells of two MDS transgenic mouse models that mimic human high-risk MDS (HR-MDS) and acute myeloid leukemia (AML) post MDS, with NRASD12 and BCL2 transgenes under the control of different promoters MRP8NRASD12/tethBCL-2 or MRP8[NRASD12/hBCL-2], respectively.
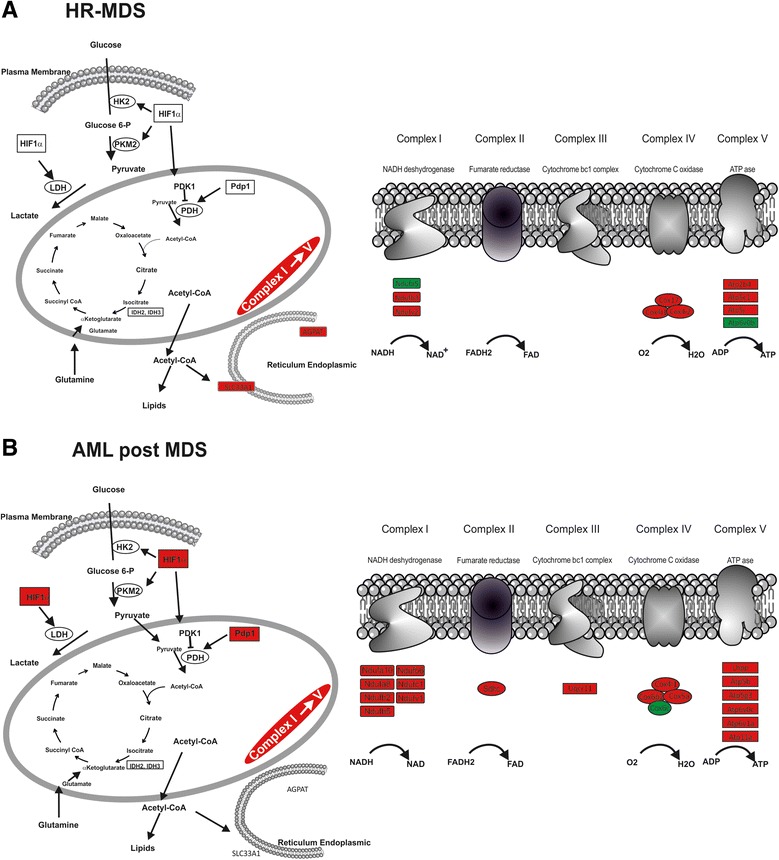
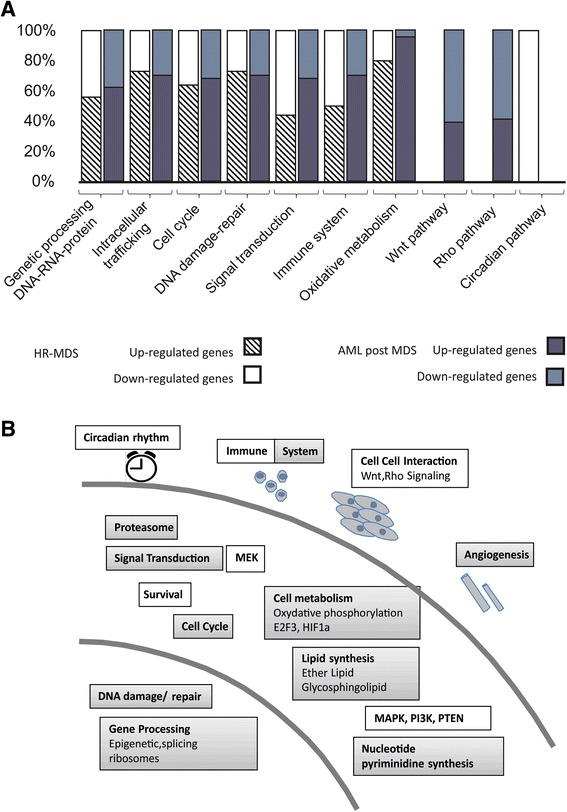
Results: Analysis of dysregulated genes that were unique to the diseased HR-MDS and AML post MDS mice and not their founder mice pointed first to pathways that had previously been reported in MDS patients, including DNA replication/damage/repair, cell cycle, apoptosis, immune responses, and canonical Wnt pathways, further validating these models at the gene expression level. Interestingly, pathways not previously reported in MDS were discovered. These included dysregulated genes of noncanonical Wnt pathways and energy and lipid metabolisms. These dysregulated genes were not only confirmed in a different independent set of BM and spleen Sca1+ cells from the MDS mice but also in MDS CD34+ BM patient samples.
Conclusions: These two MDS models may thus provide useful preclinical models to target pathways previously identified in MDS patients and to unravel novel pathways highlighted by this study.
Figures


Similar articles
-
BCL-2 and mutant NRAS interact physically and functionally in a mouse model of progressive myelodysplasia.Cancer Res. 2007 Dec 15;67(24):11657-67. doi: 10.1158/0008-5472.CAN-07-0196. Cancer Res. 2007. PMID: 18089795
-
Gene stage-specific expression in the microenvironment of pediatric myelodysplastic syndromes.Leuk Res. 2007 May;31(5):579-89. doi: 10.1016/j.leukres.2006.10.007. Epub 2006 Nov 7. Leuk Res. 2007. PMID: 17092558
-
Induction of gene expression by 5-Aza-2'-deoxycytidine in acute myeloid leukemia (AML) and myelodysplastic syndrome (MDS) but not epithelial cells by DNA-methylation-dependent and -independent mechanisms.Leukemia. 2005 Jan;19(1):103-11. doi: 10.1038/sj.leu.2403552. Leukemia. 2005. PMID: 15510208
-
DNA micro-array analysis of myelodysplastic syndrome.Leuk Lymphoma. 2006 Jan;47(1):9-14. doi: 10.1080/10428190500264231. Leuk Lymphoma. 2006. PMID: 16321821 Review.
-
Molecular pathways mediating MDS/AML with focus on AML1/RUNX1 point mutations.J Cell Physiol. 2009 Jul;220(1):16-20. doi: 10.1002/jcp.21769. J Cell Physiol. 2009. PMID: 19334039 Review.
Cited by
-
Activation of RAS/MAPK pathway confers MCL-1 mediated acquired resistance to BCL-2 inhibitor venetoclax in acute myeloid leukemia.Signal Transduct Target Ther. 2022 Feb 21;7(1):51. doi: 10.1038/s41392-021-00870-3. Signal Transduct Target Ther. 2022. PMID: 35185150 Free PMC article.
-
BCL-2 Inhibitor ABT-737 Effectively Targets Leukemia-Initiating Cells with Differential Regulation of Relevant Genes Leading to Extended Survival in a NRAS/BCL-2 Mouse Model of High Risk-Myelodysplastic Syndrome.Int J Mol Sci. 2021 Sep 30;22(19):10658. doi: 10.3390/ijms221910658. Int J Mol Sci. 2021. PMID: 34638998 Free PMC article.
-
PIGN spatiotemporally regulates the spindle assembly checkpoint proteins in leukemia transformation and progression.Sci Rep. 2021 Sep 24;11(1):19022. doi: 10.1038/s41598-021-98218-y. Sci Rep. 2021. PMID: 34561473 Free PMC article.
-
Venetoclax and low-dose cytarabine induced complete remission in a patient with high-risk acute myeloid leukemia: a case report.Front Med. 2018 Oct;12(5):593-599. doi: 10.1007/s11684-018-0635-y. Epub 2018 May 21. Front Med. 2018. PMID: 29785506
-
Apoptosis-Related Gene Expression Profiling in Hematopoietic Cell Fractions of MDS Patients.PLoS One. 2016 Nov 30;11(11):e0165582. doi: 10.1371/journal.pone.0165582. eCollection 2016. PLoS One. 2016. PMID: 27902785 Free PMC article.
References
-
- Mughal TI, Cross NC, Padron E, Tiu RV, Savona M, Malcovati L, et al. An International MDS/MPN Working Group’s perspective and recommendations on molecular pathogenesis, diagnosis and clinical characterization of myelodysplastic/myeloproliferative neoplasms. Haematologica. 2015;100(9):1117–30. doi: 10.3324/haematol.2014.114660. - DOI - PMC - PubMed
-
- Hajkova H, Fritz MH, Haskovec C, Schwarz J, Salek C, Markova J, et al. CBFB-MYH11 hypomethylation signature and PBX3 differential methylation revealed by targeted bisulfite sequencing in patients with acute myeloid leukemia. J Hematol Oncol. 2014;7:66. doi: 10.1186/s13045-014-0066-4. - DOI - PMC - PubMed
Publication types
MeSH terms
LinkOut - more resources
Full Text Sources
Other Literature Sources
Medical
Molecular Biology Databases
Research Materials
Miscellaneous
