. 2016 Jan 28:13:4.
doi: 10.1186/s12984-016-0111-3.

Biomechanical walking mechanisms underlying the metabolic reduction caused by an autonomous exoskeleton

Affiliations

Biomechanical walking mechanisms underlying the metabolic reduction caused by an autonomous exoskeleton

Luke M Mooney et al. J Neuroeng Rehabil. .

Abstract

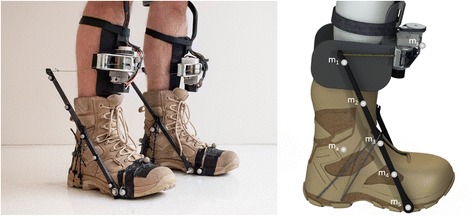
Background: Ankle exoskeletons can now reduce the metabolic cost of walking in humans without leg disability, but the biomechanical mechanisms that underlie this augmentation are not fully understood. In this study, we analyze the energetics and lower limb mechanics of human study participants walking with and without an active autonomous ankle exoskeleton previously shown to reduce the metabolic cost of walking.

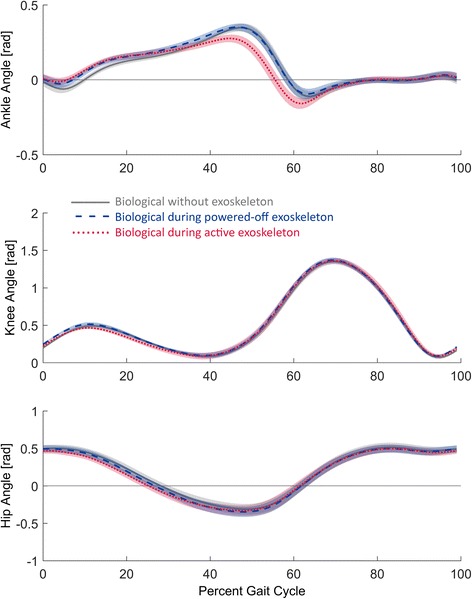
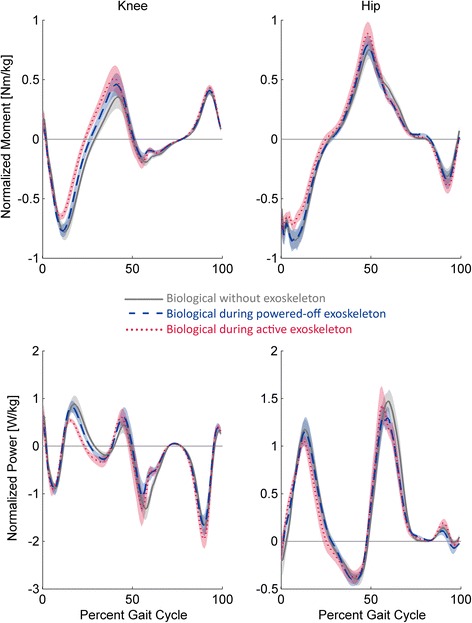
Methods: We measured the metabolic, kinetic and kinematic effects of wearing a battery powered bilateral ankle exoskeleton. Six participants walked on a level treadmill at 1.4 m/s under three conditions: exoskeleton not worn, exoskeleton worn in a powered-on state, and exoskeleton worn in a powered-off state. Metabolic rates were measured with a portable pulmonary gas exchange unit, body marker positions with a motion capture system, and ground reaction forces with a force-plate instrumented treadmill. Inverse dynamics were then used to estimate ankle, knee and hip torques and mechanical powers.

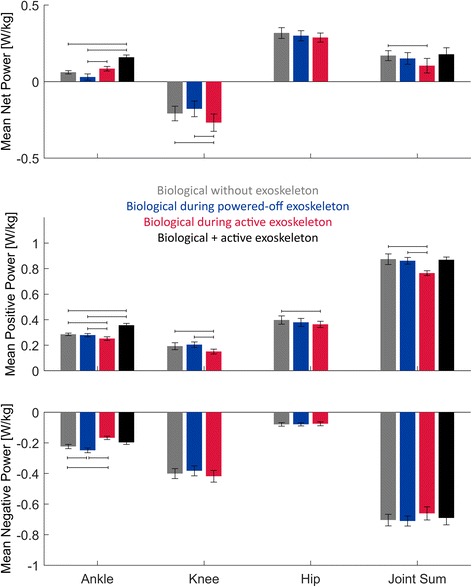
Results: The active ankle exoskeleton provided a mean positive power of 0.105 ± 0.008 W/kg per leg during the push-off region of stance phase. The net metabolic cost of walking with the active exoskeleton (3.28 ± 0.10 W/kg) was an 11 ± 4 % (p = 0.019) reduction compared to the cost of walking without the exoskeleton (3.71 ± 0.14 W/kg). Wearing the ankle exoskeleton significantly reduced the mean positive power of the ankle joint by 0.033 ± 0.006 W/kg (p = 0.007), the knee joint by 0.042 ± 0.015 W/kg (p = 0.020), and the hip joint by 0.034 ± 0.009 W/kg (p = 0.006).

Conclusions: This study shows that the ankle exoskeleton does not exclusively reduce positive mechanical power at the ankle joint, but also mitigates positive power at the knee and hip. Furthermore, the active ankle exoskeleton did not simply replace biological ankle function in walking, but rather augmented the total (biological + exoskeletal) ankle moment and power. This study underscores the need for comprehensive models of human-exoskeleton interaction and global optimization methods for the discovery of new control strategies that optimize the physiological impact of leg exoskeletons.


Figures

Fig. 1
Fig. 1
Active autonomous ankle exoskeleton. The active autonomous ankle exoskeleton used a winch actuator on the shin to actuate the proximal ends of fiberglass struts attached to the boot. The winch actuator implemented a brushless DC motor and pulley transmission to wind a high strength cord. The motor controllers and batteries were worn around the chest and waist. Reflective markers on the strut were used to measure the deflection of the struts and the applied exoskeletal torque
Fig. 2
Fig. 2
Strut torque characterization. The exoskeletal torque measured by a force sensor and motion capture system were compared to the exoskeletal torque predicted by the deflection of the struts. Using reflective markers on the strut enabled a simple, synchronous method for measuring exoskeletal torque without adding substantial mass. The system was calibrated at various amplitudes and frequencies, similar to those experienced during walking. Only a portion of the calibration data are shown in the figure
Fig. 3
Fig. 3
Exoskeletal effects on mean joint powers. The mean net powers, mean positive powers, and mean negative powers of the biological ankle, knee, hip and sum of all three joints are shown while wearing no exoskeleton (grey), the powered-off exoskeleton (blue), and the active exoskeleton (red). The black bars also include the mechanical exoskeletal power. Vertical error bars represent the standard error means, and horizontal brackets denote conditions that are significantly different (p < 0.05)
Fig. 4
Fig. 4
Joint angle profiles. The angle trajectories of the ankle, knee and hip are shown over a gait cycle that begins and ends with heel strike of the same leg. Increasing angles represent dorsiflexion at the ankle, flexion at the knee, and flexion at the hip. The trajectories are intersubject means. The grey solid lines represent the no exoskeleton condition; dark blue dashes represent the powered-off exoskeleton condition, and the red dots represent the active exoskeleton condition. The standard error means are shown with light shading of the same color
Fig. 5
Fig. 5
Ankle moment and power profiles. The ankle moment profiles during the first 70 % of the gait cycle are depicted on the top graph, and the ankle power profiles are depicted on the bottom. Positive moment values denote ankle dorsiflexion. The figure compares the biological ankle during the no exoskeleton condition (grey solid line), the powered-off exoskeleton condition (dark blue dashes), and the active exoskeleton condition (red dots). The exoskeleton moment and power during the active condition are shown with light blue dashes and dots. The sum of the biological ankle and exoskeleton during the active condition are shown with a solid black line with dots. The standard error means are shown with light shading of the same color
Fig. 6
Fig. 6
Knee and hip moment and power profiles. The knee and hip moment and power profiles are compared during the three exoskeletal conditions. Positive moment values denote flexion at the knee and flexion at the hip. The moment profiles are shown on top and the power profiles are shown on the bottom. The knee profiles are on the left and the hip profiles are on the right. The grey solid lines represent the no exoskeleton condition; dark blue dashes represent the powered-off exoskeleton condition, and the red dots represent the active exoskeleton condition. The standard error means are shown with light shading of the same color

Similar articles

Cited by

References

    1. Malcolm P, Derave W, Galle S, De Clercq D. A simple exoskeleton that assists plantarflexion can reduce the metabolic cost of human walking. PLoS One. 2013;8 doi: 10.1371/journal.pone.0056137. - DOI - PMC - PubMed
    1. Mooney LM, Rouse EJ, Herr HM. Autonomous exoskeleton reduces metabolic cost of human walking. J Neuroeng Rehabil. 2014;11:1–5. doi: 10.1186/1743-0003-11-1. - DOI - PMC - PubMed
    1. Mooney LM, Rouse EJ, Herr HM. Autonomous exoskeleton reduces metabolic cost of human walking during load carriage. J Neuroeng Rehabil. 2014;11:1–11. doi: 10.1186/1743-0003-11-1. - DOI - PMC - PubMed
    1. Collins SH, Wiggin MB, Sawicki GS. Reducing the energy cost of human walking using an unpowered exoskeleton. Nature. 2015;522:212–5. doi: 10.1038/nature14288. - DOI - PMC - PubMed
    1. Ferris DP, Sawicki GS, Daley MA. A physiologist’s perspective on robotic exoskeletons for human locomotion. Int J Humanoid Robot. 2007;4:507–28. doi: 10.1142/S0219843607001138. - DOI - PMC - PubMed

Publication types