. 2016 Jan 28:7:10541.
doi: 10.1038/ncomms10541.

Microbial diversity drives multifunctionality in terrestrial ecosystems

Affiliations

Microbial diversity drives multifunctionality in terrestrial ecosystems

Manuel Delgado-Baquerizo et al. Nat Commun. .

Abstract

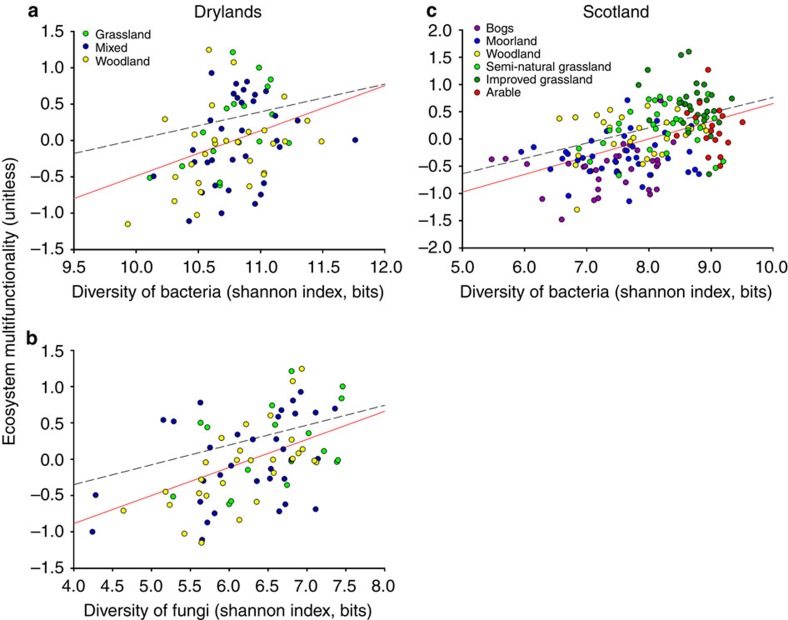
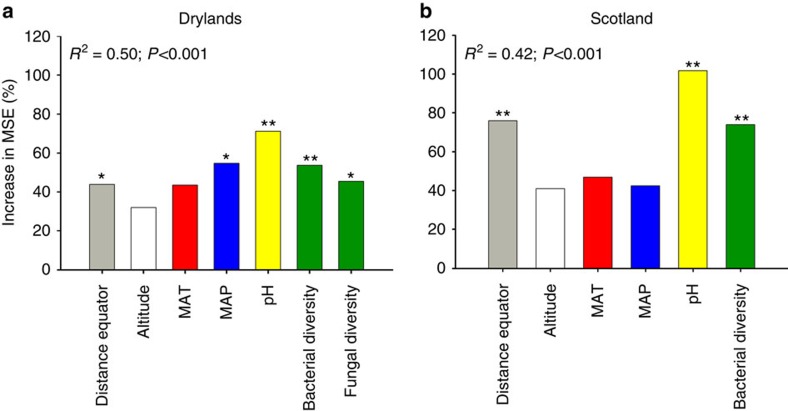
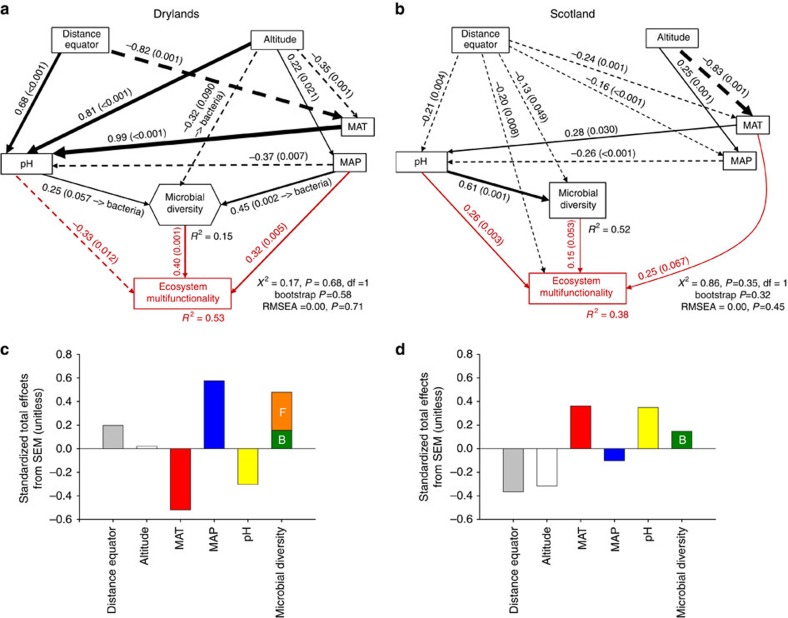
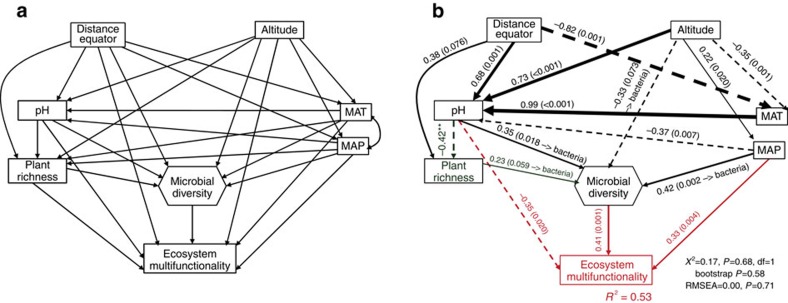
Despite the importance of microbial communities for ecosystem services and human welfare, the relationship between microbial diversity and multiple ecosystem functions and services (that is, multifunctionality) at the global scale has yet to be evaluated. Here we use two independent, large-scale databases with contrasting geographic coverage (from 78 global drylands and from 179 locations across Scotland, respectively), and report that soil microbial diversity positively relates to multifunctionality in terrestrial ecosystems. The direct positive effects of microbial diversity were maintained even when accounting simultaneously for multiple multifunctionality drivers (climate, soil abiotic factors and spatial predictors). Our findings provide empirical evidence that any loss in microbial diversity will likely reduce multifunctionality, negatively impacting the provision of services such as climate regulation, soil fertility and food and fibre production by terrestrial ecosystems.


Figures

Figure 1
Figure 1. Relationships between microbial diversity and ecosystem multifunctionality.
Results are shown for the Drylands (bacteria (a) and fungi (b)) and Scotland (bacteria (c)) data sets. The solid and dashed lines represent the fitted ordinary least squares (OLS) and simultaneous autoregression (SAR) models, respectively. Results of regressions are as follows: (a) OLS, R2=0.118, P=0.012, AICc=133.463; SAR, R2=0.101, P=0.005, AICc=135.013; (b) OLS, R2=0.235, P=0.002, AICc=122.399; SAR, R2=0.215, P<0.001, AICc=124.433 (c) OLS, R2=0.226, P<0.001, AICc=265.539; SAR, R2=0.222, P<0.001, AICc=266.574.
Figure 2
Figure 2. Main predictors of ecosystem multifunctionality.
The figure shows the Random Forest mean predictor importance (% of increase of MSE) of environmental drivers and microbial diversity (Shannon index, bits) on ecosystem multifunctionality for the Drylands (a) and Scotland (b) data sets. Significance levels of each predictor are as follows: *P<0.05 and **P<0.01. MAT, mean annual temperature; MAP, mean annual precipitation.
Figure 3
Figure 3. Direct and indirect effects of space, climate, soil pH and microbial diversity on ecosystem multifunctionality.
Structural equation models are shown for the Drylands (a,c) and Scotland (b,d) data sets. Numbers adjacent to arrows are indicative of the effect-size (bootstrap P value) of the relationship. Continuous and dashed arrows indicate positive and negative relationships, respectively. Spatial effects have no +/− sign. The width of arrows is proportional to the strength of path coefficients. R2 denotes the proportion of variance explained. (c,d) Standardized total effects (direct plus indirect effects) derived from the structural equation models depicted above. Capital letters B and F within standardized total effects bars indicate the effects of bacterial and fungal diversity, respectively, in the Drylands data set. MAT, mean annual temperature; MAP, mean annual precipitation.
Figure 4
Figure 4. Direct and indirect effects of space, climate, soil pH, plant richness and microbial diversity on ecosystem multifunctionality in global drylands.
A priori (a) and final (b) structural equation models including plant richness as a predictor of ecosystem multifunctionality are shown. Numbers adjacent to arrows indicate the effect-size of the relationship. Continuous and dashed arrows indicate positive and negative relationships, respectively. The width of arrows is proportional to the strength of path coefficients. R2 denotes the proportion of variance explained.

References

    1. Ehrlich P. R. & Ehrlich A. H. Extinction: The Causes and Consequences of the Disappearance of Species Random House (1981).
    1. Tilman D., Lehman D. & Thompson K. Plant diversity and ecosystem productivity: theoretical considerations. Proc. Natl Acad. Sci. USA 94, 1857–1861 (1997). - PMC - PubMed
    1. Cardinale B. J. et al.. The functional role of producer diversity in ecosystems. Am. J. Bot. 98, 572–592 (2011). - PubMed
    1. Lefcheck J. S. et al.. Biodiversity enhances ecosystem multifunctionality across trophic levels and habitats. Nat. Commun. 6, 6936 (2015). - PMC - PubMed
    1. Bell T. et al.. The contribution of species richness and composition to bacterial services. Nature 436, 1157–1160 (2005). - PubMed

Publication types

LinkOut - more resources