. 2016 Jan 28:7:10274.
doi: 10.1038/ncomms10274.

Cytotoxicity of crystals involves RIPK3-MLKL-mediated necroptosis

Affiliations

Cytotoxicity of crystals involves RIPK3-MLKL-mediated necroptosis

Shrikant R Mulay et al. Nat Commun. .

Abstract

Crystals cause injury in numerous disorders, and induce inflammation via the NLRP3 inflammasome, however, it remains unclear how crystals induce cell death. Here we report that crystals of calcium oxalate, monosodium urate, calcium pyrophosphate dihydrate and cystine trigger caspase-independent cell death in five different cell types, which is blocked by necrostatin-1. RNA interference for receptor-interacting protein kinase 3 (RIPK3) or mixed lineage kinase domain like (MLKL), two core proteins of the necroptosis pathway, blocks crystal cytotoxicity. Consistent with this, deficiency of RIPK3 or MLKL prevents oxalate crystal-induced acute kidney injury. The related tissue inflammation drives TNF-α-related necroptosis. Also in human oxalate crystal-related acute kidney injury, dying tubular cells stain positive for phosphorylated MLKL. Furthermore, necrostatin-1 and necrosulfonamide, an inhibitor for human MLKL suppress crystal-induced cell death in human renal progenitor cells. Together, TNF-α/TNFR1, RIPK1, RIPK3 and MLKL are molecular targets to limit crystal-induced cytotoxicity, tissue injury and organ failure.


Figures

Figure 1
Figure 1. Crystals induce primary cell necrosis.
(a): Various crystals were incubated with tubular epithelial cells as indicated. Images show the crystal shapes at a magnification of × 1,000 (left), TEM images shows that these crystals induce necrosis of tubular epithelial cells as indicated by ruptured plasma membranes (middle, × 2,000), scale bar, 2 μm. The images on the right show the same rhodamine-labelled monolayers (red) 24 h later. When Sytox green is added to the medium cells with permeable plasma membranes turn green indicating cell death (× 200), scale bar, 40 μm. (b) Flow cytometry was used to define the type and stage of tubular cell (MTC) death on CaOx crystal exposure or ultraviolet light type B for 90 s (s) over a period of 50 h as described in methods. Data for viable cells, apoptotic cells and necrotic cells are expressed as the percentage of viable cells±s.e.m. of all cells for each time point. (c): The graphs show a quantitative analysis of the same experiment displaying all different phenotypes of tubular epithelial cells. Flow cytometry cell death definitions are described in the methods section. (d) Mouse tubular epithelial cell viability on crystal exposure by 3-(4,5-dimethylthiazol-2-yl)-2,5-diphenyltetrazolium bromide assay with and without the pan-caspase inhibitor ZVAD–FMK–FMK. All data are mean±s.e.m. of at least three independent experiments. CaOx, MSU, CPPD, NS, not significant. *P<0.05 versus medium control, ***P<0.001 versus respective control. TEM, transmission electron microscopy.
Figure 2
Figure 2. Crystal cytotoxicity involves the necroptosis pathway.
(a): Protein expression of TNFR1, RIPK1 and RIPK3 was determined by western blot from total proteins isolated 18 h after stimulation of mouse tubular epithelial cells with crystals of CaOx (1,000 μg ml−1), MSU (500 μg ml−1), CPPD (500 μg ml−1) and cystine (500 μg ml−1). β-actin was used as loading control. (b) Mouse tubular epithelial cells were exposed to different concentrations of CaOx, MSU, CPPD or cystine crystals as indicated in the presence or absence of necrostatin (Nec)-1 (100 μM) together with the pan-caspase inhibitor ZVAD–FMK–FMK (10 μM). Cell viability was assessed by MTT assay 24 h later. Data are expressed as mean cell viability±s.e.m. of three independent experiments. Baseline viability is set as 100%. (c) In similar experiments necrotic tubular epithelial cells were identified via propidium iodide positivity and the results were expressed as mean fluorescent intensity on digital analysis of pictures taken from culture dishes. Representative images are shown at an original magnification of × 200, scale bar, 40 μm. Data were analysed using Student's t-test. *P<0.05, **P<0.01 and ***P<0.001 versus respective medium control. NS, not significant. MTT, 3-(4,5-dimethylthiazol-2-yl)-2,5-diphenyltetrazolium bromide.
Figure 3
Figure 3. Suppression of RIPK3 and MLKL prevents crystal cytotoxicity.
(ac) Mouse tubular epithelial cells were transfected with specific small inhibitor (si) RNA for RIPK3 and MLKL or a control siRNA of scrambled sequence before being exposed to crystals of CaOx (1,000 μg ml−1), MSU (500 μg ml−1), CPPD (500 μg ml−1) and cystine (500 μg ml−1). Cell viability was assessed by MTT assay (a) and cell death was assessed quantifying PI positivity (b) and C shows representative images 24 h later. Original image magnification: × 200, scale bar, 100 μm. (d) Mouse tubular epithelial cells were pretreated with RIPK3 inhibitor dabrafenib before exposing to different type crystals. Cell viability was assessed by MTT assay 24 h later. Data are expressed as mean±s.e.m. of three independent experiments, and was analysed using Student's t-test. Baseline viability is set as 100%. *P<0.05, **P<0.01 and ***P<0.001 either versus control siRNA. MTT, 3-(4,5-dimethylthiazol-2-yl)-2,5-diphenyltetrazolium bromide; PI, prodidium iodide.
Figure 4
Figure 4. Acute oxalate nephropathy involves tubular epithelial cell necrosis.
Oxalate exposure leads to diffuse intrarenal crystal formation as displayed by Pizzolato stain (a), scale bar, 1 mm. In contrast to healthy control mice (b) CaOx crystals form large stone-like plugs that obstruct the tubular lumen focally (c) smaller crystals attach to the luminal surface and also appear within the tubular cell cytoplasm. Scale bar, 20 μm (d) Scanning electron microscopy view of the lumen of CaOx exposed tubules confirms disruption of the proximal tubular brush boarder. Scale bar, 10 μm. Transmission electron microscopy shows intact proximal (e) and distal tubules (f) of control mice and luminal crystal plugs and intracellular crystals in mice exposed to CaOx (g). Scale bar, 5 μm. In many tubules crystal deposition is spatially associated with tubular epithelial cell necrosis, characterized by organelle swelling, cytoplasmic oedema and rupture of the plasma membrane with nuclear expulsion ((h) and all four panels of (i)). Scale bar, 2 μm. (j) Freeze fracture electron microscopy shows sheets of CaOx crystals (arrow head) in the cytoplasm (*) of tubular epithelial cells. Scale bar, 100 nm.
Figure 5
Figure 5. Oxalate nephropathy in C57BL/6 mice requires RIPK3 and MLKL.
(a) Oxalate injection to C57BL/6 mice (n=5) induced intrarenal mRNA expression of TNFR1, RIPK1, RIPK3 and MLKL as determined by RT–PCR from total kidney isolates. (b) Oxalate feeding to wild-type mice as well as to Ripk3- and Mlkl-deficient mice of the same genetic background resulted in identical amounts of CaOx crystal deposition after 24 h as quantified by morphometry of Pizzolato-stained kidney sections. (c,d) Oxalate nephropathy in wild-type mice was associated with increased plasma creatinine (c) and TUNEL positive cells (d), which was both attenuated in the gene deficient mouse strains. (e) PAS staining illustrated tubular necrosis at the corticomedullary junction in wild-type mice. Original image magnification: × 100. TUNEL staining identified dying cells (red), with counterstaining for laminin (green) and cell nuclei (DAPI, white). Original image magnification: × 200. Scale bar, 0.5 mm (upper panel); 20 μm (lower panel). (f) Tubular injury was quantified by semiquantitative scoring of PAS-stained section as described in methods. (g) Neutrophils were identified by immunostaining and counted per high power field. (h) RT–PCR from total kidney isolates quantified intrarenal mRNA expression of the tubular injury markers Kim-1 and π-GST. Data are means±s.e.m. from five mice in each group. Data were analysed using one-way ANOVA with post hoc Bonferroni's correction. *P<0.05, ***P<0.001 versus wild-type mice. ANOVA, analysis of variance; PAS, periodic acid-Schiff; RT–PCR, reverse transcription PCR.
Figure 6
Figure 6. Necrostatin-1 and neutrophil recruitment.
(a,b): i.p. injection of CaOx, MSU, CPPD or cystine crystals into C57BL/6 mice (n=4 in each group) induces neutrophil recruitment to the peritoneal cavity as determined by flow cytometry of peritoneal lavage fluids. This process is not affected by concomitant necrostatin-1 treatment. A shows representative flow cytometry data for each crystal presented as mean fluorescence intensity for the neutrophil marker. (b) Shows data of each mouse with the mean of wild-type mice set as 100%. NS, not significant. (c) Similar experiments using the air pouch model of neutrophil recruitment gave identical results (n=5 in each group) and are expressed in the same manner. (df) In vivo microscopy studies of the postischemic musculus cremaster were performed as a second model of injury-associated and ROS-dependent neutrophil recruitment in C57BL/6 mice. Necrostatin-1 significantly reduced the microvascular leakage of FITC-labelled dextran particles as illustrated by representative images in D at an original magnification of × 400, scale bar, 100 μm and quantitatively in (e). In the same experiment leukocyte transmigration from the microvasculature was quantified by counting from video recordings taken at baseline and at 60 and 120 min. Data are means±s.e.m. from seven mice in each group. Data were analysed using one-way ANOVA with post hoc Bonferroni's correction. *P<0.05, **P<0.01, ***P<0.001 versus vehicle control. ANOVA, analysis of variance.
Figure 7
Figure 7. Oxalate nephropathy in C57BL/6 mice requires TNFR1.
(a) Oxalate injection to wild-type mice as well as to Tnfr1- and Tnfr1/2-deficient mice of the same genetic background (n=5 in each group) resulted in identical amounts of CaOx crystal deposition after 24 h as quantified by morphometry of Pizzolato-stained kidney sections. (b,c) Oxalate nephropathy in wild-type mice was associated with increased plasma creatinine levels (b) and TUNEL positive cells (c), which were attenuated to similar extend in both gene deficient mouse strains. (d) PAS staining illustrated tubular necrosis at the corticomedullary junction in wild-type mice. Original image magnification: × 100. TUNEL staining identified dying cells (red), with counterstaining for laminin (green) and cell nuclei (DAPI, white). Original image magnification: × 200. Scale bar, 0.5 mm (upper panel), 20 μm (lower panel). (e) Tubular injury was quantified by semiquantitative scoring of PAS-stained section as described in methods. (f): Neutrophils were identified by immunostaining and counted per high power field. (g) RT-PCR from total kidney isolates quantified intrarenal mRNA expression of the tubular injury markers Kim-1 and π-GST. Data are means±s.e.m. from five mice in each group. Data were analysed using one-way ANOVA with post hoc Bonferroni's correction. *P<0.05, ***P<0.001 versus wild-type mice. ANOVA, analysis of variance; RT–PCR, reverse transcription PCR.
Figure 8
Figure 8. Etanercept, R-7050, and necrostatin-1 abrogate crystal nephropathy.
(ac): Oxalate injection to wild-type mice treated either with vehicle, the TNF-α blocker etanercept, the TNFR blocker R-7050 or necrostatin (Nec)-1 (n=5 in each group) resulted in identical amounts of CaOx crystal deposition after 24 h as quantified by morphometry of Pizzolato-stained kidney sections (a) but significantly reduced the levels of plasma creatinine (b) and the number of TUNEL positive cells in kidney sections (c). (d) PAS staining illustrated tubular necrosis at the corticomedullary junction in wild-type mice. Original image magnification: × 100. TUNEL staining identified dying cells (red), with counterstaining for laminin (green) and cell nuclei (DAPI, white). Original image magnification: × 200. Scale bar, 0.5 mm (upper panel), 20 μm (lower panel). (e) Tubular injury was quantified by semiquantitative scoring of PAS-stained section as described in methods. (f) Neutrophils were identified by immunostaining and counted per high power field. (g) RT–PCR from total kidney isolates quantified intrarenal mRNA expression of the tubular injury markers Kim-1 and π-GST. Data are means±s.e.m. from five mice in each group. Data were analysed using one-way ANOVA with post hoc Bonferroni's correction. *P<0.05, ***P<0.001 versus vehicle-treated mice. ANOVA, analysis of variance; RT–PCR, reverse transcription.
Figure 9
Figure 9. Necroptosis is involved in human acute oxalate nephropathy.
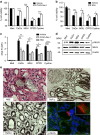
(ac) Primary renal human progenitor cells were pretreated with either ZVAD–FMK (10 μM) and Nec-1 (100 μM) or NSA (1 μM) before being exposed to CaOx (1000 μg ml−1), MSU (500 μg ml−1), CPPD (500 μg ml−1) and cystine (500 μg ml−1). Cell viability was assessed by MTT assay (a and b) and cell death was assessed quantifying PI positivity (c) 24 h later. Data are expressed as mean±s.e.m. of three independent experiments. Baseline viability is set as 100%. Data were analysed using Student's t-test. *P<0.05, **P<0.01, ***P<0.001 either versus vehicle control. (d) Primary renal human progenitor cells were stimulated with different crystals as indicated above for 18 h. The expression of Phospho-mlkl and total mlkl was detected by western blot with β-actin as a loading control. (e) Selective cases of human oxalate crystal-related acute kidney injury were stained with PAS and for TNF-α, TNFR1 and phosphorylated MLKL. Representative images are shown at an original magnification of 1:400. Scale bar, 40 μm. MTT, 3-(4,5-dimethylthiazol-2-yl)-2,5-diphenyltetrazolium bromide; PAS, periodic acid-Schiff; PI, prodidium iodide.
Figure 10
Figure 10. Schematic illustration of crystal-induced necroptosis and inflammation (necroinflammation).
During crystallophathies, crystals are formed and deposited inside the organ, for example, kidney stone disease or joint, for example, gouty arthritis. Upon crystallization, crystals are phagocytized by parenchymal cells where they activate the RIPK1, RIPK3 and MLKL pathway of necroptosis, a prototype form of regulated necrosis, by inducing a series of phosphorylation events. Cellular necroptosis lead to release of DAMPs, which activate immune cells surrounding the parenchymal cells. Activated immune cells release pro-inflammatory cytokines, for example, IL-1β, IL-6 and TNF-α and so on. Pro-inflammatory cytokines like TNF-α can also activate the RIPK1, RIPK3 and MLKL pathway of necroptosis via TNFR1. The auto-amplification loop between cell death and inflammation, called necroinflammation, leads to aggravation of tissue injury, and if remain uncontrolled then to organ failure. In the current settings, the loop of crystal-induced necroinflammation can be blocked by using a soluble TNFR1-hIgG1 fusion protein etanercept to inhibit TNF-α, TNFR inhibitor R-7050, RIPK1 inhibitor necrostatin-1 or MLKL inhibitor necrosulfonamide. RIPK, receptor-interacting protein kinase; MLKL, mixed lineage kinase domain like; DAMPs, danger associated molecular patterns; IL, interleukin; TNF, tumour-necrosis factor; TNFR, tumour-necrosis factor receptor.

References

    1. Martinon F., Petrilli V., Mayor A., Tardivel A. & Tschopp J. Gout-associated uric acid crystals activate the NALP3 inflammasome. Nature 440, 237–241 (2006). - PubMed
    1. Hornung V. et al.. Silica crystals and aluminum salts activate the NALP3 inflammasome through phagosomal destabilization. Nat. Immunol. 9, 847–856 (2008). - PMC - PubMed
    1. Dostert C. et al.. Innate immune activation through Nalp3 inflammasome sensing of asbestos and silica. Science 320, 674–677 (2008). - PMC - PubMed
    1. Duewell P. et al.. NLRP3 inflammasomes are required for atherogenesis and activated by cholesterol crystals. Nature 464, 1357–1361 (2010). - PMC - PubMed
    1. Mulay S. R. et al.. Calcium oxalate crystals induce renal inflammation by NLRP3-mediated IL-1beta secretion. J. Clin. Invest. 123, 236–246 (2013). - PMC - PubMed

Publication types

MeSH terms