. 2016 Jan;11(1):3-23.
doi: 10.1177/1745691615617439.

Top 10 Replicated Findings From Behavioral Genetics

Affiliations

Top 10 Replicated Findings From Behavioral Genetics

Robert Plomin et al. Perspect Psychol Sci. 2016 Jan.

Abstract

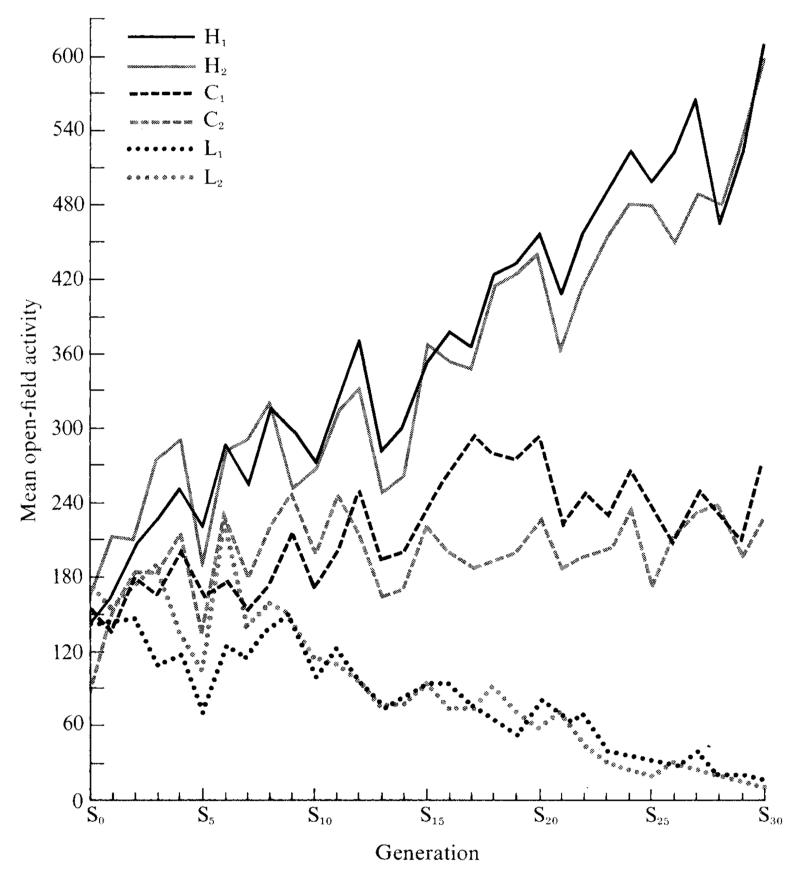
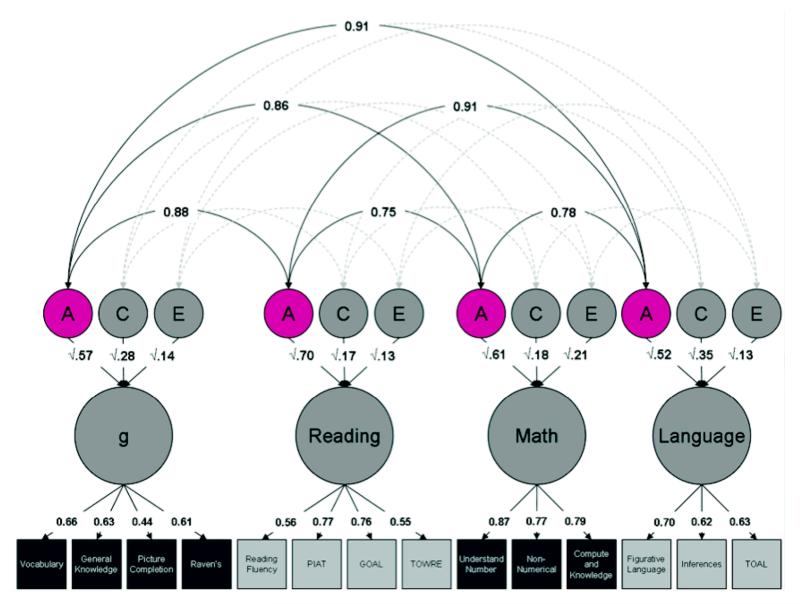
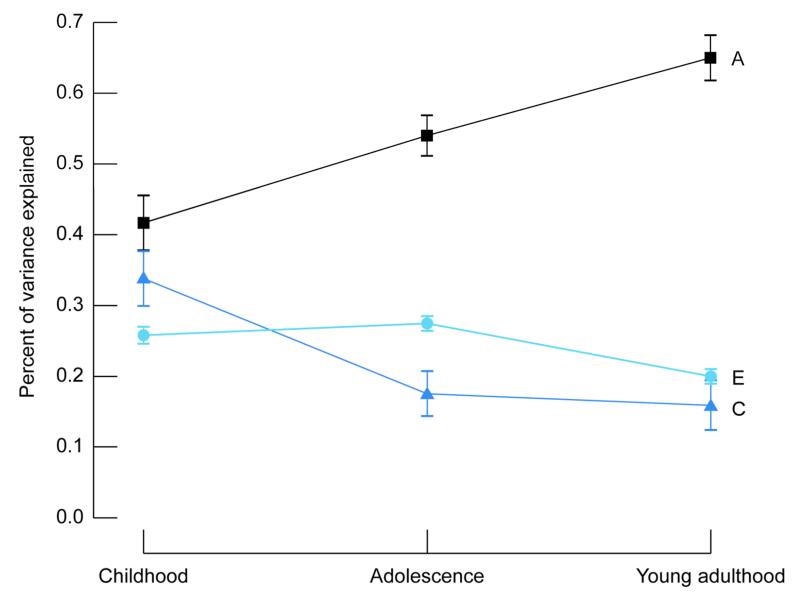
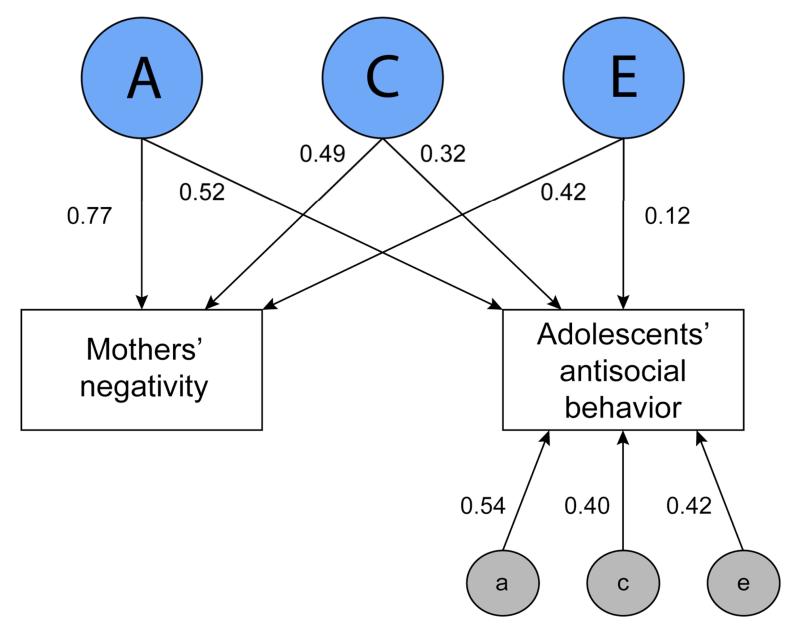
In the context of current concerns about replication in psychological science, we describe 10 findings from behavioral genetic research that have replicated robustly. These are "big" findings, both in terms of effect size and potential impact on psychological science, such as linearly increasing heritability of intelligence from infancy (20%) through adulthood (60%). Four of our top 10 findings involve the environment, discoveries that could have been found only with genetically sensitive research designs. We also consider reasons specific to behavioral genetics that might explain why these findings replicate.

Keywords: DNA; cognitive abilities; heritability; personality; psychopathology.


Figures

Figure 1
Figure 1
Results of a selection study of open-field activity in mice. Replication was built into the design: two lines were selected for high open-field activity (H1 and H2), two lines were selected for low open-field activity (L1 and L2), and two lines were randomly mated within each line to serve as controls (C1 and C2). After 30 generations of such selective breeding, a 30-fold average difference in activity had been achieved, with no overlap between the activity of the low and high lines. (From DeFries, Gervais & Thomas, 1978.)
Figure 2
Figure 2
Results of multivariate genetic latent variable analysis of general cognitive ability (g), reading, mathematics, and language of more than 5000 pairs of 12-year-old twins assessed on a web-based battery of measures. A = additive genetic effects; C = shared (common) environmental effects; E = nonshared environmental effects. Squares represent measured traits; circles represent latent factors. Multiple tests are used to index latent factors of g, reading, mathematics, and language. The lower tier of path coefficients represents factor loadings of the tests on the latent factor. The second tier of coefficients represents the genetic and environmental components of the variance of the latent variables – the path coefficients in this path diagram are the square roots of these coefficients. The curved arrows at the top represent genetic correlations, the extent to which genetic effects on one trait are correlated with genetic effects on another. The genetic contribution to the phenotypic correlation between two traits can be calculated as the product of the paths that connect them. For example, the genetic contribution to the phenotypic correlation between reading and math is √ .70 × .75 × √ .61 = 0.49. The phenotypic correlation is 0.76, which means that genetic factors account for 64% of the phenotypic correlation (i.e., .49 / .76 = .64). (From Davis, Haworth & Plomin, 2009.)
Figure 3
Figure 3
A meta-analysis of 11,000 pairs of twins showed that heritability (A) of intelligence increases significantly from childhood (age 9) to adolescence (age 12) and to young adulthood (age 17). Estimates of shared environmental influence (C) decreased significantly from childhood to adolescence. Nonshared environment (E) showed no change. (From Haworth et al., 2010.)
Figure 4
Figure 4
Results of bivariate model-fitting analysis between mothers’ negativity and adolescents’ antisocial behavior. The paths are standardized partial regressions (all significant at p < .05) from the latent variables representing genetic (A) and shared (C) and nonshared (E) environmental effects on the measured variables. The genetic contribution to the phenotypic correlation is the product of the standardized paths 0.77 × 0.52 = 0.40. Calculated in the same way, the environmental contributions to the phenotypic correlation are 0.16 for C and 0.05 for E. The phenotypic correlation, 0.61, is the sum of these three contributions. The sample consisted of 719 families with same-sex adolescent sibling pairs including twins, full siblings, half siblings and unrelated siblings. (Adapted from Pike, McGuire, Hetherington, Reiss & Plomin, 1996.)
Figure 5
Figure 5
A polygenic score based on a GWAS of educational attainment in adults correlates 0.15 with mathematics scores at age 16. (Adapted from Krapohl et al., 2015.)

Comment in

References

    1. Avinun R, Knafo A. Parenting as a reaction evoked by children's genotype: A meta-analysis of children-as-twins studies. Personality and Social Psychology Review. 2014;18:87–102. doi: 10.1177/1088868313498308. - PubMed
    1. Bakker M, van Dijk A, Wicherts JM. The rules of the game called psychological science. Perspectives on Psychological Science. 2012;7:543–554. doi: 10.1177/1745691612459060. - PubMed
    1. Baltes PB, Reese HW, Lipsitt LP. Life-span developmental psychology. Annual Review of Psychology. 1980;31:65–110. doi: 10.1146/annurev.ps.31.020180.000433. - PubMed
    1. Bartels M. Genetics of wellbeing and its components satisfaction with life, happiness, and quality of life: A review and meta-analysis of heritability studies. Behavior Genetics. 2015;45:137–156. doi: 10.1007/s10519-015-9713-y. - PMC - PubMed
    1. Bartels M, van den Oord EJ, Hudziak JJ, Rietveld MJ, Van Beijsterveldt CE, Boomsma DI. Genetic and environmental mechanisms underlying stability and change in problem behaviors at ages 3, 7, 10, and 12. Developmental Psychology. 2004;40:852–867. doi: 10.1037/0012-1649.40.5.852. - PubMed

Publication types

LinkOut - more resources