The effect of activation level on muscle function during locomotion: are optimal lengths and velocities always used?
- PMID: 26817770
- PMCID: PMC4795037
- DOI: 10.1098/rspb.2015.2832
The effect of activation level on muscle function during locomotion: are optimal lengths and velocities always used?
Abstract
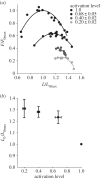
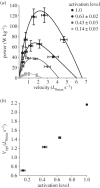
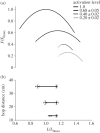
Skeletal muscle exhibits broad functional diversity, despite its inherent length and velocity constraints. The observed variation in morphology and physiology is assumed to have evolved to allow muscle to operate at its optimal length and velocity during locomotion. Here, we used the variation in optimum lengths and velocities that occurs with muscle activation level to experimentally test this assumption. Muscle ergometry and sonomicrometry were used to characterize force-length and power-velocity relationships, and in vivo operating lengths and velocities, at a range of activation levels. Operating lengths and velocities were mapped onto activation level specific force-length and power-velocity relationships to determine whether they tracked changing optima. Operating velocities decreased in line with decreased optimal velocities, suggesting that optimal velocities are always used. However, operating lengths did not change with changing optima. At high activation levels, fibres used an optimal range of lengths. However, at lower activation levels, fibres appeared to operate on the ascending limb of sub-maximally activated force-length relationships. This suggests that optimal lengths are only used when demand is greatest. This study provides the first mapping of operating lengths to activation level-specific optima, and as such, provides insight into our assumptions about the factors that determine muscle performance during locomotion.
Keywords: force–length; force–velocity; locomotion; recruitment.
© 2016 The Author(s).
Figures


Similar articles
-
On the ascent: the soleus operating length is conserved to the ascending limb of the force-length curve across gait mechanics in humans.J Exp Biol. 2012 Oct 15;215(Pt 20):3539-51. doi: 10.1242/jeb.070466. Epub 2012 Jul 5. J Exp Biol. 2012. PMID: 22771749
-
Determining the influence of muscle operating length on muscle performance during frog swimming using a bio-robotic model.Bioinspir Biomim. 2012 Sep;7(3):036018. doi: 10.1088/1748-3182/7/3/036018. Epub 2012 Jun 8. Bioinspir Biomim. 2012. PMID: 22677569
-
Fibre operating lengths of human lower limb muscles during walking.Philos Trans R Soc Lond B Biol Sci. 2011 May 27;366(1570):1530-9. doi: 10.1098/rstb.2010.0345. Philos Trans R Soc Lond B Biol Sci. 2011. PMID: 21502124 Free PMC article.
-
Some advances in integrative muscle physiology.Comp Biochem Physiol B Biochem Mol Biol. 1998 May;120(1):51-72. doi: 10.1016/s0305-0491(98)00023-6. Comp Biochem Physiol B Biochem Mol Biol. 1998. PMID: 9787778 Review.
-
Muscle mechanics: adaptations with exercise-training.Exerc Sport Sci Rev. 1996;24:427-73. Exerc Sport Sci Rev. 1996. PMID: 8744258 Review.
Cited by
-
Modeling muscle function using experimentally determined subject-specific muscle properties.J Biomech. 2021 Mar 5;117:110242. doi: 10.1016/j.jbiomech.2021.110242. Epub 2021 Jan 15. J Biomech. 2021. PMID: 33545605 Free PMC article.
-
Does the unusual phenomenon of sustained force circumvent the speed-endurance trade-off in the jaw muscle of the southern alligator lizard (Elgaria multicarinata)?J Exp Biol. 2025 Jan 15;228(2):JEB247979. doi: 10.1242/jeb.247979. Epub 2025 Jan 27. J Exp Biol. 2025. PMID: 39690956 Free PMC article.
-
Muscle Belly Gearing Positively Affects the Force-Velocity and Power-Velocity Relationships During Explosive Dynamic Contractions.Front Physiol. 2021 Aug 12;12:683931. doi: 10.3389/fphys.2021.683931. eCollection 2021. Front Physiol. 2021. PMID: 34456744 Free PMC article.
-
Can Strain Dependent Inhibition of Cross-Bridge Binding Explain Shifts in Optimum Muscle Length?Integr Comp Biol. 2018 Aug 1;58(2):174-185. doi: 10.1093/icb/icy050. Integr Comp Biol. 2018. PMID: 29873724 Free PMC article.
-
Dynamic Musculoskeletal Functional Morphology: Integrating diceCT and XROMM.Anat Rec (Hoboken). 2018 Feb;301(2):378-406. doi: 10.1002/ar.23714. Anat Rec (Hoboken). 2018. PMID: 29330951 Free PMC article.
References
-
- Hill AV. 1938. The heat of shortening and the dynamic constants of muscle. Proc. R. Soc. Lond. B 126, 136–195. (10.1098/rspb.1938.0050) - DOI
-
- Kier WM, Smith KK. 1985. Tongues, tentacles and trunks: the biomechanics of movement in muscular-hydrostats. Zoo. J. Linn. Soc. 83, 307–324. (10.1111/j.1096-3642.1985.tb01178.x) - DOI
-
- Alexander RM. 2002. Principles of animal locomotion. Princeton, NJ: Princeton university press.
Publication types
MeSH terms
Grants and funding
LinkOut - more resources
Full Text Sources
Other Literature Sources

