

Epigenome overlap measure (EPOM) for comparing tissue/cell types based on chromatin states
- PMID: 26817822
- PMCID: PMC4895267
- DOI: 10.1186/s12864-015-2303-9
Epigenome overlap measure (EPOM) for comparing tissue/cell types based on chromatin states
Abstract
Background: The dynamics of epigenomic marks in their relevant chromatin states regulate distinct gene expression patterns, biological functions and phenotypic variations in biological processes. The availability of high-throughput epigenomic data generated by next-generation sequencing technologies allows a data-driven approach to evaluate the similarities and differences of diverse tissue and cell types in terms of epigenomic features. While ChromImpute has allowed for the imputation of large-scale epigenomic information to yield more robust data to capture meaningful relationships between biological samples, widely used methods such as hierarchical clustering and correlation analysis cannot adequately utilize epigenomic data to accurately reveal the distinction and grouping of different tissue and cell types.
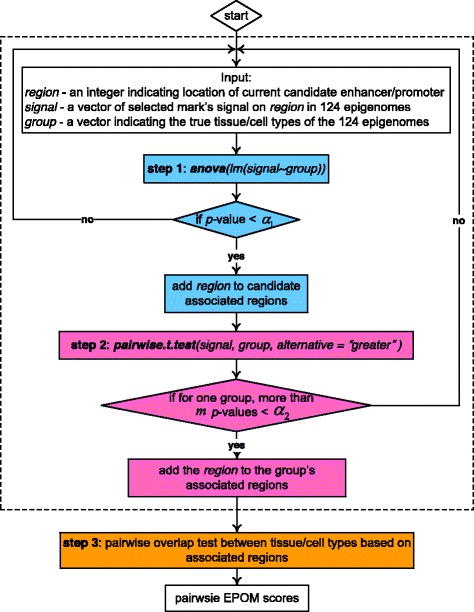
Methods: We utilize a three-step testing procedure-ANOVA, t test and overlap test to identify tissue/cell-type- associated enhancers and promoters and to calculate a newly defined Epigenomic Overlap Measure (EPOM). EPOM results in a clear correspondence map of biological samples from different tissue and cell types through comparison of epigenomic marks evaluated in their relevant chromatin states.
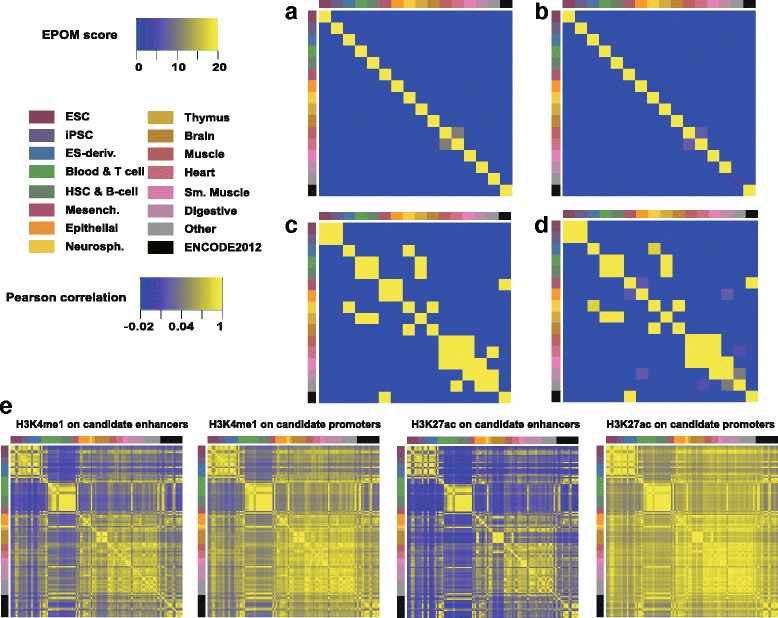
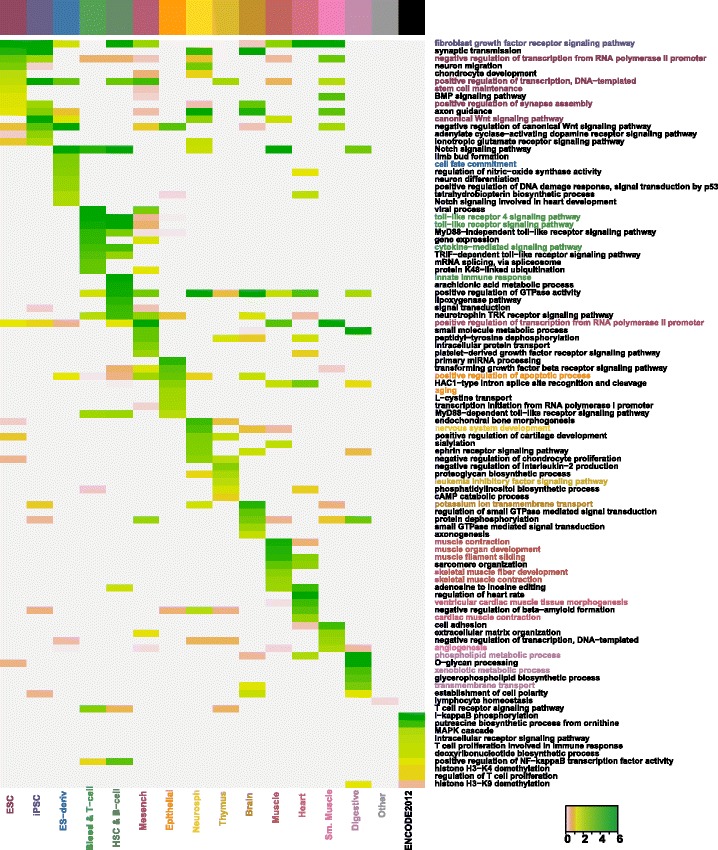
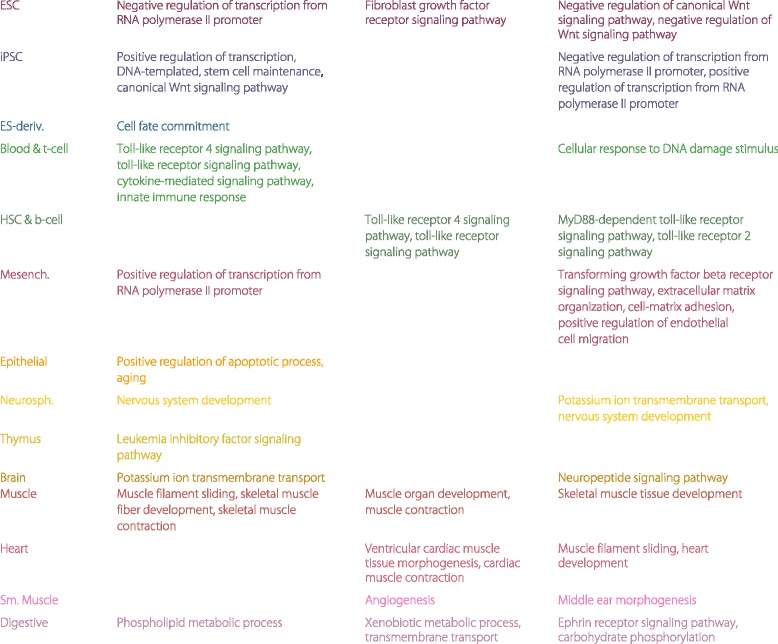
Results: Correspondence maps by EPOM show strong capability in distinguishing and grouping different tissue and cell types and reveal biologically meaningful similarities between Heart and Muscle, Blood & T-cell and HSC & B-cell, Brain and Neurosphere, etc. The gene ontology enrichment analysis both supports and explains the discoveries made by EPOM and suggests that the associated enhancers and promoters demonstrate distinguishable functions across tissue and cell types. Moreover, the tissue/cell-type-associated enhancers and promoters show enrichment in the disease-related SNPs that are also associated with the corresponding tissue or cell types. This agreement suggests the potential of identifying causal genetic variants relevant to cell-type-specific diseases from our identified associated enhancers and promoters.
Conclusions: The proposed EPOM measure demonstrates superior capability in grouping and finding a clear correspondence map of biological samples from different tissue and cell types. The identified associated enhancers and promoters provide a comprehensive catalog to study distinct biological processes and disease variants in different tissue and cell types. Our results also find that the associated promoters exhibit more cell-type-specific functions than the associated enhancers do, suggesting that the non-associated promoters have more housekeeping functions than the non-associated enhancers.
Figures


Similar articles
-
Integrating epigenomic data and 3D genomic structure with a new measure of chromatin assortativity.Genome Biol. 2016 Jul 8;17(1):152. doi: 10.1186/s13059-016-1003-3. Genome Biol. 2016. PMID: 27391817 Free PMC article.
-
Chromatin interaction networks revealed unique connectivity patterns of broad H3K4me3 domains and super enhancers in 3D chromatin.Sci Rep. 2017 Oct 31;7(1):14466. doi: 10.1038/s41598-017-14389-7. Sci Rep. 2017. PMID: 29089515 Free PMC article.
-
DNA methylation regulates discrimination of enhancers from promoters through a H3K4me1-H3K4me3 seesaw mechanism.BMC Genomics. 2017 Dec 12;18(1):964. doi: 10.1186/s12864-017-4353-7. BMC Genomics. 2017. PMID: 29233090 Free PMC article.
-
Modification of enhancer chromatin: what, how, and why?Mol Cell. 2013 Mar 7;49(5):825-37. doi: 10.1016/j.molcel.2013.01.038. Mol Cell. 2013. PMID: 23473601 Free PMC article. Review.
-
Demystifying the secret mission of enhancers: linking distal regulatory elements to target genes.Crit Rev Biochem Mol Biol. 2015;50(6):550-73. doi: 10.3109/10409238.2015.1087961. Epub 2015 Oct 8. Crit Rev Biochem Mol Biol. 2015. PMID: 26446758 Free PMC article. Review.
Cited by
-
Large-scale mapping of mammalian transcriptomes identifies conserved genes associated with different cell states.Nucleic Acids Res. 2017 Feb 28;45(4):1657-1672. doi: 10.1093/nar/gkw1256. Nucleic Acids Res. 2017. PMID: 27980097 Free PMC article.
-
EpiAlign: an alignment-based bioinformatic tool for comparing chromatin state sequences.Nucleic Acids Res. 2019 Jul 26;47(13):e77. doi: 10.1093/nar/gkz287. Nucleic Acids Res. 2019. PMID: 31045217 Free PMC article.
References
Publication types
MeSH terms
Substances
LinkOut - more resources
Full Text Sources
Other Literature Sources
