

Genomic variations and distinct evolutionary rate of rare alleles in Arabidopsis thaliana
- PMID: 26817829
- PMCID: PMC4728917
- DOI: 10.1186/s12862-016-0590-7
Genomic variations and distinct evolutionary rate of rare alleles in Arabidopsis thaliana
Abstract
Background: The variation rate in genomic regions associated with different alleles, impacts to distinct evolutionary patterns involving rare alleles. The rare alleles bias towards genome-wide association studies (GWASs), aim to detect different variants at genomic loci associated with single-nucleotide polymorphisms (SNPs) inclined to produce different haplotypes. Here, we sequenced Arabidopsis thaliana and compared its coding and non-coding genomic regions with its closest outgroup relative, Arabidopsis lyrta, which accounted for the ancestral misinference. The use of genome-wide SNPs interpret the genetic architecture of rare alleles in Arabidopsis thaliana, elucidating a significant departure from a neutral evolutionary model and the pattern of polymorphisms around a selected locus will exclusively influence natural selection.
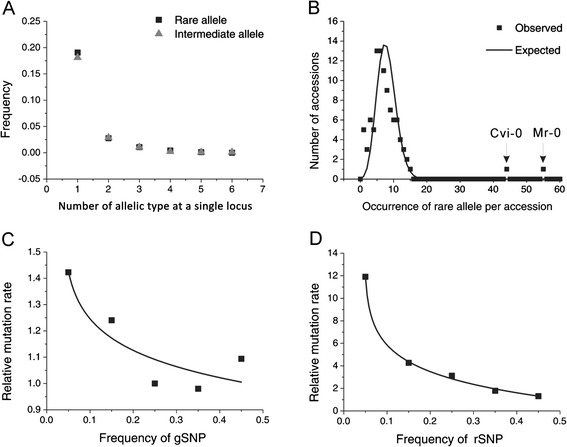
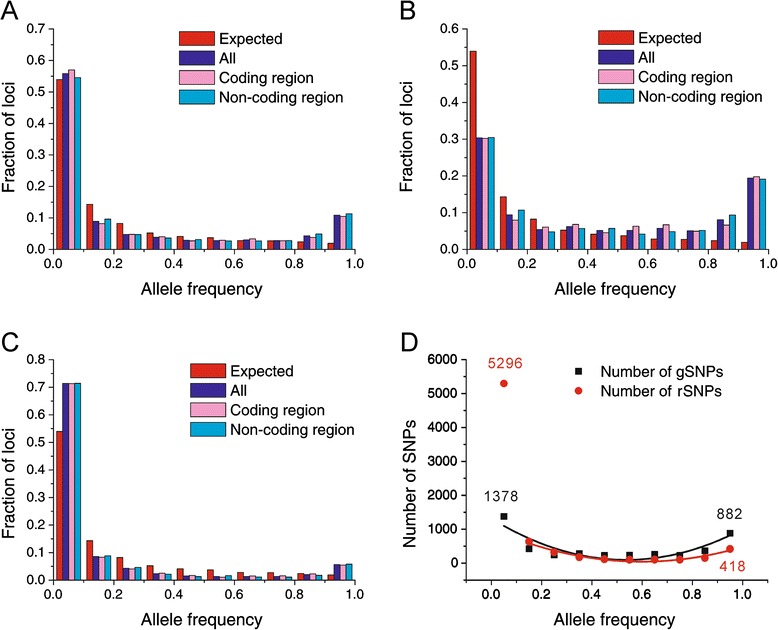
Results: We found 23.4% of the rare alleles existing randomly in the genome. Notably, in our results significant differences (P < 0.01) were estimated in the relative rates between rare versus intermediate alleles, between fixed versus non-fixed mutations, and between type I versus type II rare-mutations by using the χ (2)-test. However, the rare alleles generating negative values of Tajima's D suggest that they generated under selective sweeps. Relative to polymorphic sites including SNPs, 67.5% of the fixed mutations were attributed, indicating major contributors to speciation. Substantially, an evolution occurred in the rare allele that was 1.42-times faster than that in a major haplotype.
Conclusion: Our results interpret that rare alleles fits a random occurrence model, indicating that rare alleles occur at any locus in a genome and in any accession in a species. Based on the higher relative rate of derived to ancient mutations and higher average D xy, we conclude that rare alleles evolve faster than the higher frequency alleles. The rapid evolution of rare alleles indicates that they must have been newly generated with fixed mutations, compared with the other alleles. Eventually, PCR and sequencing results, in the flanking regions of rare allele loci confirm that they are of short extension, indicating the absence of a genome-wide pattern for a rare haplotype. The indel-associated model for rare alleles assumes that indel-associated mutations only occur in an indel heterozygote.
Figures
Similar articles
-
A genome-wide survey of R gene polymorphisms in Arabidopsis.Plant Cell. 2006 Aug;18(8):1803-18. doi: 10.1105/tpc.106.042614. Epub 2006 Jun 23. Plant Cell. 2006. PMID: 16798885 Free PMC article.
-
Transcription-related mutations and GC content drive variation in nucleotide substitution rates across the genomes of Arabidopsis thaliana and Arabidopsis lyrata.BMC Evol Biol. 2007 Apr 23;7:66. doi: 10.1186/1471-2148-7-66. BMC Evol Biol. 2007. PMID: 17451608 Free PMC article.
-
A multilocus sequence survey in Arabidopsis thaliana reveals a genome-wide departure from a neutral model of DNA sequence polymorphism.Genetics. 2005 Mar;169(3):1601-15. doi: 10.1534/genetics.104.033795. Epub 2005 Jan 16. Genetics. 2005. PMID: 15654111 Free PMC article.
-
Genomic variation in Arabidopsis: tools and insights from next-generation sequencing.Chromosome Res. 2014 Jun;22(2):103-15. doi: 10.1007/s10577-014-9420-1. Chromosome Res. 2014. PMID: 24801344 Review.
-
Genome-wide scans for footprints of natural selection.Philos Trans R Soc Lond B Biol Sci. 2010 Jan 12;365(1537):185-205. doi: 10.1098/rstb.2009.0219. Philos Trans R Soc Lond B Biol Sci. 2010. PMID: 20008396 Free PMC article. Review.
Cited by
-
Dissecting the molecular basis of spike traits by integrating gene regulatory networks and genetic variation in wheat.Plant Commun. 2024 May 13;5(5):100879. doi: 10.1016/j.xplc.2024.100879. Epub 2024 Mar 14. Plant Commun. 2024. PMID: 38486454 Free PMC article.
-
Evolutionary history of an Alpine Archaeognath (Machilis pallida): Insights from different variant.Ecol Evol. 2023 Jul 3;13(7):e10227. doi: 10.1002/ece3.10227. eCollection 2023 Jul. Ecol Evol. 2023. PMID: 37404697 Free PMC article.
-
Unlocking Allelic Diversity for Sustainable Development of Salinity Stress Tolerance in Rice.Curr Genomics. 2021 Dec 30;22(6):393-403. doi: 10.2174/1389202922666211005121412. Curr Genomics. 2021. PMID: 35340363 Free PMC article. Review.
-
The Empirical Distribution of Singletons for Geographic Samples of DNA Sequences.Front Genet. 2017 Sep 29;8:139. doi: 10.3389/fgene.2017.00139. eCollection 2017. Front Genet. 2017. PMID: 29033977 Free PMC article.
References
Publication types
MeSH terms
LinkOut - more resources
Full Text Sources
Other Literature Sources
