. 2016 Jan 28:16:27.
doi: 10.1186/s12862-016-0592-5.

Age-related association of venom gene expression and diet of predatory gastropods

Affiliations

Age-related association of venom gene expression and diet of predatory gastropods

Dan Chang et al. BMC Evol Biol. .

Abstract

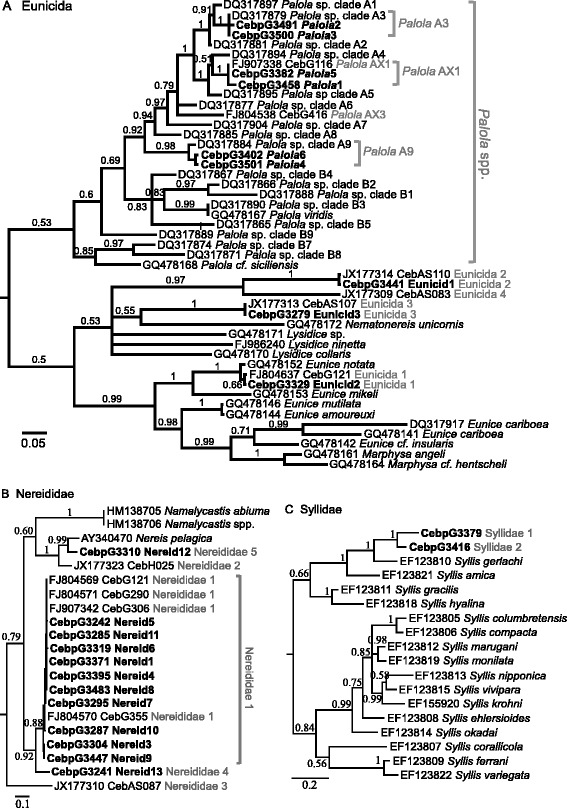
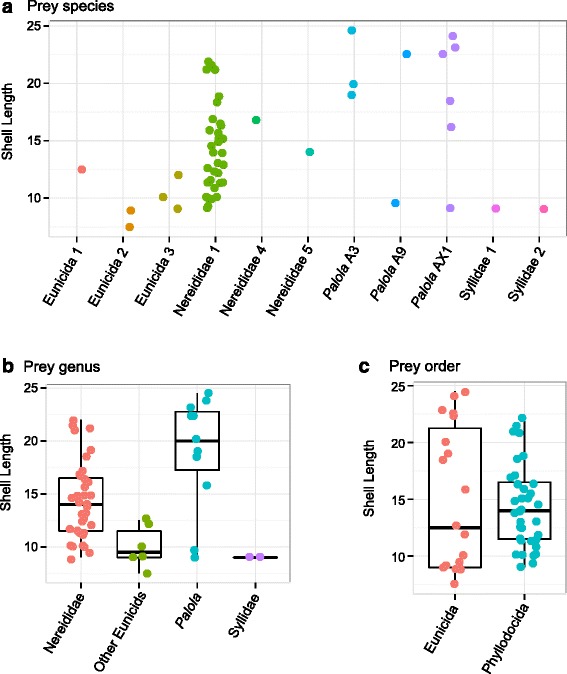
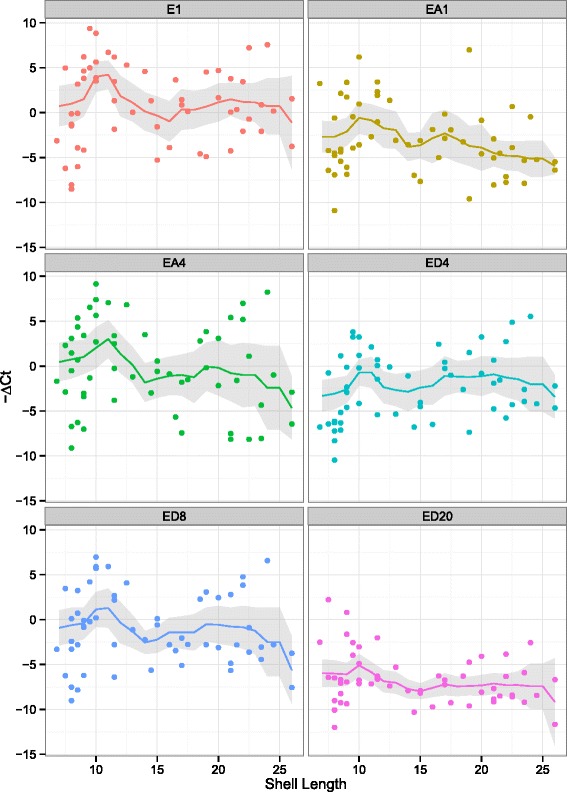
Background: Venomous organisms serve as wonderful systems to study the evolution and expression of genes that are directly associated with prey capture. To evaluate the relationship between venom gene expression and prey utilization, we examined these features among individuals of different ages of the venomous, worm-eating marine snail Conus ebraeus. We determined expression levels of six genes that encode venom components, used a DNA-based approach to evaluate the identity of prey items, and compared patterns of venom gene expression and dietary specialization.

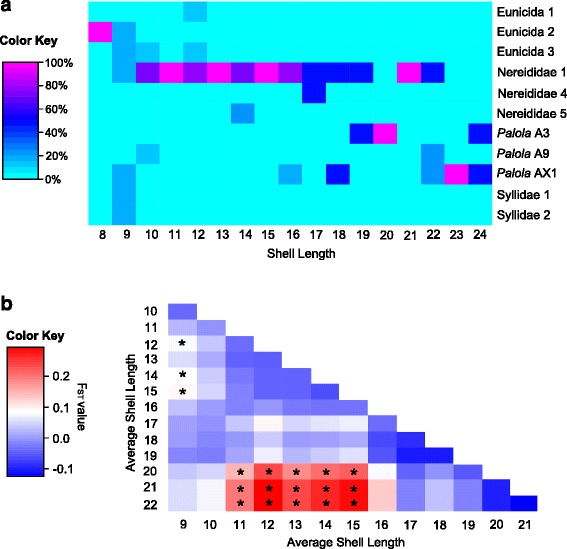
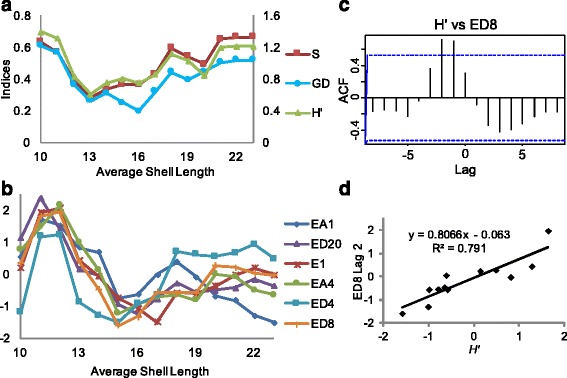
Results: C. ebraeus exhibits two major shifts in diet with age-an initial transition from a relatively broad dietary breadth to a narrower one and then a return to a broader diet. Venom gene expression patterns also change with growth. All six venom genes are up-regulated in small individuals, down-regulated in medium-sized individuals, and then either up-regulated or continued to be down-regulated in members of the largest size class. Venom gene expression is not significantly different among individuals consuming different types of prey, but instead is coupled and slightly delayed with shifts in prey diversity.

Conclusion: These results imply that changes in gene expression contribute to intraspecific variation of venom composition and that gene expression patterns respond to changes in the diversity of food resources during different growth stages.


Figures

Fig. 1
Fig. 1
Phylogenies of 16S rRNA sequences of fecal samples of C. ebraeus and known polychaete species. Bayesian posterior probabilities are labeled at nodes of major clades. Sequences downloaded from GenBank are labeled with their respective accession numbers. Sequences obtained in this study are highlighted in bold. Putative prey species are labeled in grey next to the sequence names. a Phylogeny of species of the order Eunicida with GTR [76] + I + G model. b Phylogeny of species of the family Nereididae with GTR + G model. c Phylogeny of species of the family Syllidae with GTR + G model
Fig. 2
Fig. 2
Scatterplots and superimposed boxplots of shell lengths (mm) of C. ebraeus individuals consuming different types of prey. a Prey species, b prey genera, c prey orders
Fig. 3
Fig. 3
Heatmaps of dietary ontogeny of C. ebraeus individuals. a Heat map of frequencies of prey species consumed by C. ebraeus individuals of the same shell lengths. b Heat map of pairwise D ST values between size classes of sliding-window analyses (window size = 5 mm). P-values are estimated with simulations of 10,100 replicates, and significant results (P-value < 0.05) are labeled with asterisks in the cells
Fig. 4
Fig. 4
Relative levels of expression of the six conotoxin genes against shell lengths. The trend lines represent average values calculated from sliding window analyses (window size = 5 mm), and the shades are confidence intervals of the mean
Fig. 5
Fig. 5
Patterns of ontogenetic shifts of dietary diversities and levels of conotoxin gene expression. Average levels of expression of six conotoxin genes and dietary diversities are calculated with a sliding window approach (with window size of 5 mm in shell lengths). a Plot of dietary variables versus average shell lengths. Shannon’s index (H’), Gini-Simpson’s index (S), and average genetic distances (GD). The Y-axis on the left represents S and GD, whereas the Y-axis on the right represents H’. b Plot of relative levels of expression of six conotoxin loci EA1, ED20, E1, EA4, ED4, and ED8 versus shell lengths. The expression levels are centered and standardized. c Cross-correlation of conotoxin gene expression levels and dietary diversities through increasing shell lengths, using conotoxin locus ED8 and dietary variable H’ as an example. Cross-correlations of all conotoxin genes and dietary variables are illustrated in Additional file 1: Figure S5. Y-axis: correlation coefficient of two series; X-axis: lag in shell lengths of H’ in comparison to conotoxin gene expression; blue dashed lines: 95 % confidence intervals. d Linear regression of lag of expression levels of locus ED8 with the dietary variable H’ by a time period equivalent to 2 mm in shell lengths. Regression analyses of expression levels of all conotoxin genes and dietary variables are shown in Additional file 1: Figure S6

References

    1. Palkovacs EP, Post DM. Eco-evolutionary interactions between predators and prey: Can predator-induced changes to prey communities feed back to shape predator foraging traits? Evol Ecol Res. 2008;10:699–720.
    1. Sanford E, Worth DJ. Local adaptation along a continuous coastline: prey recruitment drives differentiation in a predatory snail. Ecology. 2010;91(3):891–901. doi: 10.1890/09-0536.1. - DOI - PubMed
    1. Daltry JC, Wuster W, Thorpe RS. Diet and snake venom evolution. Nature. 1996;379(6565):537–40. doi: 10.1038/379537a0. - DOI - PubMed
    1. Gibbs HL, Sanz L, Chiucchi JE, Farrell TM, Calvete JJ. Proteomic analysis of ontogenetic and diet-related changes in venom composition of juvenile and adult Dusky Pigmy rattlesnakes (Sistrurus miliarius barbouri) J Proteomics. 2011;74(10):2169–79. doi: 10.1016/j.jprot.2011.06.013. - DOI - PubMed
    1. Mackessy SP, Sixberry NA, Heyborne WH, Fritts T. Venom of the Brown Treesnake, Boiga irregularis: Ontogenetic shifts and taxa-specific toxicity. Toxicon. 2006;47(5):537–48. doi: 10.1016/j.toxicon.2006.01.007. - DOI - PubMed

Publication types

LinkOut - more resources