

Combined image guided monitoring the pharmacokinetics of rapamycin loaded human serum albumin nanoparticles with a split luciferase reporter
- PMID: 26818100
- PMCID: PMC4753573
- DOI: 10.1039/c5nr07308a
Combined image guided monitoring the pharmacokinetics of rapamycin loaded human serum albumin nanoparticles with a split luciferase reporter
Abstract
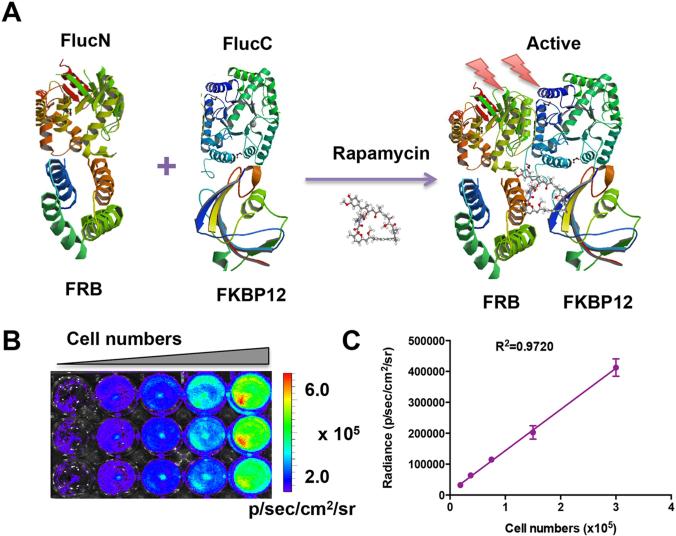
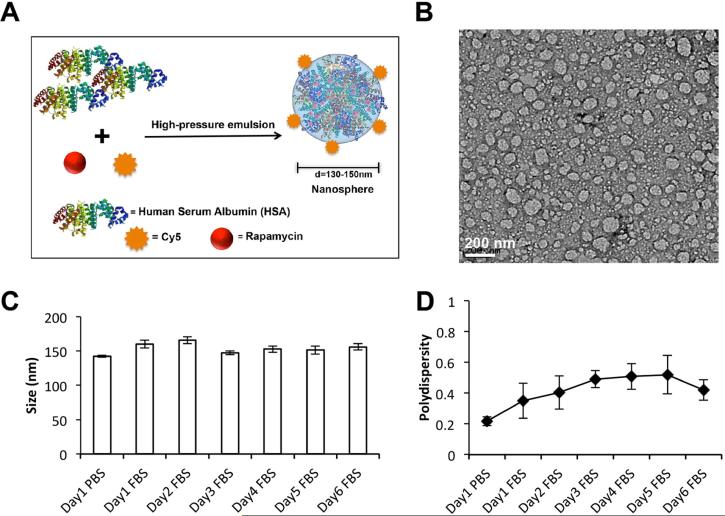
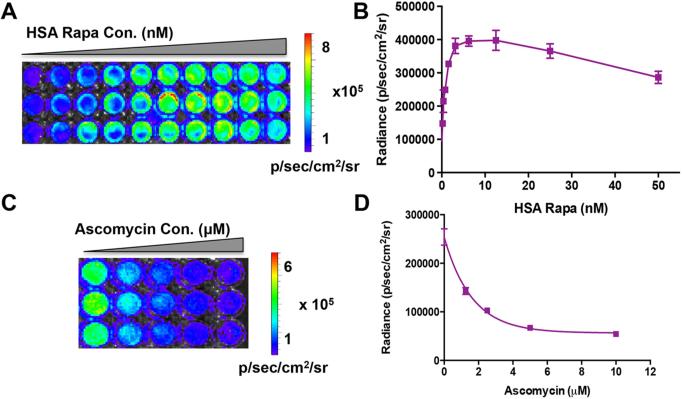
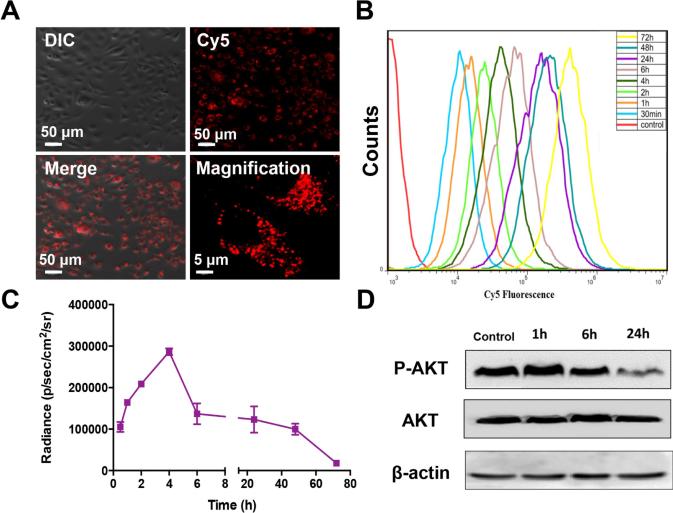
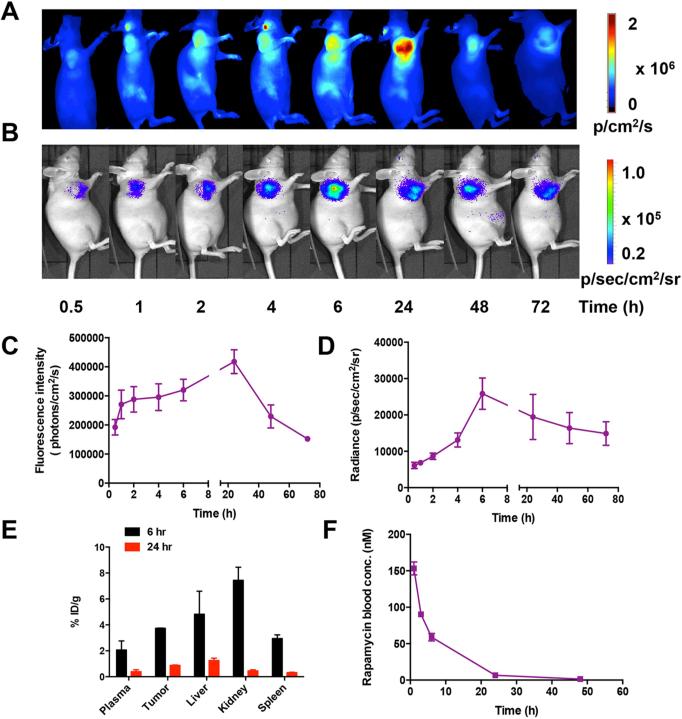
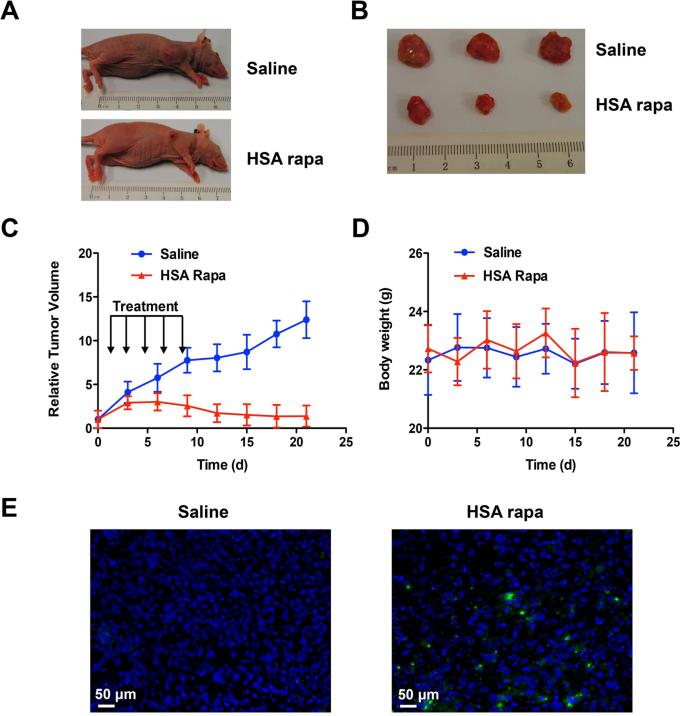
Imaging guided techniques have been increasingly employed to investigate the pharmacokinetics (PK) and biodistribution of nanoparticle based drug delivery systems. In most cases, however, the PK profiles of drugs could vary significantly from those of drug delivery carriers upon administration in the blood circulation, which complicates the interpretation of image findings. Herein we applied a genetically encoded luciferase reporter in conjunction with near infrared (NIR) fluorophores to investigate the respective PK profiles of a drug and its carrier in a biodegradable drug delivery system. In this system, a prototype hydrophobic agent, rapamycin (Rapa), was encapsulated into human serum albumin (HSA) to form HSA Rapa nanoparticles, which were then labeled with Cy5 fluorophore to facilitate the fluorescence imaging of HSA carrier. Meanwhile, we employed transgenetic HN12 cells that were modified with a split luciferase reporter, whose bioluminescence function is regulated by Rapa, to reflect the PK profile of the encapsulated agent. It was interesting to discover that there existed an obvious inconsistency of PK behaviors between HSA carrier and rapamycin in vitro and in vivo through near infrared fluorescence imaging (NIFRI) and bioluminescence imaging (BLI) after treatment with Cy5 labeled HSA Rapa. Nevertheless, HSA Rapa nanoparticles manifested favorable in vivo PK and tumor suppression efficacy in a follow-up therapeutic study. The developed strategy of combining a molecular reporter and a fluorophore in this study could be extended to other drug delivery systems to provide profound insights for non-invasive real-time evaluation of PK profiles of drug-loaded nanoparticles in pre-clinical studies.
Figures
Similar articles
-
Pharmacokinetics and biodistribution of human serum albumin-TIMP-2 fusion protein using near-infrared optical imaging.J Pharm Pharm Sci. 2011;14(3):368-77. doi: 10.18433/j3h88d. J Pharm Pharm Sci. 2011. PMID: 21962154
-
Rapamycin/DiR loaded lipid-polyaniline nanoparticles for dual-modal imaging guided enhanced photothermal and antiangiogenic combination therapy.J Control Release. 2016 Sep 10;237:23-34. doi: 10.1016/j.jconrel.2016.07.005. Epub 2016 Jul 5. J Control Release. 2016. PMID: 27388755
-
Tumor targeting efficiency of bare nanoparticles does not mean the efficacy of loaded anticancer drugs: importance of radionuclide imaging for optimization of highly selective tumor targeting polymeric nanoparticles with or without drug.J Control Release. 2010 Oct 15;147(2):253-60. doi: 10.1016/j.jconrel.2010.07.096. Epub 2010 Jul 16. J Control Release. 2010. PMID: 20624433
-
In vivo Near-infrared Fluorescence Tumor Imaging Using DiR-loaded Nanocarriers.Curr Drug Deliv. 2016;13(1):40-8. doi: 10.2174/1567201812666150703114908. Curr Drug Deliv. 2016. PMID: 26138681 Review.
-
Advances in chemically modified HSA as a multifunctional carrier for transforming cancer therapy regimens.Int J Biol Macromol. 2025 May;305(Pt 2):141373. doi: 10.1016/j.ijbiomac.2025.141373. Epub 2025 Feb 21. Int J Biol Macromol. 2025. PMID: 39988174 Review.
Cited by
-
Evaluation of pH-Sensitive Polymeric Micelles Using Citraconic Amide Bonds for the Co-Delivery of Paclitaxel, Etoposide, and Rapamycin.Pharmaceutics. 2023 Jan 1;15(1):154. doi: 10.3390/pharmaceutics15010154. Pharmaceutics. 2023. PMID: 36678783 Free PMC article.
-
Near-infrared and metal-free tetra(butylamino)phthalocyanine nanoparticles for dual modal cancer phototherapy.RSC Adv. 2020 Jul 9;10(43):25958-25965. doi: 10.1039/d0ra03898a. eCollection 2020 Jul 3. RSC Adv. 2020. PMID: 35518584 Free PMC article.
-
Smart Nanomaterials in Cancer Theranostics: Challenges and Opportunities.ACS Omega. 2023 Apr 10;8(16):14290-14320. doi: 10.1021/acsomega.2c07840. eCollection 2023 Apr 25. ACS Omega. 2023. PMID: 37125102 Free PMC article. Review.
-
Autophagy Modulators: Mechanistic Aspects and Drug Delivery Systems.Biomolecules. 2019 Sep 25;9(10):530. doi: 10.3390/biom9100530. Biomolecules. 2019. PMID: 31557936 Free PMC article. Review.
-
Guidelines for the role of autophagy in drug delivery vectors uptake pathways.Heliyon. 2024 Apr 24;10(9):e30238. doi: 10.1016/j.heliyon.2024.e30238. eCollection 2024 May 15. Heliyon. 2024. PMID: 38707383 Free PMC article. Review.
References
-
- Farrell D, Alper J, Ptak K, Panaro NJ, Grodzinski P, Barker AD. ACS Nano. 2010;4:589–594. - PubMed
-
- Schroeder A, Heller DA, Winslow MM, Dahlman JE, Pratt GW, Langer R, Jacks T, Anderson DG. Nat Rev Cancer. 2012;12:39–50. - PubMed
-
- Luo R, Venkatraman SS, Neu B. Biomacromolecules. 2013 DOI: 10.1021/bm4003915. - PubMed
-
- Namiki Y, Fuchigami T, Tada N, Kawamura R, Matsunuma S, Kitamoto Y, Nakagawa M. Acc Chem Res. 2011;44:1080–1093. - PubMed
Publication types
MeSH terms
Substances
Grants and funding
LinkOut - more resources
Full Text Sources
Other Literature Sources
Miscellaneous