. 2016 Jan 28:6:20070.
doi: 10.1038/srep20070.

CRISPR-Cas9 mediated efficient PD-1 disruption on human primary T cells from cancer patients

Affiliations

CRISPR-Cas9 mediated efficient PD-1 disruption on human primary T cells from cancer patients

Shu Su et al. Sci Rep. .

Erratum in

Abstract

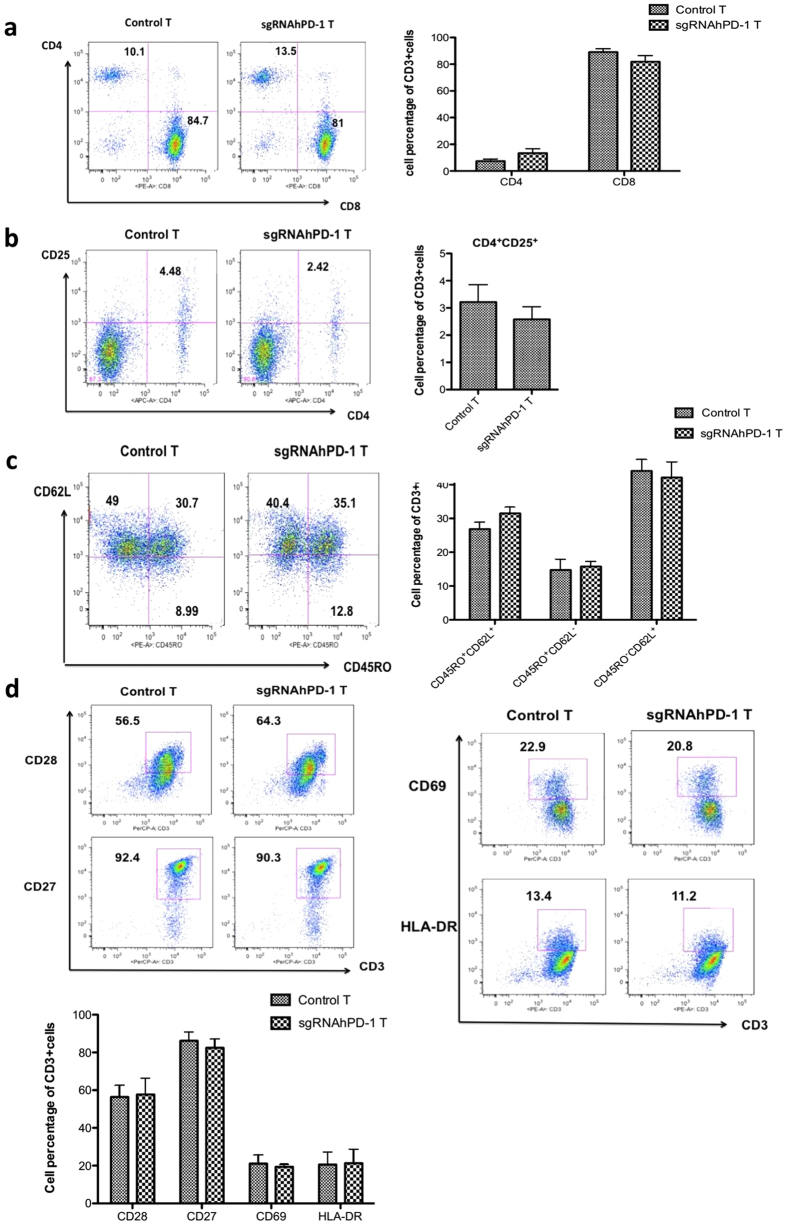
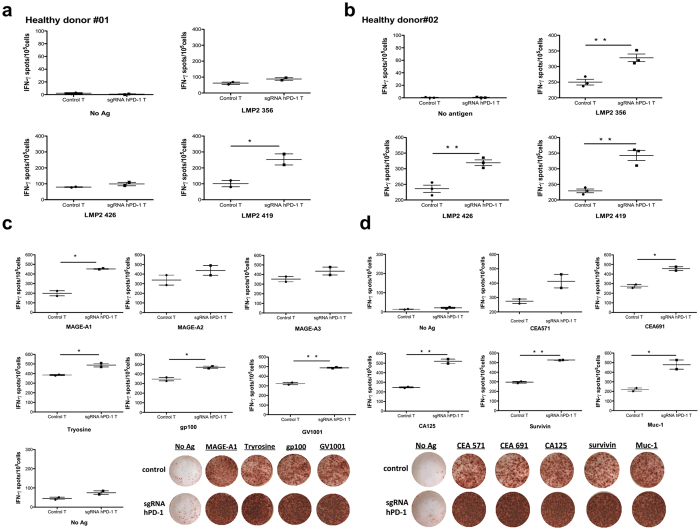
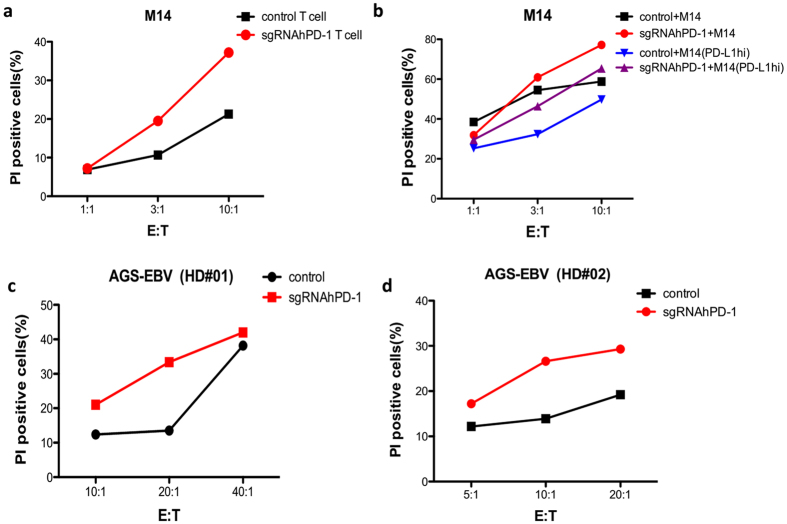
Strategies that enhance the function of T cells are critical for immunotherapy. One negative regulator of T-cell activity is ligand PD-L1, which is expressed on dentritic cells (DCs) or some tumor cells, and functions through binding of programmed death-1 (PD-1) receptor on activated T cells. Here we described for the first time a non-viral mediated approach to reprogram primary human T cells by disruption of PD-1. We showed that the gene knockout of PD-1 by electroporation of plasmids encoding sgRNA and Cas9 was technically feasible. The disruption of inhibitory checkpoint gene PD-1 resulted in significant reduction of PD-1 expression but didn't affect the viability of primary human T cells during the prolonged in vitro culture. Cellular immune response of the gene modified T cells was characterized by up-regulated IFN-γ production and enhanced cytotoxicity. These results suggest that we have demonstrated an approach for efficient checkpoint inhibitor disruption in T cells, providing a new strategy for targeting checkpoint inhibitors, which could potentialy be useful to improve the efficacy of T-cell based adoptive therapies.


Figures

Figure 1
Figure 1. Evaluation of hPD-1 sgRNA:Cas9-mediated modifications of human PD-1.
(a) Schematic diagram of sgRNAs targeting at hPD-1 Exon 2 locus. The sgRNAs targeting sites on the sense strand are colored with blue while those on the antisense are colored with red. PAM sequences are underlined. (b) Detection of sgRNA:Cas9-mediated cleavage of hPD-1 by PCR and T7EN1 cleavage assay. M, DNA marker. sg1, sgRNA 1; sg2, sgRNA 2; sg3, sgRNA 3; sg4, sgRNA 4; sg (1 + 2), sgRNA 1 combined with sgRNA 2; sg (3 + 4), sgRNA 3 combined with sgRNA 4. Con, negative control. The above experiments have been repeated 3 times with similar results.
Figure 2
Figure 2. Optimized conditions for Cas9 and sgRNA hPD-1 plasmids co-transfection of human primary T cells.
PBMC from healthy donors were co-transfected with pST1374-Cas9-GFP and pGL3-U6-hPD-1-sgRNA and the expression of GFP was observed 24 h after electroporation. (a) Different nucleofection programs and the percentage of GFP positive cells assessed by flow cytometry. (b) Representative images of the transfected cell by light microscope and fluorescence microscope. (c) Detection of sgRNA1:Cas9-mediated cleavage of hPD-1 by T7EN1 cleavage assay, #1: Y-001; #2: T-007; #3: T-023; #4: X-001; #5: U-014; #6: V-024. Samples with cleavage bands were marked with *. (d) Cell viability 24, 48 and 72 h after transfection by Trypan blue exclusion assay. (e) The transfection efficacy of different molar ratio of pST1374-Cas9-GFP and pGL3-U6-hPD-1-sgRNA evaluated by GFP expression. (f) Detection of sgRNA1:Cas9-mediated cleavage of hPD-1 by T7EN1 cleavage assay using program T-007 with a molar ratio of 1:4 (pST1374-Cas9-GFP:pGL3-U6-hPD-1-sgRNA). Data shown are mean ± SD of 3 independent experiments. p < 0.05.
Figure 3
Figure 3. Cas9 mediated efficient hPD-1 KO in primary human T cells of healthy donors and patients.
Freshly isolated PBMC were activated in vitro by IFN-γ for 3 d and IL-2 and aCD3 for 2 d and were transfected with pST1374-Cas9-GFP and pGL3-U6-hPD-1-sgRNA plasmids for each reaction. Sample G and Z stand for two individual patients and H stands for a healthy donor. (a) The GFP expression was evaluated by fluorescence microscope 24 h after electroporation (Donor 1 and Donor 2 are patients. Donor 3 is a representative of healthy donor). (b) PCR products were amplified and subjected to T7EN1 cleavage assay. Samples with cleavage bands were marked with an asterisk “*”. Sample G1/H1/Z1 represent control T cells and G2/H2/Z2 represent hPD-1 KO T cells. “+” represents for the positive control with the cleavage bands detected on HeLa cell line. NC, negative control. (c) DNA sequences of marked samples. TA clones from the PCR products were analyzed by DNA sequencing. The PAM sequences are underlined and highlighted in green; the targeting sequences in red; the mutations in blue, lower case; deletions (−), and insertions (+). The above experiments have been repeated 3 times with similar results.
Figure 4
Figure 4. The analysis of proliferation of gene modified primary T cells and the sustained knockout of hPD-1 during the prolonged culture conditions.
(a) PD-1 expression on CD3+ T cells was determined by flow cytometry 48 h post transfection. (b,c) Control T cells and sgRNA:Cas9-treated T cells were cultured in vitro upon stimulation with IL-2 for 21 d. The total cell numbers were counted every 7 d and the fold increase on day 7, day 14 and day 21 were evaluated. (d) T cell clones were observed around day 7, grew largely and increased during the following cultured days shown by light microscope. (e,f) The expression of hPD-1 on CD3+ T cells was determined by flow cytometry 7 and 21 d post transfection stimulated by peptide-pulsed autologous DCs and irradiated tumor cells, respectively. We depicted a representative out of three experiments yielding similar results. Data shown are mean ± SD of 3 independent experiments and we depicted a representative out of three experiments yielding similar results.
Figure 5
Figure 5. The phenotype of the in vitro cultured T cell by sgRNA:Cas9 mediated knock out of PD-1.
T cells after electroporation on day 21 were harvested to evaluate the phenotype change of cultured T cells after gene editing from patients and healthy donors. (a) CD4+ and CD8+ cells were analyzed by gating on CD3+ cells (b) CD4+CD25+ cells were analyzed by gating on CD3+ cells. (c) CD45RO+CD62L+, CD45RO+CD62L and CD45ROCD62L+ cells were analyzed by gating on CD3+ cells. (d) Cell surface expression of the activation marker CD28, CD27, CD69 and HLA-DR were measured on CD3+ cells. Graphs show quantification of FACs data. Data shown are mean ± SD of 3 independent experiments.
Figure 6
Figure 6. The enhanced cytokine production by the Cas9-mediated hPD-1 KO in primary T cells.
sgRNA hPD-1:Cas9 modified primary T cells and control T cells from healthy donors or patients were cultured in IL-2 after electroporation for 7 d and stimulated by peptides pulsed autologous DCs for 20 h. The IFN- γ secreting cells was evaluated by Elispot. (a,b) T cells from two EBV serum positive healthy donors were stimulated by LMP2a peptides pulsed autologous DCs. (c) T cells from a melanoma patient was stimulated by melanoma associated peptides pulsed autologous DCs. (d) T cells from a gastric cancer patients were stimulated by gastric cancer associated peptides pulsed autologous DCs. All values shown are mean ± SD of triplicate or duplicate measurements and have been repeated 3 times with similar results. *p < 0.05; **p < 0.005.
Figure 7
Figure 7. Enhanced cytotoxicity of the hPD-1 KO primary T cells.
Patient or healthy donor derived T cells reprogrammed by sgRNA:Cas9 or control were cultured in vitro with IL-2 for 7 ~ 10 d and co-cultured with PD-L1 expressing tumor cells in different effector to target cell ratio. The cytotoxic reactivity of the effector T cells was measured using CFSE/PI cytotoxicity assay. The relative percentage of double-positive cells out of the CFSE-labeled population (tumor cells) is shown. (a) The hPD-1 KO T cells or control T cells from a melanoma patient were co-cultured with CFSE labeled M14 cells at ratio (E:T) of 1:1, 3:1, 10:1, respectively. After 6 h, PI was added and the cells were analyzed by flow cytometry. (b) The hPD-1 KO T cell or control T cells from a melanoma patient were co-cultured with CFSE labeled PD-L1-lo-M14 or PD-L1-hi-M14 cells at ratio (E:T) of 1:1, 3:1, 10:1, respectively. After 6 h, PI was added and the cells were analyzed by flow cytometry. (c,d) The hPD-1 KO T cells or control T cells from healthy donor #01 and healthy donor #02 were co-cultured with CFSE labeled AGS-EBV cells at ratio (E:T) of 5:1, 10:1, 20:1, or 10:1, 20:1, 40:1, respectively. After 16 h, PI was added and the cells were analyzed by flow cytometry. The above experiments have been repeated 3 times with similar results.

Similar articles

Cited by

References

    1. Jason J. L. & Patrick A. O. PD-1 pathway inhibitors: The next generation of immunotherapy for advanced melanoma. Oncotarget. 6, 3479–3492(2015). - PMC - PubMed
    1. Hailemichael Y. et al.. Persistent antigen at vaccination sites induces tumor-specific CD8+ T cell sequestration, dysfunction and deletion. Nat Med. 19, 465–472 (2013). - PMC - PubMed
    1. Rosenberg S. A., Yang J. C. & Restifo N. P. Cancer immunotherapy: moving beyond current vaccines. Nat. Med. 10, 909 (2004). - PMC - PubMed
    1. Morse M. A., Chui S., Hobeika A., Lyerly H. K. & Clay T. Recent developments in therapeutic cancer vaccines. Nat. Clin. Pract. Oncol. 2, 108–13 (2005). - PubMed
    1. Rubio V. et al.. Ex vivo identification, isolation and analysis of tumor-cytolytic T cells. Nat. Med. 9, 1377–82 (2003). - PubMed

Publication types

MeSH terms

Substances