

Morbidly Obese Patients Exhibit Increased CYP2E1-Mediated Oxidation of Acetaminophen
- PMID: 26818482
- PMCID: PMC4916199
- DOI: 10.1007/s40262-015-0357-0
Morbidly Obese Patients Exhibit Increased CYP2E1-Mediated Oxidation of Acetaminophen
Abstract
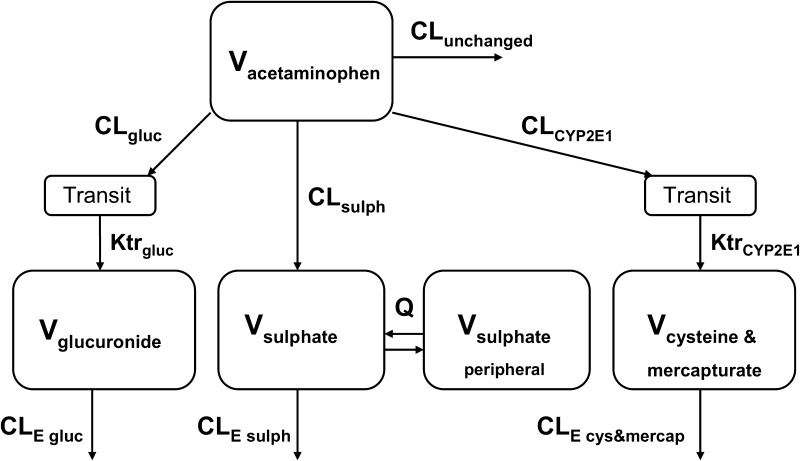
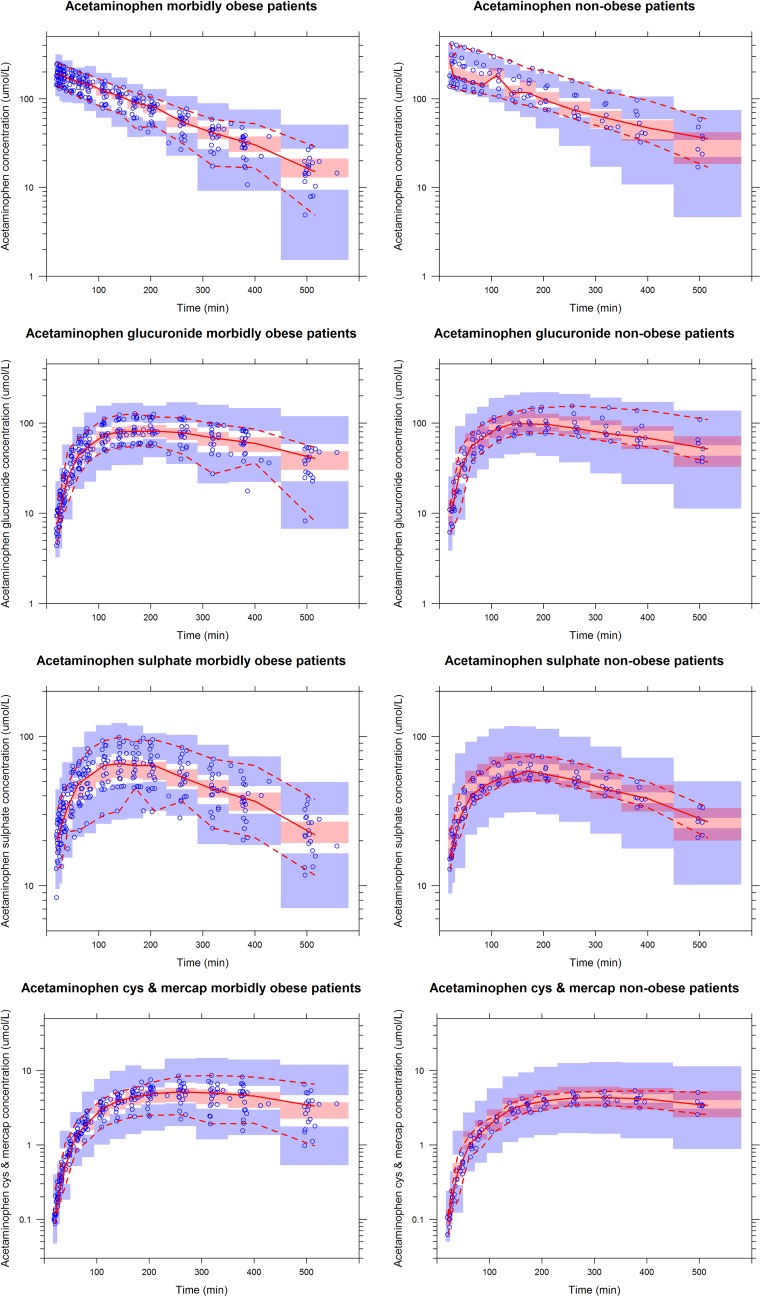
Introduction: Acetaminophen (paracetamol) is mainly metabolized via glucuronidation and sulphation, while the minor pathway through cytochrome P450 (CYP) 2E1 is held responsible for hepatotoxicity. In obese patients, CYP2E1 activity is reported to be induced, thereby potentially worsening the safety profile of acetaminophen. The aim of this study was to determine the pharmacokinetics of acetaminophen and its metabolites (glucuronide, sulphate, cysteine and mercapturate) in morbidly obese and non-obese patients.
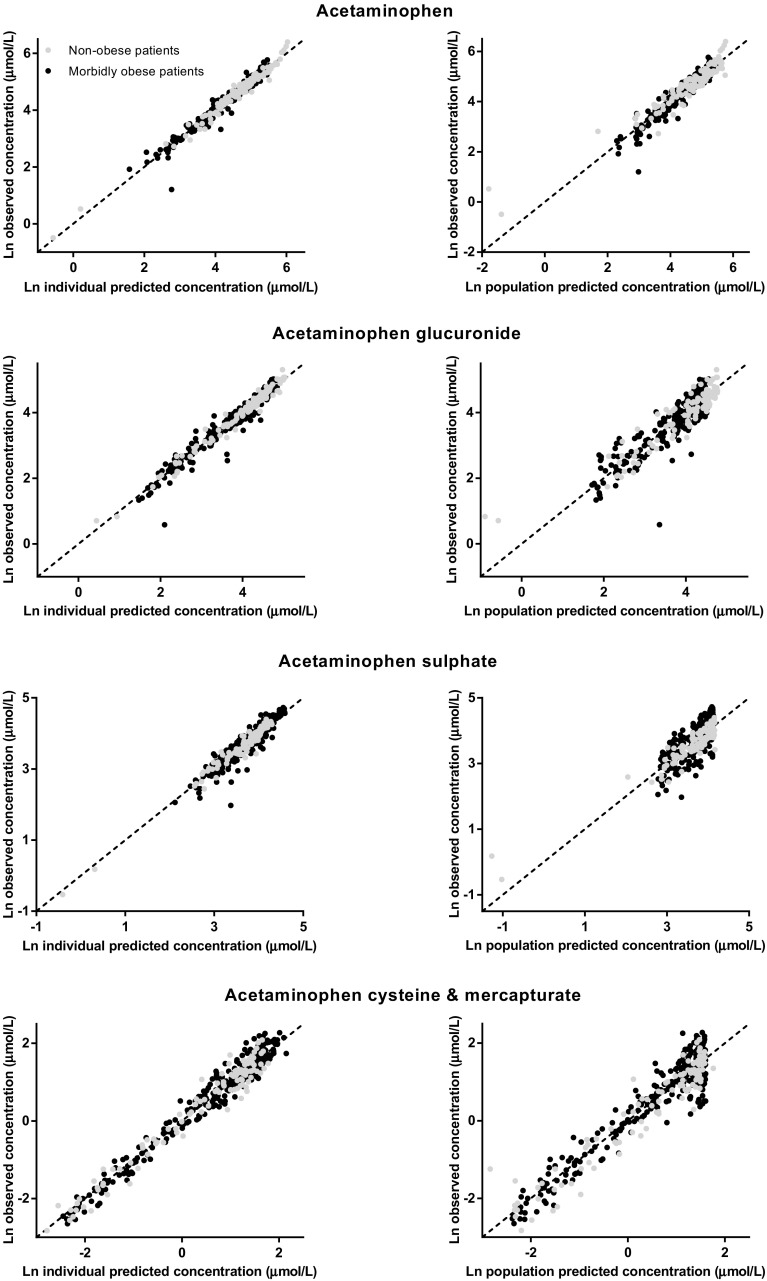
Methods: Twenty morbidly obese patients (with a median total body weight [TBW] of 140.1 kg [range 106-193.1 kg] and body mass index [BMI] of 45.1 kg/m(2) [40-55.2 kg/m(2)]) and eight non-obese patients (with a TBW of 69.4 kg [53.4-91.7] and BMI of 21.8 kg/m(2) [19.4-27.4]) received 2 g of intravenous acetaminophen. Fifteen blood samples were collected per patient. Population pharmacokinetic modelling was performed using NONMEM.
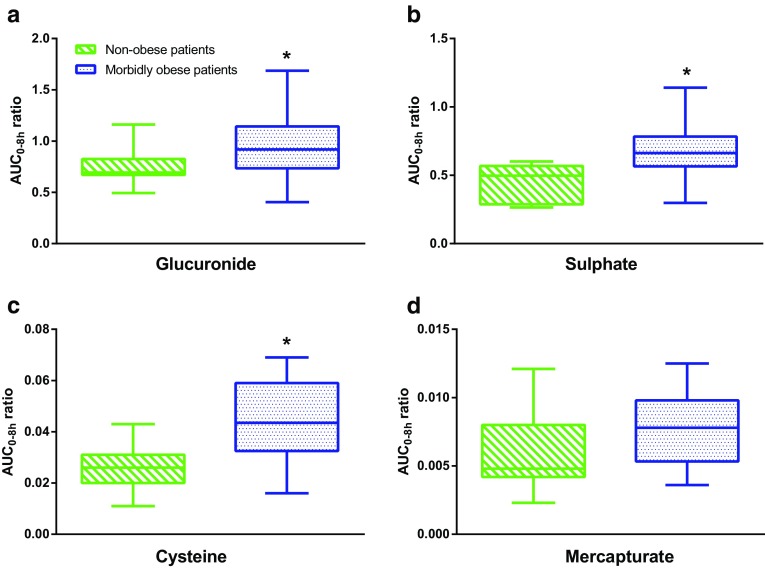
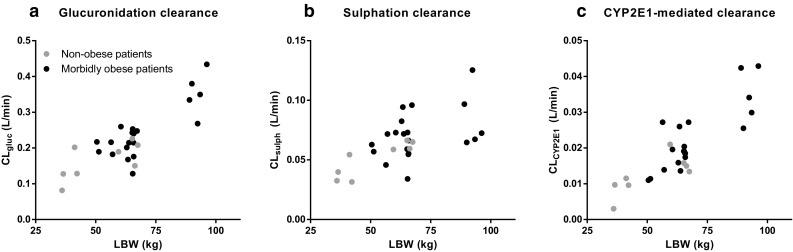
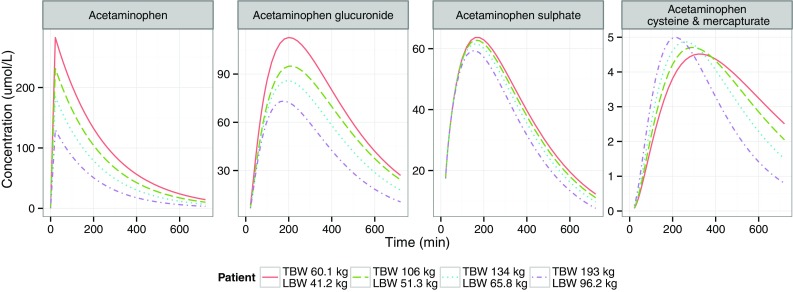
Results: In morbidly obese patients, the median area under the plasma concentration-time curve from 0 to 8 h (AUC0-8h) of acetaminophen was significantly smaller (P = 0.009), while the AUC0-8h ratios of the glucuronide, sulphate and cysteine metabolites to acetaminophen were significantly higher (P = 0.043, 0.004 and 0.010, respectively). In the model, acetaminophen CYP2E1-mediated clearance (cysteine and mercapturate) increased with lean body weight [LBW] (population mean [relative standard error] 0.0185 L/min [15 %], P < 0.01). Moreover, accelerated formation of the cysteine and mercapturate metabolites was found with increasing LBW (P < 0.001). Glucuronidation clearance (0.219 L/min [5 %]) and sulphation clearance (0.0646 L/min [6 %]) also increased with LBW (P < 0.001).
Conclusion: Obesity leads to lower acetaminophen concentrations and earlier and higher peak concentrations of acetaminophen cysteine and mercapturate. While a higher dose may be anticipated to achieve adequate acetaminophen concentrations, the increased CYP2E1-mediated pathway may preclude this dose adjustment.
Conflict of interest statement
All procedures performed in studies involving human participants were in accordance with the ethical standards of the institutional and/or national research committee and with the 1964 Helsinki Declaration and its later amendments or comparable ethical standards. Informed consent was obtained from all individual participants included in the study. Anne van Rongen, Pyry A. J. Välitalo, Mariska Y. M. Peeters, Djamila Boerma, Fokko W. Huisman, Bert van Ramshorst, Eric P. A. van Dongen, Johannes N. van den Anker and Catherijne A. J. Knibbe declare that they have no potential conflicts of interests. No sources of funding were used in the preparation of this manuscript.
Figures
Comment in
-
Comment on: "Morbidly Obese Patients Exhibit Increased CYP2E1-Mediated Oxidation of Acetaminophen".Clin Pharmacokinet. 2018 Jul;57(7):895-896. doi: 10.1007/s40262-018-0666-1. Clin Pharmacokinet. 2018. PMID: 29725998 No abstract available.
-
Author's Reply to Reith: "Morbidly Obese Patients Exhibit Increased CYP2E1-Mediated Oxidation of Acetaminophen".Clin Pharmacokinet. 2018 Jul;57(7):897-899. doi: 10.1007/s40262-018-0665-2. Clin Pharmacokinet. 2018. PMID: 29736840 No abstract available.
References
-
- Ng M, Fleming T, Robinson M, Thomson B, Graetz N, Margono C, et al. Global, regional, and national prevalence of overweight and obesity in children and adults during 1980–2013: a systematic analysis for the Global Burden of Disease Study 2013. Lancet. 2014;384(9945):766–781. doi: 10.1016/S0140-6736(14)60460-8. - DOI - PMC - PubMed
Publication types
MeSH terms
Substances
LinkOut - more resources
Full Text Sources
Other Literature Sources
Medical
