. 2016 Jan 27;36(4):1071-85.
doi: 10.1523/JNEUROSCI.2430-15.2016.

Dendrites In Vitro and In Vivo Contain Microtubules of Opposite Polarity and Axon Formation Correlates with Uniform Plus-End-Out Microtubule Orientation

Affiliations

Dendrites In Vitro and In Vivo Contain Microtubules of Opposite Polarity and Axon Formation Correlates with Uniform Plus-End-Out Microtubule Orientation

Kah Wai Yau et al. J Neurosci. .

Abstract

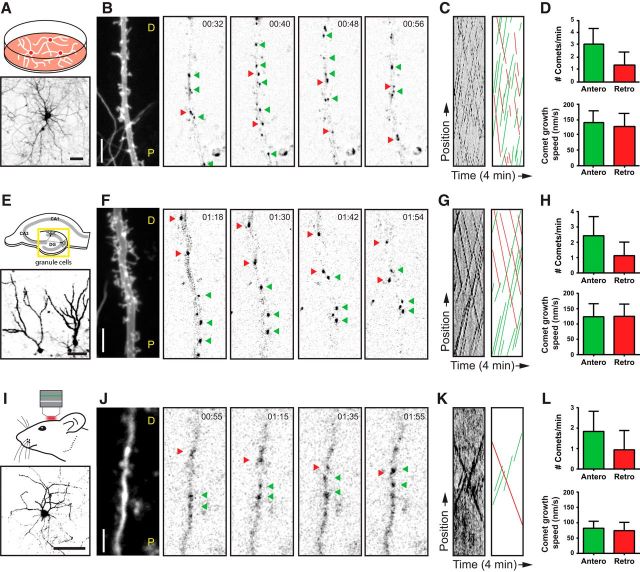
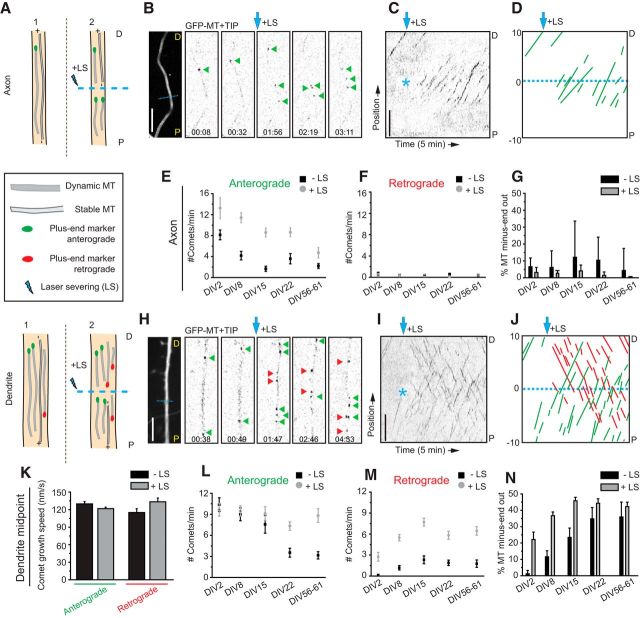
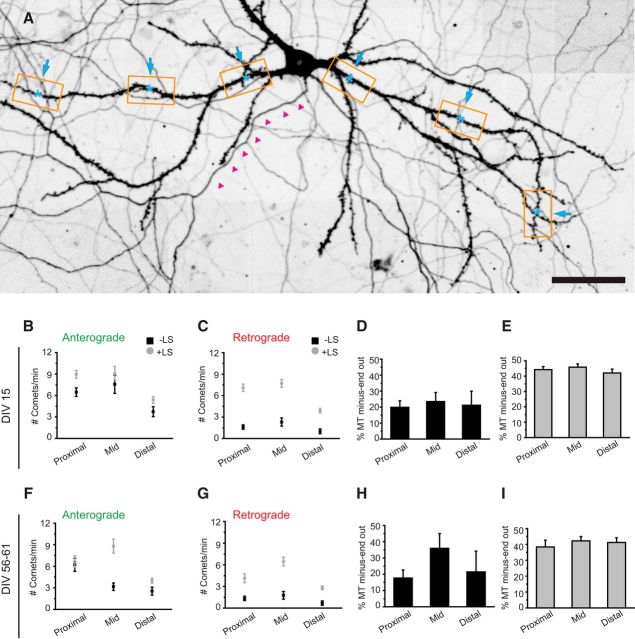
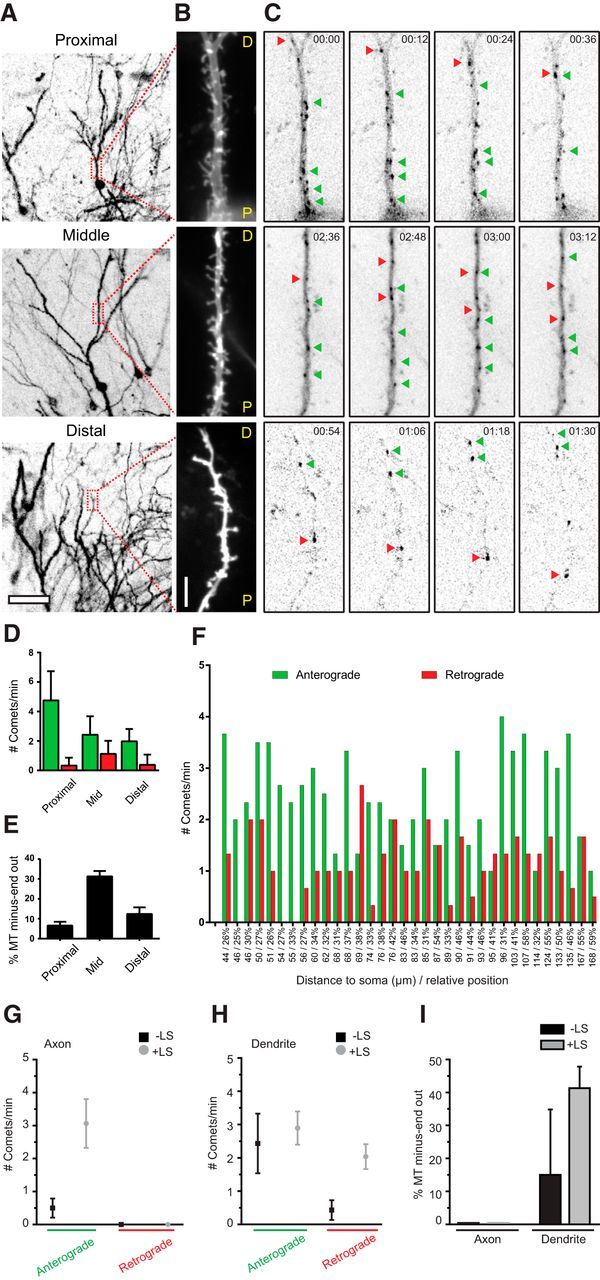
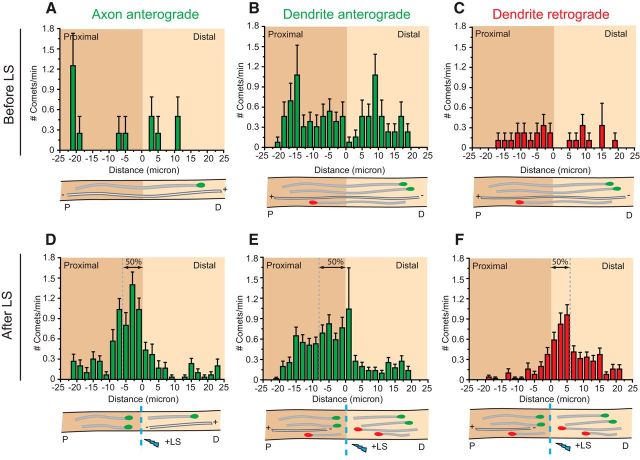
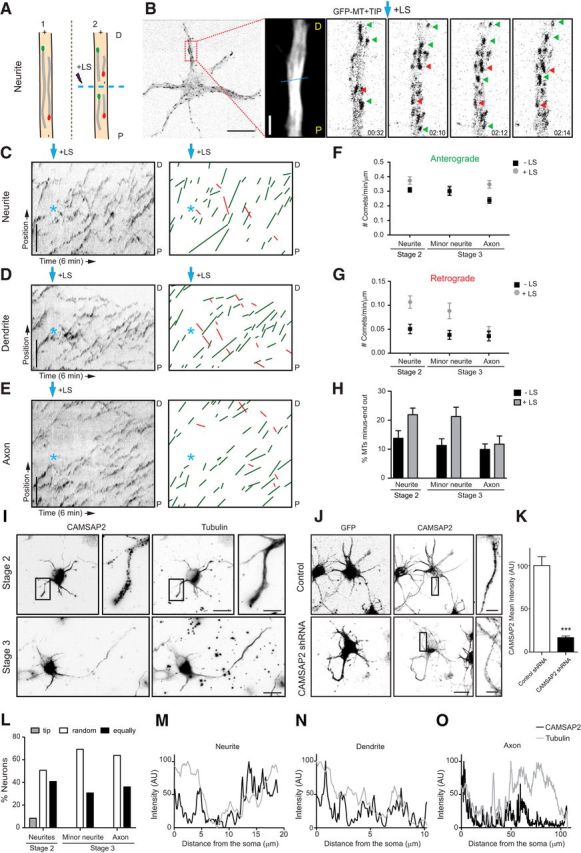
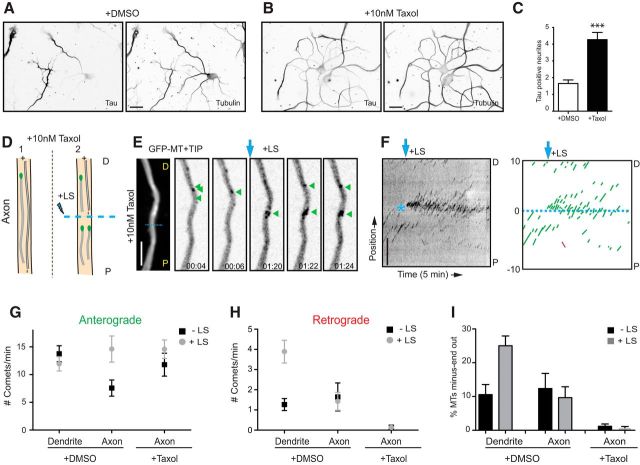
In cultured vertebrate neurons, axons have a uniform arrangement of microtubules with plus-ends distal to the cell body (plus-end-out), whereas dendrites contain mixed polarity orientations with both plus-end-out and minus-end-out oriented microtubules. Rather than non-uniform microtubules, uniparallel minus-end-out microtubules are the signature of dendrites in Drosophila and Caenorhabditis elegans neurons. To determine whether mixed microtubule organization is a conserved feature of vertebrate dendrites, we used live-cell imaging to systematically analyze microtubule plus-end orientations in primary cultures of rat hippocampal and cortical neurons, dentate granule cells in mouse organotypic slices, and layer 2/3 pyramidal neurons in the somatosensory cortex of living mice. In vitro and in vivo, all microtubules had a plus-end-out orientation in axons, whereas microtubules in dendrites had mixed orientations. When dendritic microtubules were severed by laser-based microsurgery, we detected equal numbers of plus- and minus-end-out microtubule orientations throughout the dendritic processes. In dendrites, the minus-end-out microtubules were generally more stable and comparable with plus-end-out microtubules in axons. Interestingly, at early stages of neuronal development in nonpolarized cells, newly formed neurites already contained microtubules of opposite polarity, suggesting that the establishment of uniform plus-end-out microtubules occurs during axon formation. We propose a model in which the selective formation of uniform plus-end-out microtubules in the axon is a critical process underlying neuronal polarization.

Significance statement: Live-cell imaging was used to systematically analyze microtubule organization in primary cultures of rat hippocampal neurons, dentate granule cells in mouse organotypic slices, and layer 2/3 pyramidal neuron in somatosensory cortex of living mice. In vitro and in vivo, all microtubules have a plus-end-out orientation in axons, whereas microtubules in dendrites have mixed orientations. Interestingly, newly formed neurites of nonpolarized neurons already contain mixed microtubules, and the specific organization of uniform plus-end-out microtubules only occurs during axon formation. Based on these findings, the authors propose a model in which the selective formation of uniform plus-end-out microtubules in the axon is a critical process underlying neuronal polarization.

Keywords: cytoskeleton; dendrites; development; microtubule dynamics; neuron; polarity.


Figures

Figure 1.
Figure 1.
Mixed dendritic microtubule organization in vitro, ex vivo, and in vivo. A, Schematic drawing of dissociated neuron cultures (top) and a representative example expressing a volume marker (bottom). Neurons have been transduced with lentivirus expressing a bicistronic cassette of GFP–MT+TIP and the volume marker MARCKS–TagRFP. B, Time-lapse acquisitions from a DIV18 neuron. The first frame shows an average projection of the volume marker. Dendrite orientation is indicated by P (proximal) and D (distal). All the following represent selected frames from the GFP–MT+TIP time-lapse. Green arrowheads point to individual anterograde moving GFP–MT+TIP comets, and red arrowheads point to retrograde moving comets. C, Kymographs made from the complete time-lapse recording shown in B. The left shows the original kymograph, and the right shows an illustration of the manually traced comets displacements for better visualization. D, Quantification of microtubule properties in dissociated cultures. The top diagram shows the number of GFP–MT+TIP comets within a defined observation window of 1 min and 20 μm (n = 32 dendrites). The bottom diagram displays the average speeds of anterograde and retrograde moving comets (n > 500 comets). E, Schematic drawing of a hippocampal slice (top) and two representative granule cells (bottom) imaged in organotypic slice cultures. The yellow box indicates the dentate gyrus region that has been analyzed exclusively in this study. Slices have been transduced with the same lentivirus used for dissociated neurons. F, Recordings from a granule cell dendrite at 18 d in culture. The first frame displays the dendritic profile labeled by the volume marker. Subsequent frames show the GFP–MT+TIP channel acquired from the same dendrite. G, Original and illustrated kymographs of the time-lapse recording shown in F. H, Quantification of the average comet number (top diagram; n = 38 dendrites) and growth speed (bottom diagram; n > 300 comets) in organotypic slice cultures. The method of quantification was identical to the data on dissociated cultures. I, Schematic illustration of the in vivo imaging through a cranial window (top) and a representative example of a neuron at low magnification expressing the volume marker (bottom). Neurons were transfected by single-cell electroporation using the same bicistronic expression construct on which the lentivirus was based on. J, In vivo two-photon time-lapse imaging of an L2/3 pyramidal neuron. The dendritic dimensions were visualized by an average projection of the GFP–MT+TIP channel (first frame), and the following frames represent selected time points of the same channel. Bidirectional microtubule displacements are indicated by colored arrowheads. K, Original and illustrated kymographs of the time-lapse recording shown in J. L, Quantification of the average comet number (top diagram; n = 12 dendrites) and growth speed (bottom diagram; n > 100 comets) of the observed in vivo microtubule dynamics. Scale bars: A, E, I, 50 μm; B, F, J, 5 μm. Error bars indicate SD. See also Movie 1.
Figure 2.
Figure 2.
Differential microtubule organization during neuronal development. A, Schematic representation of microtubule LS in axon (top) and dendrite (bottom). P indicates the proximal region and D the distal region. B, Stills from a spinning-disk time-lapse recording of an axon (DIV15) transfected with mRFP and GFP–MT+TIP at DIV13. The first still on the left is an average projection of the axon in which the dashed cyan line is the region of LS. Green arrowheads indicate GFP–MT+TIP comets pointing in an anterograde direction during the time-lapse recording. Cyan arrow indicates when LS is performed. The time-lapse recording is low-pass filtered and background subtracted. C, Kymograph of the time-lapse recording shown in B. Asterisk indicates time and location of LS. D, Schematic representation of the kymograph shown in C. Dashed cyan line separates the regions 10 μm before and 10 μm after LS. Green lines represent comets pointing in the anterograde direction. E, F, Quantification of the number of comets per minute pointing in the anterograde (E) or retrograde (F) direction, 10 μm before and after the position of LS. Black square data points are before LS, and the gray circles are after LS; n = 13 axons. G, Percentage of microtubules with their minus ends pointed out in axons before (black columns) and after (gray columns) LS. H, Stills from a spinning-disk time-lapse recording of a dendrite middle region (DIV15) transfected with mRFP and GFP–MT+TIP at DIV13. The first still on the left is an average projection of the axon in which the dashed cyan line is the region of LS. Green and red arrowheads indicate comets moving in anterograde or retrograde direction. The cyan arrow indicates when LS is performed. The time-lapse recording is low-pass filtered and background subtracted. I, Kymograph of the time-lapse recording shown in H. Asterisk indicates time and location of LS. J, Schematic representation of the kymograph shown in I. Dashed cyan line separates the regions 10 μm before and 10 μm after LS. Green and red lines represent comets pointing in the anterograde or retrograde direction, respectively. K, Growth speed of comets extending in anterograde or retrograde direction along the dendrite. Black bars are before LS and gray bars are after; n = 163, n = 475, n = 41, n = 335 number of comets. L, M, Quantification of the number of comets per minute pointing in the anterograde (L) or retrograde (M) direction, 10 μm before and after the position of LS. Black square data points are before LS, and the gray circles are after LS. N, Percentage of microtubules with their minus ends pointed out in dendrites before (black columns) and after (gray columns) LS; DIV2, n = 7 axons and 8 dendrites; DIV8, n = 11 axons and 17 dendrites; DIV15, n = 13 axons and 16 dendrites; DIV22, n = 12 axons and 17 dendrites; DIV56–DIV61, n = 10 axons and 13 dendrites. Scale bars, 5 μm. Error bars indicate SEM.
Figure 3.
Figure 3.
Microtubule organization is maintained throughout dendritic regions. A, Hippocampal neuron at DIV18 (stitched image of 20× recordings). The axon is highlighted by magenta arrowheads. Orange boxes show examples of proximal, middle, and distal regions along the dendrites. Laser-induced severing of microtubules was performed in proximal regions with a distance of 20 μm to the soma and in distal regions with 20 μm to the end of the dendrite (cyan asterisk). B, C, DIV15 quantification of the number of comets per minute pointing in the anterograde (B) and retrograde (C) direction, 10 μm before and after the position of LS. Black square data points are before LS, and the gray circles are after LS. D, E, Percentage of microtubules with their minus ends pointed out in dendrites before (black columns; D) and after (gray columns; E) LS; DIV15, proximal dendrite n = 30, middle dendrite n = 16, distal dendrite n = 19. F, G, DIV56–DIV61 quantification of the number of comets per minute pointing in the anterograde (F) and retrograde (G) direction, 10 μm before and after the position of LS. Black square data points are before LS, and the gray circles are after LS. H, I, Percentage of microtubules with their minus ends pointed out in dendrites before (black columns; H) and after (gray columns; I) LS; DIV56–DIV61, proximal dendrite n = 15, middle dendrite n = 13, distal dendrite n = 13, n = 10 axons. Scale bar, 50 μm. Error bars indicate SEM.
Figure 4.
Figure 4.
Hippocampal slice cultures exhibit similar microtubule organization as mature dissociated cultures. A, Lentivirus transduced hippocampal slice cultures expressing GFP–MT+TIP and a volume marker. Low-magnification overview images show dendritic tree recorded with the volume marker. Boxes label regions that were used for high-resolution imaging and localize at proximal, medial, or distal regions as indicated. B, Average projection of volume channels recorded sequentially to GFP–MT+TIP time-lapse imaging. C, Single still frames of a GFP–MT+TIP time-lapse recording acquired from the adjacent dendrite shown in B. Arrowheads point on individual comets moving in anterograde (green) or retrograde (red) direction. Recordings were performed at 6 s intervals. See also Movie 2. D, Quantification of microtubule plus tips moving in anterograde or retrograde direction analyzed for indicated dendritic regions (counted within a time window of 1 min and 20 μm dendrite length); proximal dendrite n = 14, middle dendrite n = 34, distal dendrite n = 21. E, Percentage of microtubules with minus-end-out orientation in proximal, middle, and distal dendrites. F, Quantification of comets direction in middle regions of individual dendrites (n = 34). Numbers on the x-axis show the distance of the imaging position center to the soma and the relative distance compared with the total dendritic length in percentage. The average number of comets/min/20 μm moving anterograde (green) and retrograde (red) are presented for each dendrite. G, H, Quantification of GFP–MT+TIP moving anterograde or retrograde in axons and dendrites of hippocampal slice cultures. Black square data points are before LS, and gray circle data points are after LS; axon, n = 7; dendrite, n = 8. I, Percentage of microtubules with their minus ends pointed outward in axons and dendrites before (black columns) and after (gray columns) LS. Scale bars: A, 50 μm; B, 5 μm. Error bars indicate SD (D) and SEM (E, G, H, I).
Figure 5.
Figure 5.
Dendrites contain stable minus-end-out microtubules. A–C, Histograms of anterograde comet starting positions in axons (A) and dendritic middle region (B) before LS in green and retrograde comet starting positions in red (C). D–F, Histograms of anterograde comet starting positions in axons (D) and dendritic middle region (E) after LS in green and retrograde comet starting positions in red (F). Below the histograms are schematic representations of comets going anterograde (green) and retrograde (red). Error bars indicate SEM.
Figure 6.
Figure 6.
Microtubule orientation in neurons before and after polarization. A, Schematic representation of the microtubule LS procedure in a neurite. P indicates the proximal region and D the distal region. B, A representative DIV1 cortical neuron expressing GFP–MT+TIP, followed by the maximum projection and stills from a time-lapse recording of the indicated neurite. The dashed cyan line represents the region of LS, and the cyan arrow indicates the moment of laser severing. Green and red arrows mark selected plus- and minus-end-out microtubules, respectively. C–E, Kymographs and illustration of microtubule tracings from representative time-lapse recordings of a neurite (C) from a nonpolarized neuron, dendrite (D), and axon (E) of a polarized neuron. Green lines represent plus-end-out microtubules and red lines minus-end-out microtubules. Cyan asterisk and arrow indicate time and location of LS. F, G, Quantification of anterograde (F) and retrograde (G) growing GFP–MT+TIP comets, with and without LS (n = 10–18 neurons) in DIV1 cortical neurons. H, Percentage of microtubules with their minus ends out in unpolarized and polarized DIV1 neurons, before (black columns) and after (gray columns) LS; n = 10–18 neurons. I, Representative images of nonpolarized (top) and polarized (bottom) DIV1 hippocampal neurons stained for both CAMSAP2 (left; I, L) and α-tubulin (right). J, Representative images of stage 2 neurons transfected with GFP and control pSuper (top) or CAMSAP2 shRNA (bottom) and stained for both GFP (left) and CAMSAP2 (right). K, Quantification of CAMSAP2 intensity in neurites in control and CAMSAP2 shRNA transfected neurons (n = 19 neurites). ***p < 0.001 using t test. L, Quantification of CAMSAP2 localization in hippocampal neurons before and after polarization (n > 100 neurites). CAMSAP2 distribution within the neurites is classified in indicated categories. M–O, Representative examples of endogenous CAMSAP2 intensity profiles in neurites (M), before polarization, dendrites (N), and axons (O) from DIV1 hippocampal neurons. Scale bars: B, 2 and 10 μm; C–E, I, J, 5 μm; I, J, 20 μm. Error bars indicate SEM.
Figure 7.
Figure 7.
Microtubule orientation changes in neurons after taxol treatment. A, B, Representative examples of DIV4 neurons treated for 72 h with DMSO (A) or 10 nm taxol (B) and stained for both Tau (left) and βΙΙΙ-tubulin (right). C, Quantification of Tau-positive neurites in control and taxol-treated neurons. Neurons treated with taxol showed a significant increase in the number of Tau-positive neurites (***p < 0.001 using t test). D, Schematic representation of the microtubule LS procedure in an axon, after taxol treatment. P indicates the proximal region and D the distal region. E, Maximum projection and stills from a representative time-lapse recording of a hippocampal neuron expressing GFP–MT+TIP and treated with taxol for 72 h. F, Kymographs and schematic tracings from a representative time-lapse recording of an axon after taxol treatment. Green lines represent plus-end-out microtubules and red lines minus-end-out microtubules. Cyan asterisk and arrow indicate time and location of LS. G, H, Quantification of GFP–MT+TIP moving anterograde (G) and retrograde (H), with (black squares) and without (gray circles) LS in DIV4 hippocampal neurons treated with DMSO or 10 nm taxol for 72 h. I, Percentage of minus-ends-out microtubules in control and taxol-treated neurons, before (black columns) and after (gray columns) LS. n = 14 axons and 31 dendrites in control neurons, and n = 27 axons after taxol treatment (>3 axons analyzed per neuron). Scale bars: A, B, 50 μm; E, F, 5 μm. Error bars indicate SEM.

Similar articles

Cited by

References

    1. Akhmanova A, Hoogenraad CC. Microtubule minus-end-targeting proteins. Curr Biol. 2015;25:R162–R171. doi: 10.1016/j.cub.2014.12.027. - DOI - PubMed
    1. Akhmanova A, Steinmetz MO. Tracking the ends: a dynamic protein network controls the fate of microtubule tips. Nat Rev Mol Cell Biol. 2008;9:309–322. doi: 10.1038/nrm2369. - DOI - PubMed
    1. Baas PW, Lin S. Hooks and comets: the story of microtubule polarity orientation in the neuron. Dev Neurobiol. 2011;71:403–418. doi: 10.1002/dneu.20818. - DOI - PMC - PubMed
    1. Baas PW, White LA, Heidemann SR. Microtubule polarity reversal accompanies regrowth of amputated neurites. Proc Natl Acad Sci U S A. 1987;84:5272–5276. doi: 10.1073/pnas.84.15.5272. - DOI - PMC - PubMed
    1. Baas PW, Deitch JS, Black MM, Banker GA. Polarity orientation of microtubules in hippocampal neurons: uniformity in the axon and nonuniformity in the dendrite. Proc Natl Acad Sci U S A. 1988;85:8335–8339. doi: 10.1073/pnas.85.21.8335. - DOI - PMC - PubMed

Publication types

MeSH terms

LinkOut - more resources