. 2016 Jan 27;36(4):1113-27.
doi: 10.1523/JNEUROSCI.1742-15.2016.

Investigating the Stability of Fine-Grain Digit Somatotopy in Individual Human Participants

Affiliations

Investigating the Stability of Fine-Grain Digit Somatotopy in Individual Human Participants

James Kolasinski et al. J Neurosci. .

Abstract

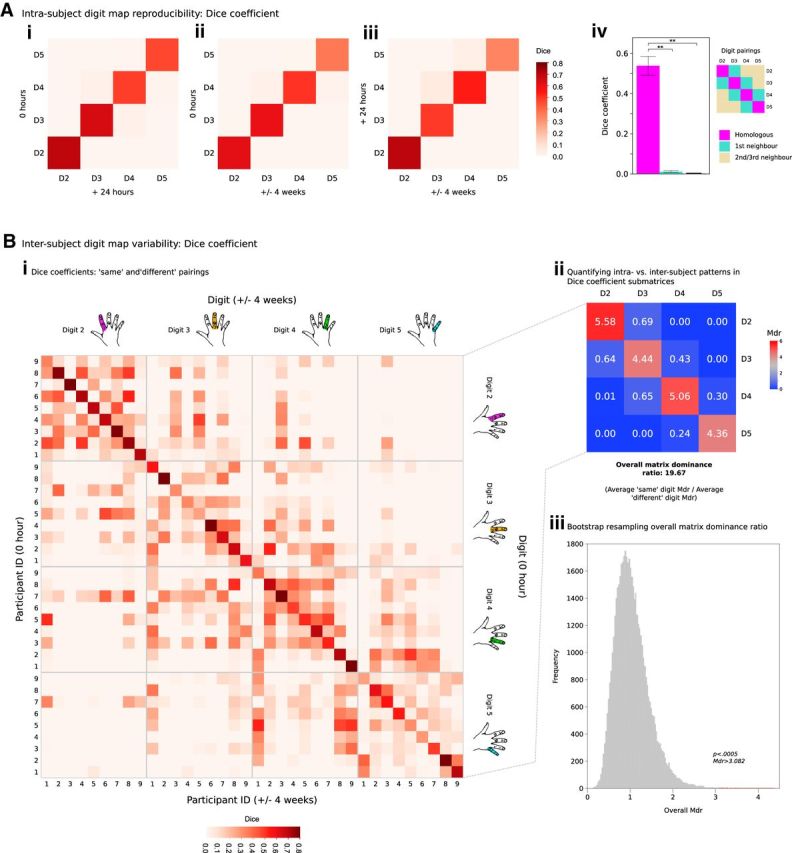
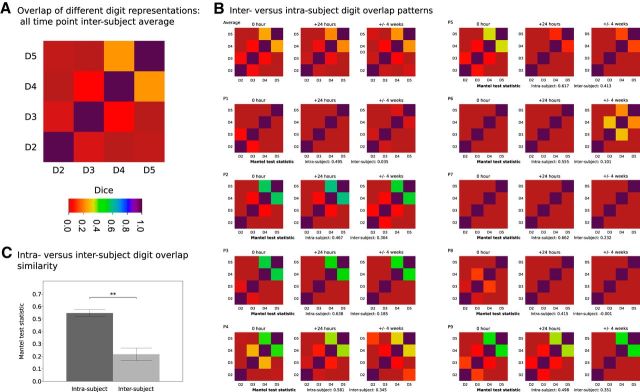
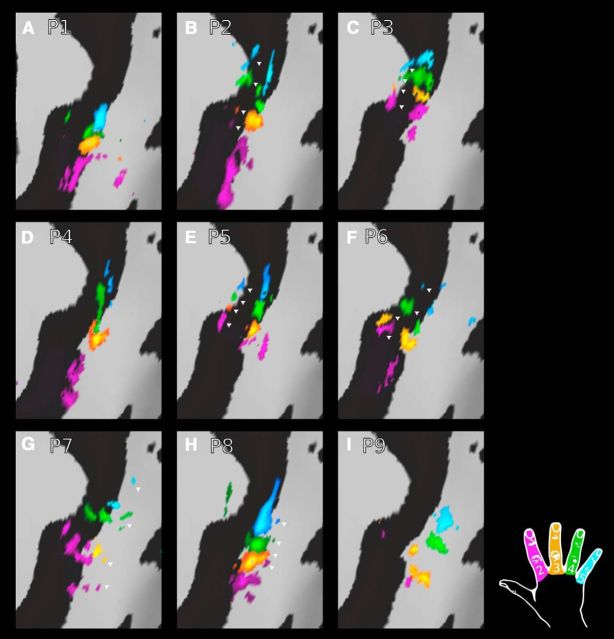
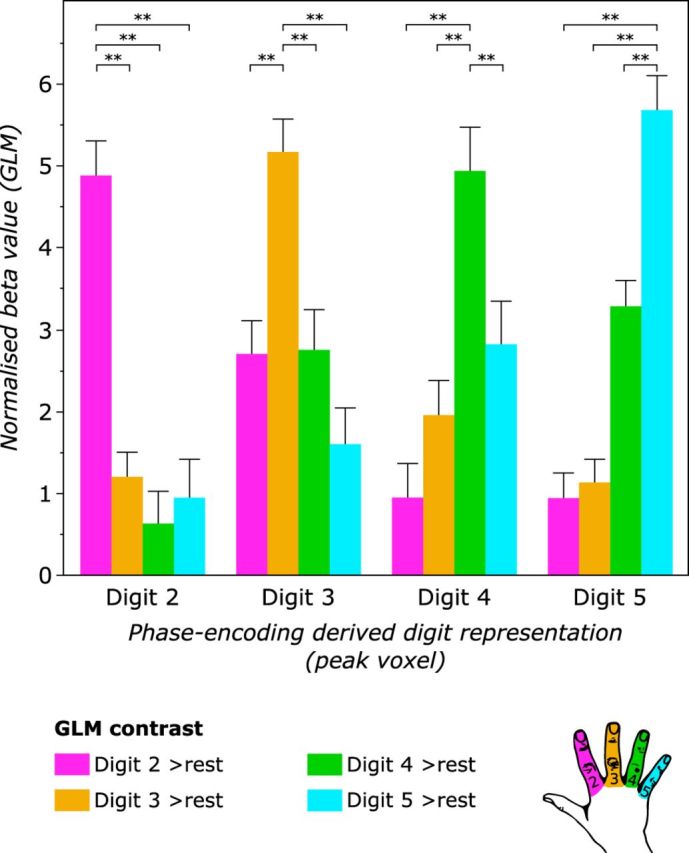
Studies of human primary somatosensory cortex (S1) have placed a strong emphasis on the cortical representation of the hand and the propensity for plasticity therein. Despite many reports of group differences and experience-dependent changes in cortical digit somatotopy, relatively little work has considered the variability of these maps across individuals and to what extent this detailed functional architecture is dynamic over time. With the advent of 7 T fMRI, it is increasingly feasible to map such detailed organization noninvasively in individual human participants. Here, we extend the ability of ultra-high-field imaging beyond a technological proof of principle to investigate the intersubject variability of digit somatotopy across participants and the stability of this organization across a range of intervals. Using a well validated phase-encoding paradigm and an active task, we demonstrate the presence of highly reproducible maps of individual digits in S1, sharply contrasted by a striking degree of intersubject variability in the shape, extent, and relative position of individual digit representations. Our results demonstrate the presence of very stable fine-grain somatotopy of the digits in human S1 and raise the issue of population variability in such detailed functional architecture of the human brain. These findings have implications for the study of detailed sensorimotor plasticity in the context of both learning and pathological dysfunction. The simple task and 10 min scan required to derive these maps also raises the potential for this paradigm as a tool in the clinical setting.

Significance statement: We applied ultra-high-resolution fMRI at 7 T to map sensory digit representations in the human primary somatosensory cortex (S1) at the level of individual participants across multiple time points. The resulting fine-grain maps of individual digits in S1 reveal the stability in this fine-grain functional organization over time, contrasted with the variability in these maps across individuals.

Keywords: 7 T; digit; mapping; reproducibility; somatotopy.


Figures

Figure 1.
Figure 1.
Overview of phase-encoding digit mapping task and analysis. A, Phase-encoding paradigm: 8 × 32 s cycles of continuous button presses at 1 Hz. Each 32 s cycle consists of 4 8 s blocks, with each block cycling through either D2–D5 (forward) or D5–D2 (backward). B, BOLD time courses from individual voxels (1 time course shown) cross-correlated against reference models (8 s “on,” 24 s “off”) shifted iteratively by a number of lags to capture activation throughout the movement cycles. C, Plotting cross-correlation of each voxel's time course as a function of lag reveals peak cross-correlation at a given lag. Four different voxels are shown, each with a cross-correlation peaking in lags corresponding to different digits. D, r-values for each voxel averaged across lags assigned to specific digits. Resulting digit r-value maps for forward and backwards cycled are also averaged to yield voxelwise r-value maps for each digit for one subject/time point (thresholded maps displayed).
Figure 2.
Figure 2.
Phase-encoding digit maps from a single participant and time point. A, Digit maps in BOLD EPI volumetric space across five adjacent transverse slices (z: 11–15); FDR threshold (α = 0.001). Pink, D2; orange, D3; green, D4; blue, D5. R, Right; L, lateral; M, medial. B, Post hoc analysis of BOLD signal from individual digit representations in this participant. C, D, Surface projection of digit maps shown on the inflated pial surface (black: sulcal pattern). Red highlighted region (C, inset) indicates coverage of BOLD EPI task fMRI data partial field of view. No masking has been applied within the acquisition field of view.
Figure 3.
Figure 3.
Temporal reproducibility of phase-encoding digit maps within participants. Shown is a comparison of phase-encoding digit representations at three scan time points for three participants. Although there is a high degree of between-subject variability (as shown by the large differences between rows), there is very little within-subject variability over time (demonstrated by the small differences across each row). Cortical are maps shown on the inflated pial surface with the sulcal pattern in black (positive curvature). Magnification panels are centered on the hand knob of the central sulcus. All digit maps are subject to FDR thresholding (α = 0.001); full details of thresholds and maxima for each time point provided in Table 2; color bars represent a range from zero to maximum.
Figure 4.
Figure 4.
Temporal reproducibility of phase-encoding digit maps within participants (continued). Shown is a comparison of phase-encoding digit representations at three scan time points continued from Figure 3 for the remaining participants. All digit maps are subject to FDR thresholding (α = 0.001); full details of thresholds and maxima for each time point provided in Table 2.
Figure 5.
Figure 5.
Quantifying intrasubject reproducibility and intersubject variability in phase-encoding digit maps. AiAiii, Dice coefficients demonstrate a clear pattern of reproducibility for maps of homologous digits across the three time points under study compared with first-order and second-/third-order neighbors. Aiv, Dice coefficients for homologous digits were greater than the equivalent value between nonhomologous digit pairings: one-way repeated-measures ANOVA: significant main effect of digit pairing category (homologous, first-order neighbor, second-/third-order neighbor). **Post hoc analysis (Bonferroni adjusted): p < 0.0005. Bi, Dice coefficients comparing all combinations of individual digit representations across different participants (after accounting for differences in digit map size) across 0 h and ± 4 week time points. Bii, Patterns in each digit pair submatrix were summarized by the Mdr (Eq. 2). Mdr >1 suggests greater intrasubject overlap in digit representations; Mdr <1 implies greater intersubject overlap in digit representations. For “same” pairings (e.g., D2–D2), a pattern of high overlap was seen intrasubject (Bi; submatrix diagonals), contrasted with lower overlap values for comparisons intersubject (Bi; submatrix off-diagonals). For “different” pairings (e.g., D2–D4), no such pattern was observed, suggesting that intrasubject consistency is driven by reproducibility of the spatial patterns for the same digits over time. Biii, Calculation of the overall Mdr (from Bii) was subjected to bootstrap resampling (50,000 iterations) to account for the likelihood of observing these dominance ratios by chance. Bootstrapping returned p < 0.0005 for the observed value of overall Mdr, consistent with the notion of intersubject variability in fine-grain digit representations.
Figure 6.
Figure 6.
Patterns of overlap between different digit representations. Soft-edged phase-encoding digit maps provide information regarding shared cortical territory of different digit representations. A, Average measures of cortical overlap between different digit representations across all subjects and time points reveal pattern of greater shared territory across functionally coupled digits: the relative independence of D2, with increasing levels of cortical overlap between more synergistic D3/D4 and D4/D5. B, Cortical overlap matrices for individual participants and time points; ranked Mantel test statistics were used to compare matrices. Intrasubject comparisons: average Mantel test statistic for intrasubject comparisons across the three time points. Intersubject comparisons: average of the Mantel test statistic calculated between each participant at a given time point and all other participants at that time point calculated for each time point and averaged. C, Comparison of the intrasubject versus intersubject Mantel test statistics revealed greater similarity of values within a given subject compared with across different subjects (paired-sample t test, **p < 0.0005).
Figure 7.
Figure 7.
Resolving additional digit maps within S1. An all-session average phase-encoding map was produced for each participant and resampled into a common space (FDR thresholding, α = 0.01). Additional maps were seen in a subset of participants. A more anterior map was observed (arrowheads: B, C, E, F) in some individuals and a more posterior map (arrowheads: G, H) in others, both within S1. In the remaining participants (A, D, I), no clear evidence for additional maps was found.
Figure 8.
Figure 8.
Validation of phase-encoding digit maps using block design data. Beta values from the block design task fMRI data were extracted for each GLM contrast (digit > rest) at the peak voxels of the phase-encoding digit representations (D2–D5). This process was repeated for each of the three scans to derive average values for each participant. For each phase-encoding digit representation, the β value of the homologous GLM contrast (e.g., D2 phase-encoding vs D2 > rest GLM contrast) was significantly greater than for nonhomologous GLM contrasts (e.g., D2 phase-encoding vs D4 > rest GLM contrast). RM-ANOVA: significant interaction between phase-encoding digit representation and the digit contrast of the block design GLM on the normalized β value. **Post hoc t test, p < 0.0005 (uncorrected).

References

    1. Allard T, Clark SA, Jenkins WM, Merzenich MM. Reorganization of somatosensory area 3b representations in adult owl monkeys after digital syndactyly. J Neurophysiol. 1991;66:1048–1058. - PubMed
    1. Bara-Jimenez W, Catalan MJ, Hallett M, Gerloff C. Abnormal somatosensory homunculus in dystonia of the hand. Ann Neurol. 1998;44:828–831. doi: 10.1002/ana.410440520. - DOI - PubMed
    1. Baumgartner C, Doppelbauer A, Deecke L, Barth DS, Zeitlhofer J, Lindinger G, Sutherling WW. Neuromagnetic investigation of somatotopy of human hand somatosensory cortex. Exp Brain Res. 1991;87:641–648. - PubMed
    1. Besle J, Sánchez-Panchuelo R-M, Bowtell R, Francis S, Schluppeck D. Single-subject fMRI mapping at 7 T of the representation of fingertips in S1: a comparison of event-related and phase-encoding designs. J Neurophysiol. 2013a;109:2293–2305. doi: 10.1152/jn.00499.2012. - DOI - PMC - PubMed
    1. Besle J, Sánchez-Panchuelo R-M, Bowtell R, Francis S, Schluppeck D. Event-related fMRI at 7 T reveals overlapping cortical representations for adjacent fingertips in S1 of individual subjects. Hum Brain Mapp. 2013b;35:2027–2043. - PMC - PubMed

Publication types

LinkOut - more resources