. 2016 Jul;51(7):421-9.
doi: 10.1097/RLI.0000000000000251.

Human Imaging With Photon Counting-Based Computed Tomography at Clinical Dose Levels: Contrast-to-Noise Ratio and Cadaver Studies

Affiliations

Human Imaging With Photon Counting-Based Computed Tomography at Clinical Dose Levels: Contrast-to-Noise Ratio and Cadaver Studies

Ralf Gutjahr et al. Invest Radiol. 2016 Jul.

Abstract

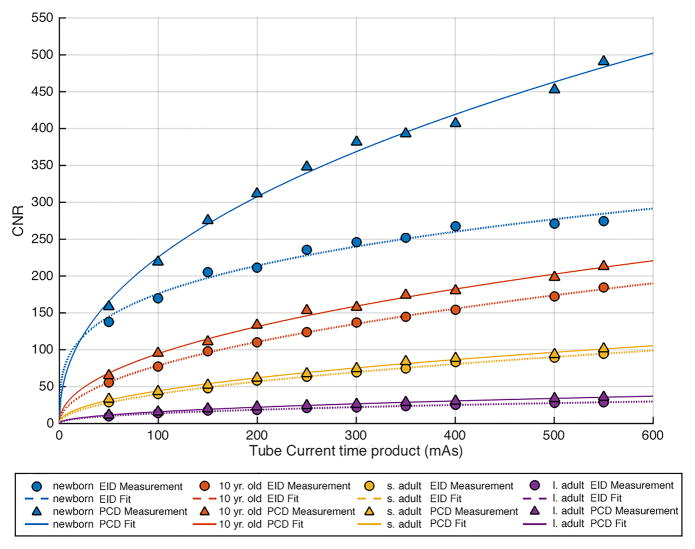
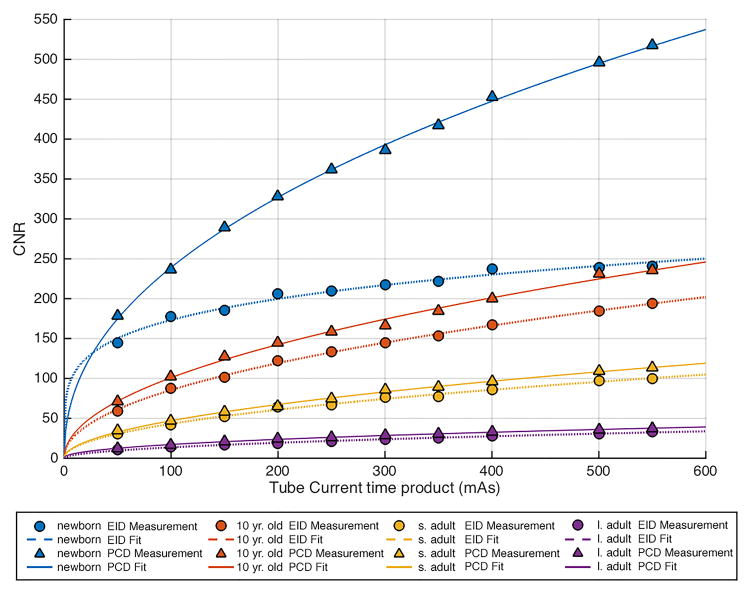
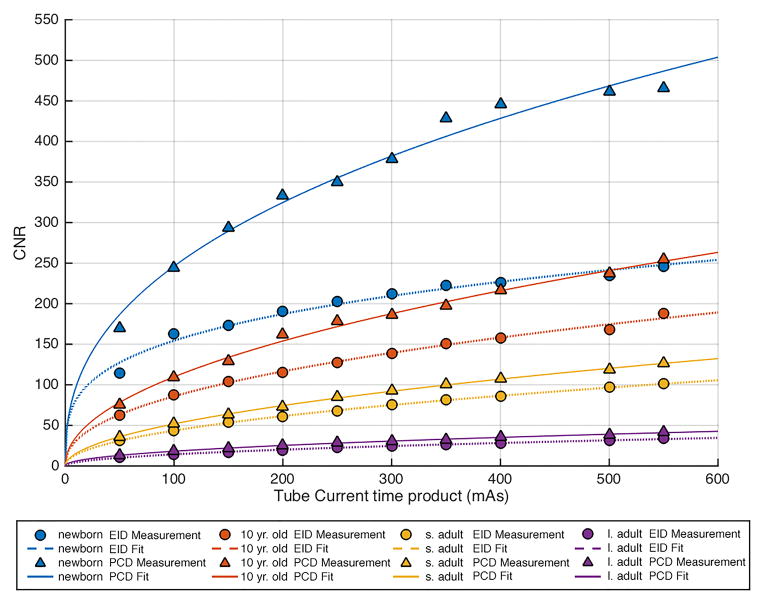
Objectives: The purpose of this work was to measure and compare the iodine contrast-to-noise ratio (CNR) between a commercial energy-integrating detector (EID) computed tomography (CT) system and a photon-counting detector (PCD) CT scanner capable of human imaging at clinical dose rates, as well as to determine clinical feasibility using human cadavers.

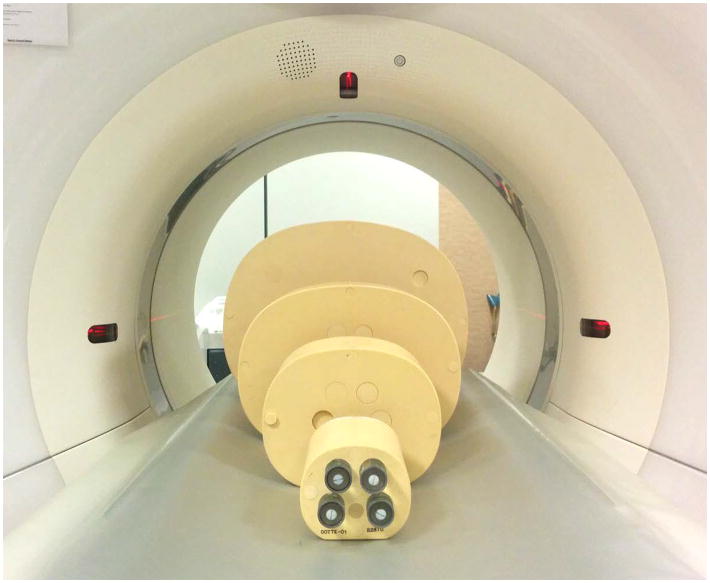
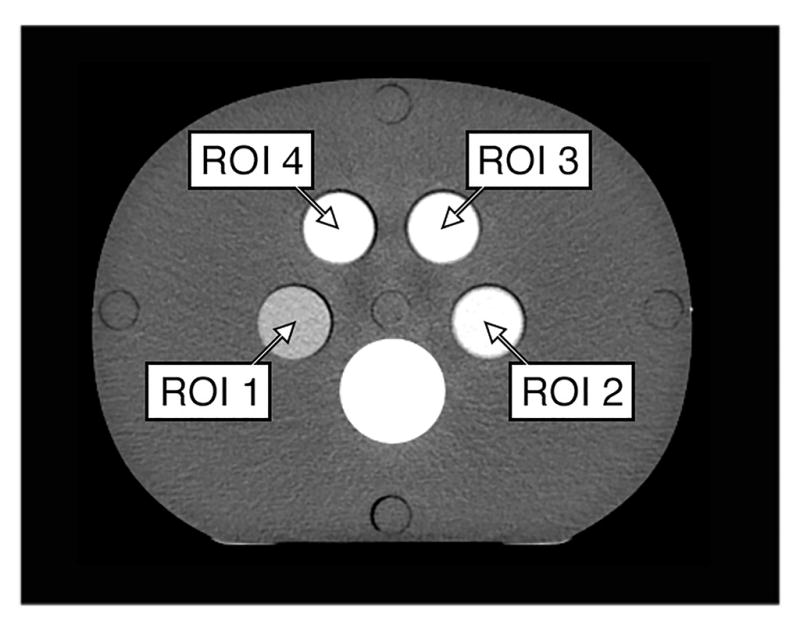
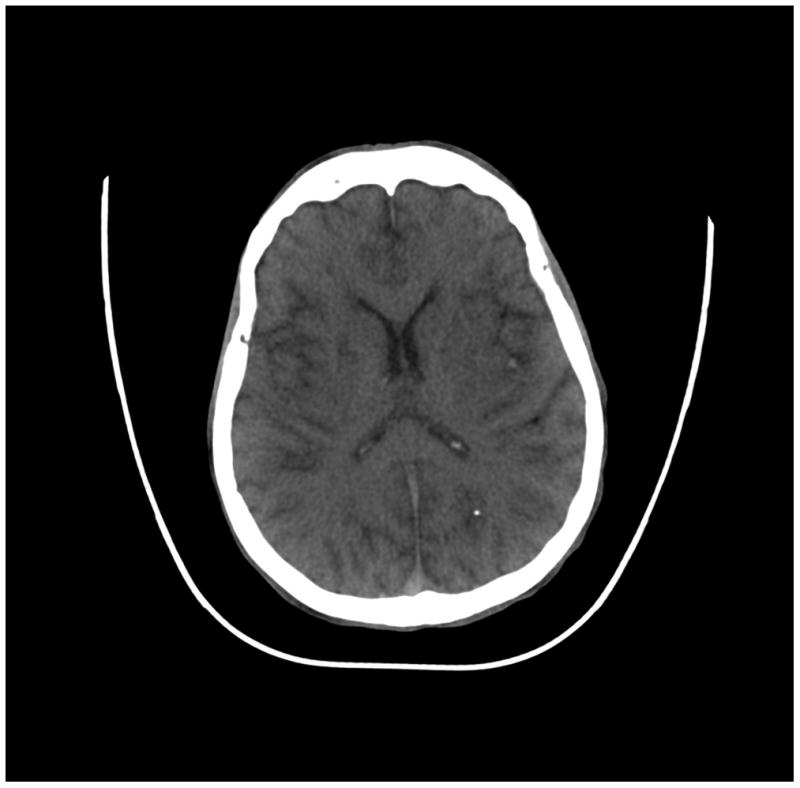
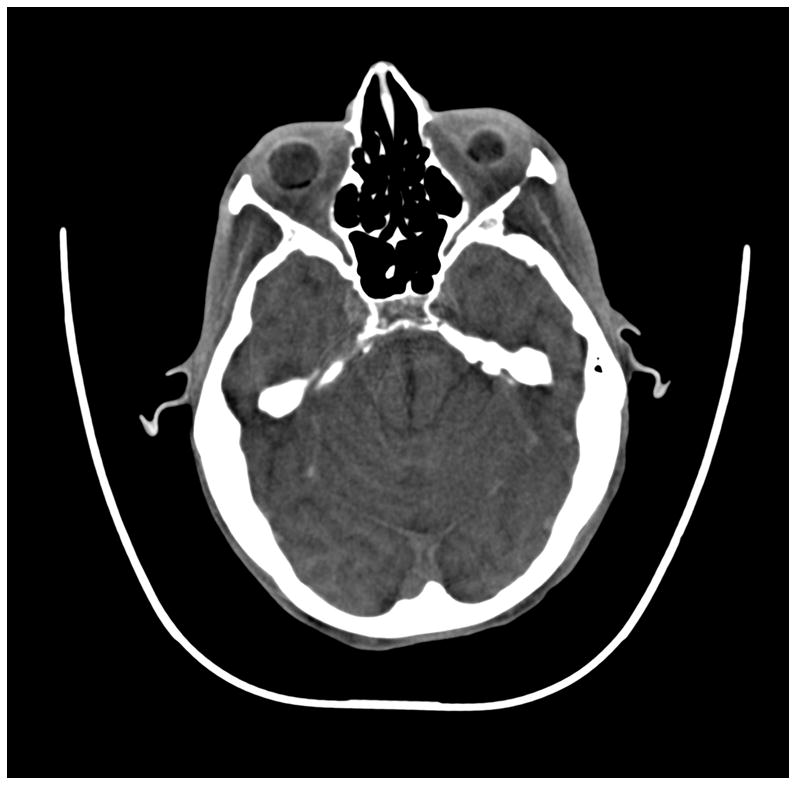
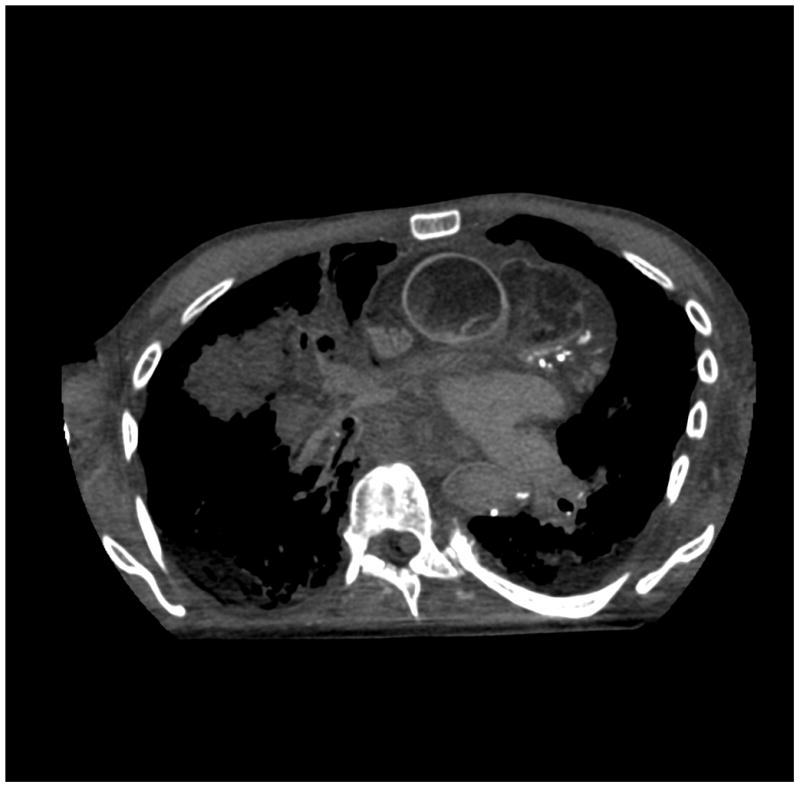
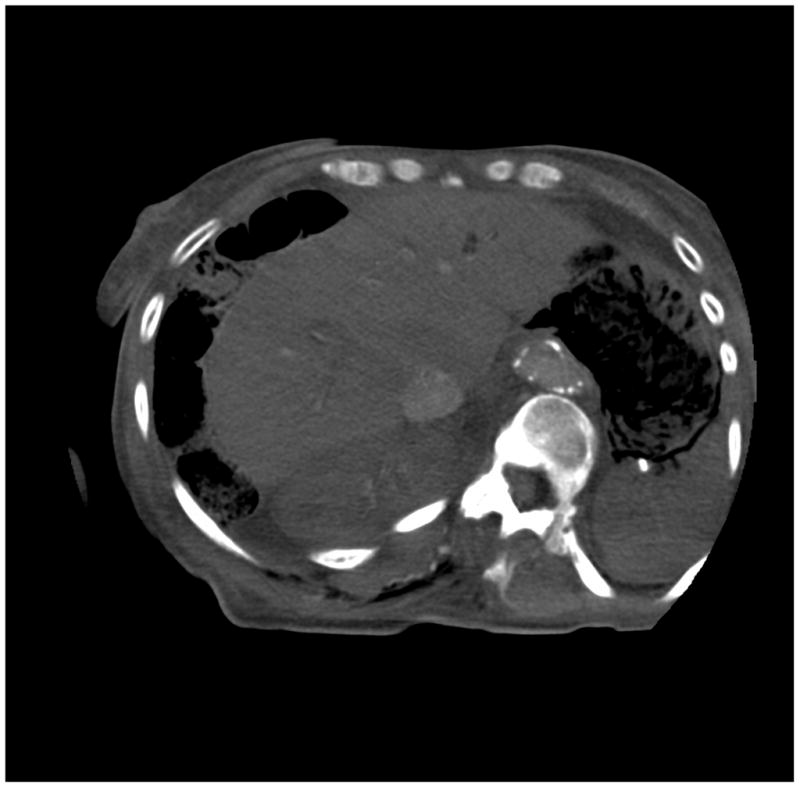
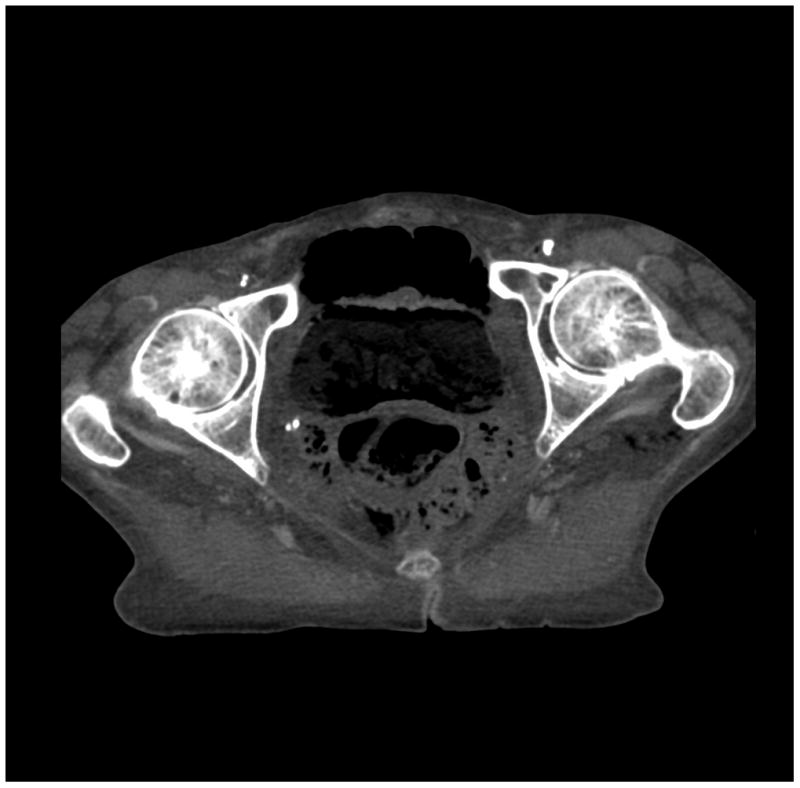
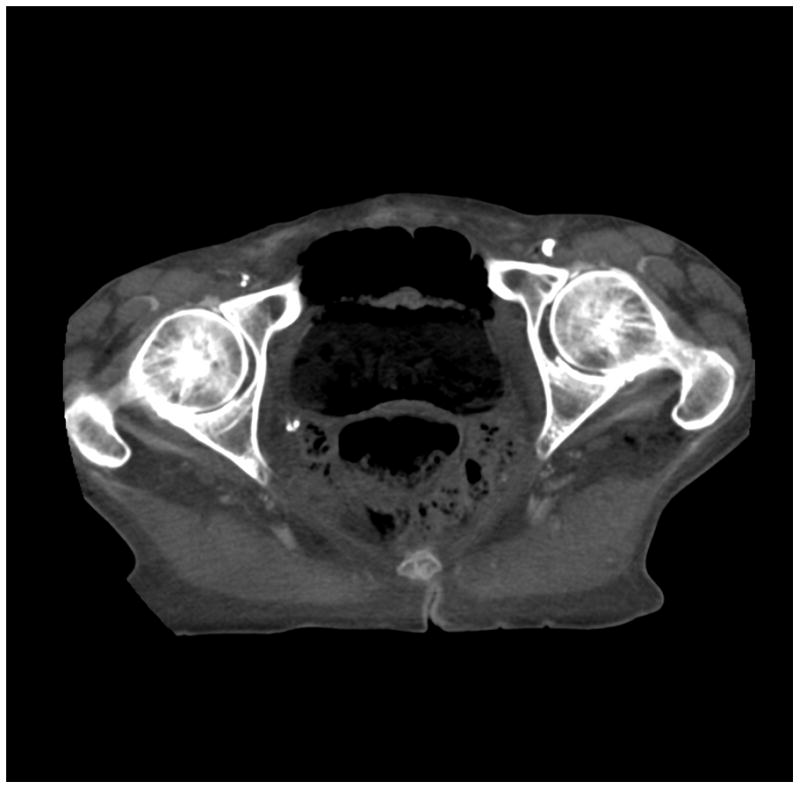
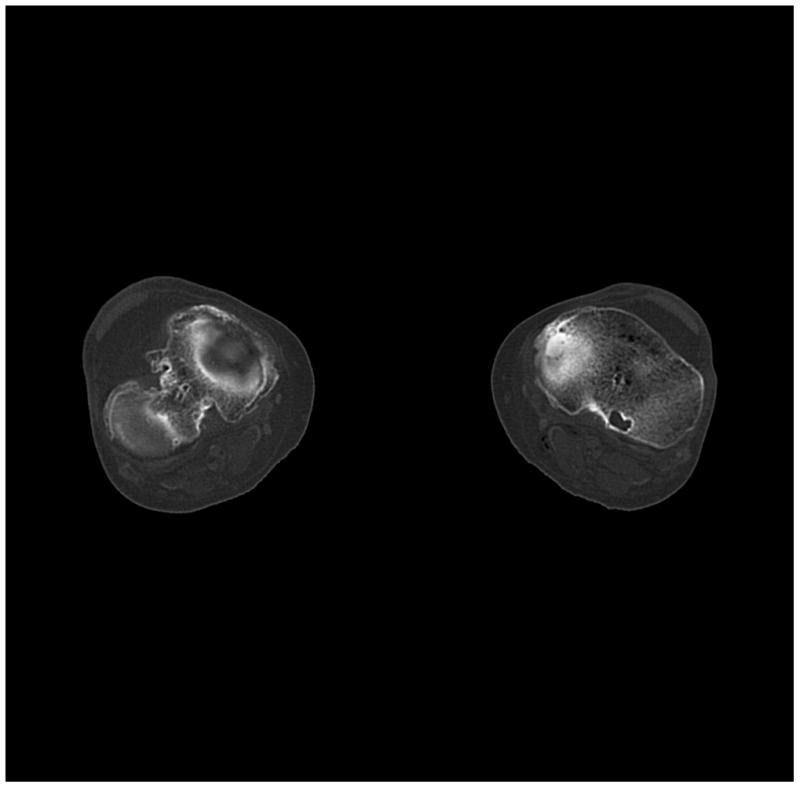
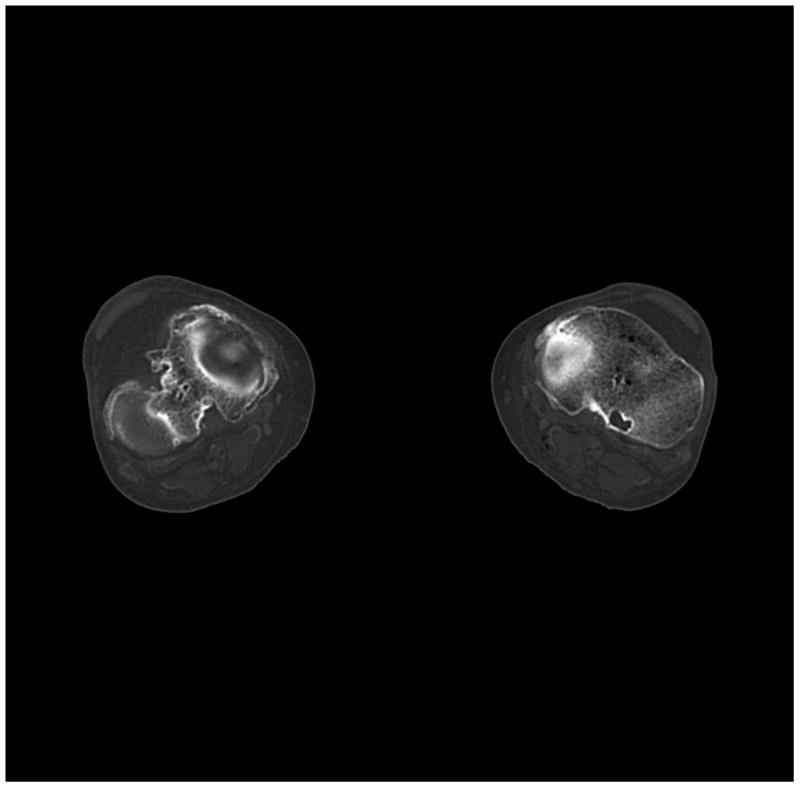
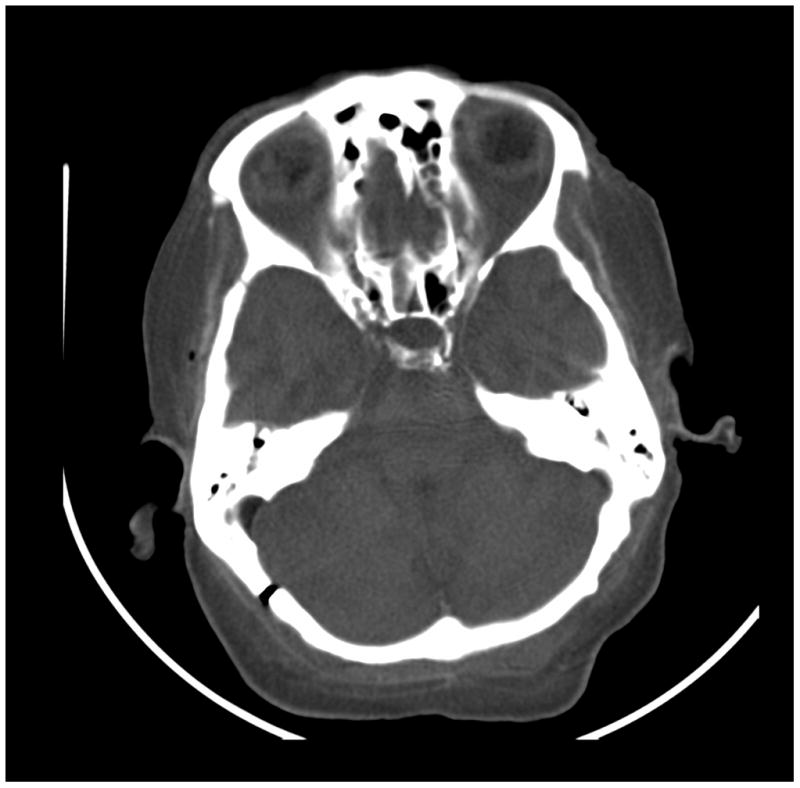
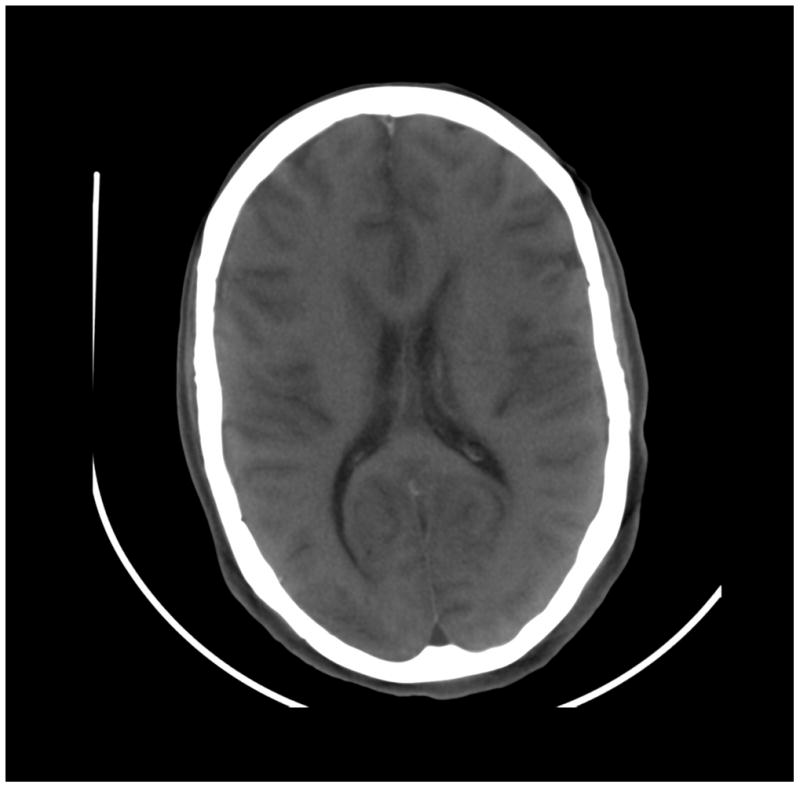
Materials and methods: A research dual-source PCD-CT scanner was used, where the "A" tube/detector subsystem used an EID and the "B" tube/detector subsystem used a PCD. Iodine CNR was measured in 4 anthropomorphic phantoms, simulating 4 patient sizes, at 4 tube potential settings. After biospecimen committee approval, PCD scans were performed on a fresh-frozen human head and a whole-body cadaver using clinical dose rates. Scans were repeated using the EID and identical parameters, and qualitative side-by-side comparisons were performed.

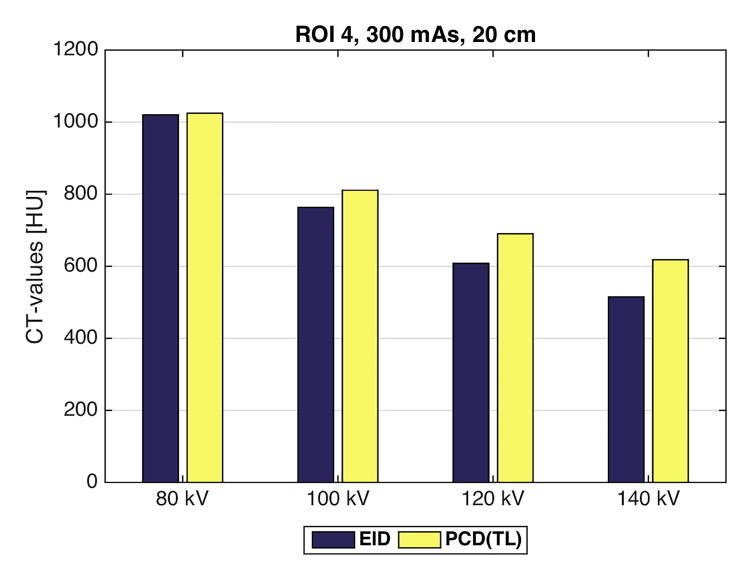
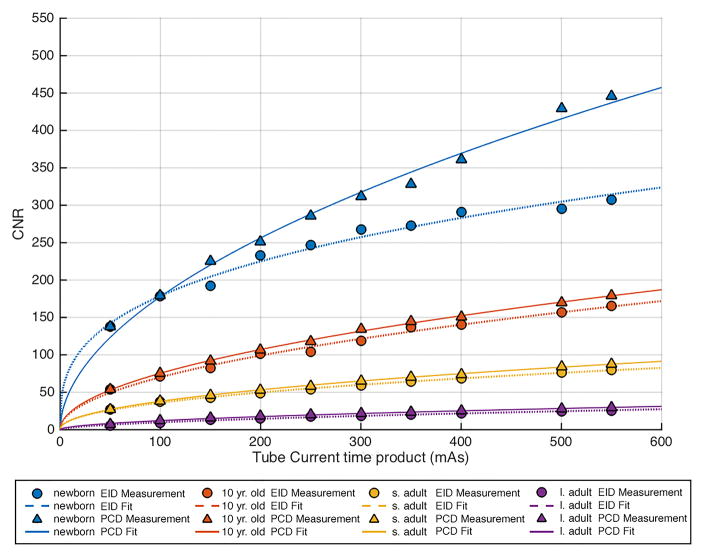
Results: For the same photon fluence, phantom measurements demonstrated a mean increase in CNR of 11%, 23%, 31%, 38% for the PCD system, relative to the EID system, at 80, 100, 120, and 140 kV, respectively. Photon-counting detector CT additionally provided energy-selective imaging, where low- and high-energy images reflected the energy dependence of the iodine signal. Photon-counting detector images of cadaveric anatomy demonstrated decreased beam hardening and calcium blooming in the high-energy bin images and increased contrast in the low-energy bins images relative to the EID images. Threshold-based PCD images were qualitatively deemed equivalent in other aspects.

Conclusions: The evaluated research PCD-CT system was capable of clinical levels of image quality at clinical dose rates. It further provided improved CNR relative to state-of-the-art EID-CT. The energy-selective bin images provide further opportunity for dual-energy and multienergy analyses.


Conflict of interest statement

Conflicts of Interest

No other potential conflicts of interest were declared.

Figures

Figure 1
Figure 1
(a) Experimental setup. Four anthropomorphic phantoms containing four different iodine solutions in each phantom. Each phantom was scanned separately in order to center each phantom at scanner isocenter. (b) In a reference scan (EID system, 140 kV, 200 mAs) the solutions provided CT-numbers of approximately 150 HU in region-of-interest 1(ROI 1), 300 HU in ROI 2, 450 HU in ROI 3, and 600 HU in ROI 4.
Figure 1
Figure 1
(a) Experimental setup. Four anthropomorphic phantoms containing four different iodine solutions in each phantom. Each phantom was scanned separately in order to center each phantom at scanner isocenter. (b) In a reference scan (EID system, 140 kV, 200 mAs) the solutions provided CT-numbers of approximately 150 HU in region-of-interest 1(ROI 1), 300 HU in ROI 2, 450 HU in ROI 3, and 600 HU in ROI 4.
Figure 2
Figure 2
Comparison of the CT numbers measured in region of interest 4 for the energy integrating detector (EID) and the low energy threshold (TL = 25 keV) image from the photon counting detector (PCD) for four tube potentials (80, 100, 120, 140 kV). At 80 kV, the iodine signal is nearly the same for the EID and PCD(TL) images. However, as the tube potential increases, the iodine signal in the PCD(TL) images is increasingly greater than the iodine signal in the EID images. Shown here are the CT-values for the 20 cm phantom at 80, 100, 120, or 140 kV and 300 mAs.
Figure 3
Figure 3
Comparison of image noise versus tube-current-time-product between the energy integrating detector (EID) images and the low energy threshold (TL) images from the photon counting detector (PCD) for the 40 cm (large adult) phantom. The noise was very similar between the two systems, albeit consistently a small amount higher for the EID system. The four curves are for the four tube potential settings (80, 100, 120, 140 kV).
Figure 4
Figure 4
Comparison of contrast to noise ratio (CNR) versus tube-current-time-product (mAs) in each of the 4 phantom sizes between the energy integration detector (EID) images and the low energy threshold (TL) images from the photon counting detector (PCD). (a) 80 kV, (b) 100 kV, (c) 120 kV, (d) 140 kV. The iodine CNR in the PCD(TL) images was consistently greater than the iodine CNR in the EID images. s. adult = small adult, l. adult = large adult.
Figure 4
Figure 4
Comparison of contrast to noise ratio (CNR) versus tube-current-time-product (mAs) in each of the 4 phantom sizes between the energy integration detector (EID) images and the low energy threshold (TL) images from the photon counting detector (PCD). (a) 80 kV, (b) 100 kV, (c) 120 kV, (d) 140 kV. The iodine CNR in the PCD(TL) images was consistently greater than the iodine CNR in the EID images. s. adult = small adult, l. adult = large adult.
Figure 5
Figure 5
CT numbers measured in region of interest (ROI) 4, which contained iodinated contrast media, show an increase in CT numbers in the lower energy Bin 1 (B1) of the photon counting detector (PCD) system and a decrease in the higher energy Bin 2 (B2) of the PCD system relative to the energy integrating (EID) system. Shown here are the CT-values for the 20 cm phantom at 300 mAs.
Figure 6
Figure 6
(a) cerebrum, (b) posterior fossa, (c,d) thorax, (e,f) abdomen, (g,h) pelvis and (i,j) legs of a female human cadaver scanned with the EID (c,e,g,i) and PCD (a,b,d,f,h,j) subsystems. The image quality was deemed to be equivalent between the two subsystems by the radiologist viewers. EID head images were not acquired at the same settings as for the PCD subsystem and are thus not included. Figures 7 and 8 provide EID to PCD comparisons for the head.
Figure 6
Figure 6
(a) cerebrum, (b) posterior fossa, (c,d) thorax, (e,f) abdomen, (g,h) pelvis and (i,j) legs of a female human cadaver scanned with the EID (c,e,g,i) and PCD (a,b,d,f,h,j) subsystems. The image quality was deemed to be equivalent between the two subsystems by the radiologist viewers. EID head images were not acquired at the same settings as for the PCD subsystem and are thus not included. Figures 7 and 8 provide EID to PCD comparisons for the head.
Figure 7
Figure 7
Images of a cadaver head. (a) energy integrating detector (EID) images, (b) photon counting detector (PCD) images (low energy bin), (c) PCD images (high energy bin). The high-energy images of the posterior fossa acquired using the PCD subsystem showed considerably less beam-hardening artifact between the areas of dense bone than the EID image and low energy PCD image. While water beam hardening corrections were applied to the images as part of the normal image reconstruction, 2nd order bone beam hardening corrections were not applied here. This was done to demonstrate that beam-hardening artifacts that normally require algorithmic correction were not present in the uncorrected high-energy PCD image.
Figure 7
Figure 7
Images of a cadaver head. (a) energy integrating detector (EID) images, (b) photon counting detector (PCD) images (low energy bin), (c) PCD images (high energy bin). The high-energy images of the posterior fossa acquired using the PCD subsystem showed considerably less beam-hardening artifact between the areas of dense bone than the EID image and low energy PCD image. While water beam hardening corrections were applied to the images as part of the normal image reconstruction, 2nd order bone beam hardening corrections were not applied here. This was done to demonstrate that beam-hardening artifacts that normally require algorithmic correction were not present in the uncorrected high-energy PCD image.
Figure 8
Figure 8
Images of a cadaver head. (a) energy integrating detector (EID) images, (b) photon counting detector (PCD) images (low energy bin), (c) PCD images (high energy bin). The skull/brain interface was much sharper in the high energy bin PCD image compared to the EID image and low energy bin PCD image.
Figure 8
Figure 8
Images of a cadaver head. (a) energy integrating detector (EID) images, (b) photon counting detector (PCD) images (low energy bin), (c) PCD images (high energy bin). The skull/brain interface was much sharper in the high energy bin PCD image compared to the EID image and low energy bin PCD image.

Similar articles

Cited by

References

    1. McCollough CH, Chen GH, Kalender W, et al. Achieving routine submillisievert CT scanning: report from the summit on management of radiation dose in CT. Radiology. 2012;264(2):567–80. - PMC - PubMed
    1. Taguchi K, Iwanczyk JS. Vision 20/20: Single photon counting x-ray detectors in medical imaging. Med Phys. 2013;40(10):100901. - PMC - PubMed
    1. Roessl E, Proksa R. K-edge imaging in x-ray computed tomography using multi-bin photon counting detectors. Phys Med Biol. 2007;52(15):4679–96. - PubMed
    1. Schmidt TG. Optimal “image-based” weighting for energy-resolved CT. Med Phys. 2009;36(7):3018–27. - PubMed
    1. Iwanczyk JS, Nygård E, Meirav O, et al. Photon counting energy dispersive detector arrays for x-ray imaging. IEEE Trans Nucl Sci. 2009;56(3):535–42. - PMC - PubMed