. 2016;15(3):345-56.
doi: 10.1080/15384101.2015.1121354.

Cellular microenvironment controls the nuclear architecture of breast epithelia through β1-integrin

Affiliations

Cellular microenvironment controls the nuclear architecture of breast epithelia through β1-integrin

Apolinar Maya-Mendoza et al. Cell Cycle. 2016.

Abstract

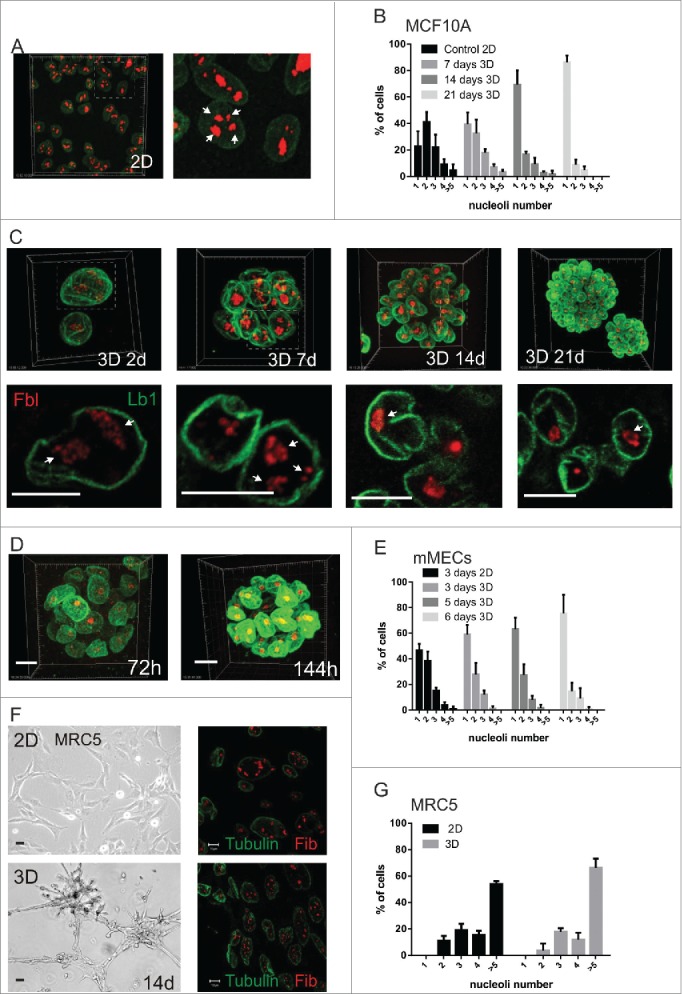
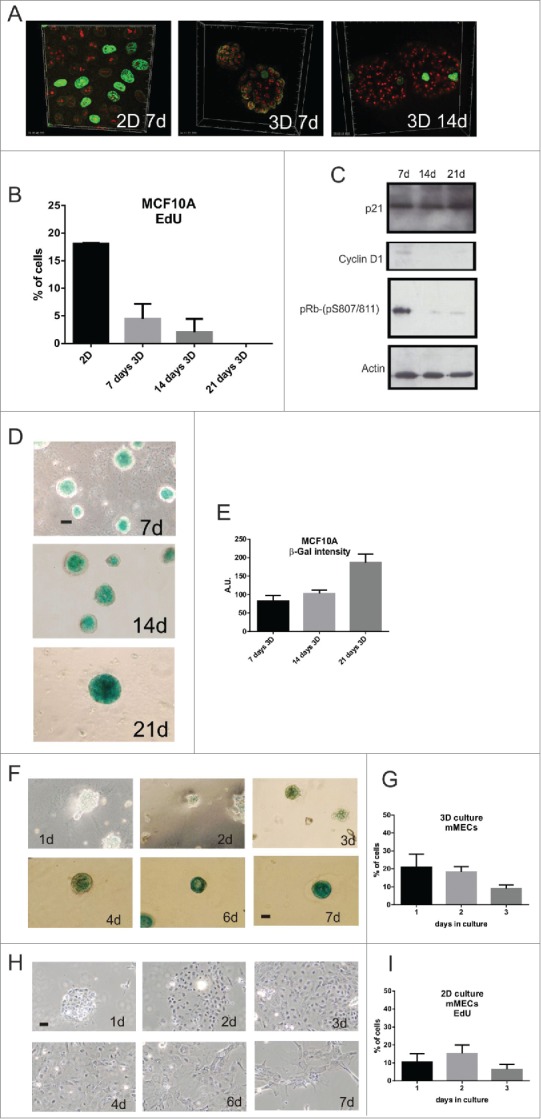
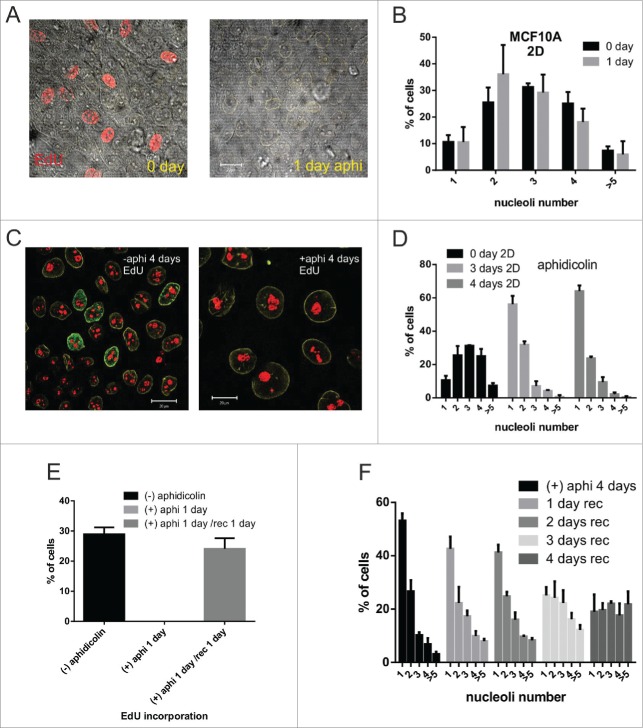
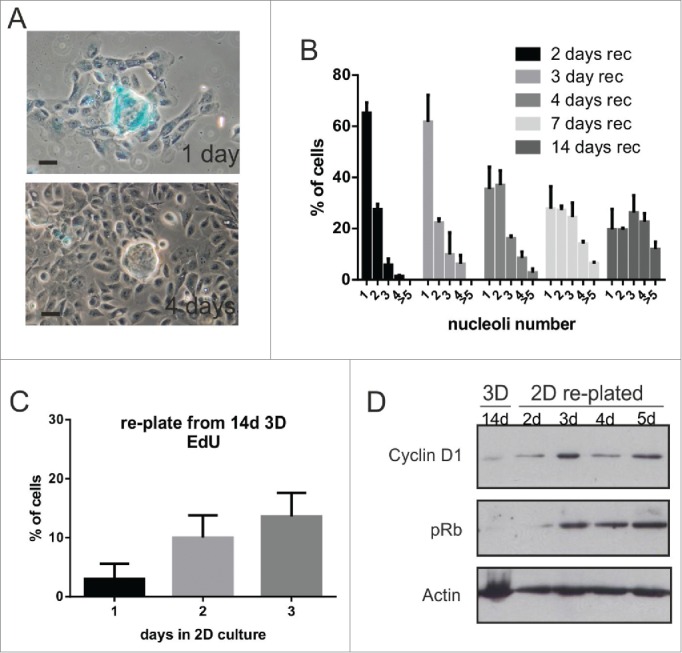
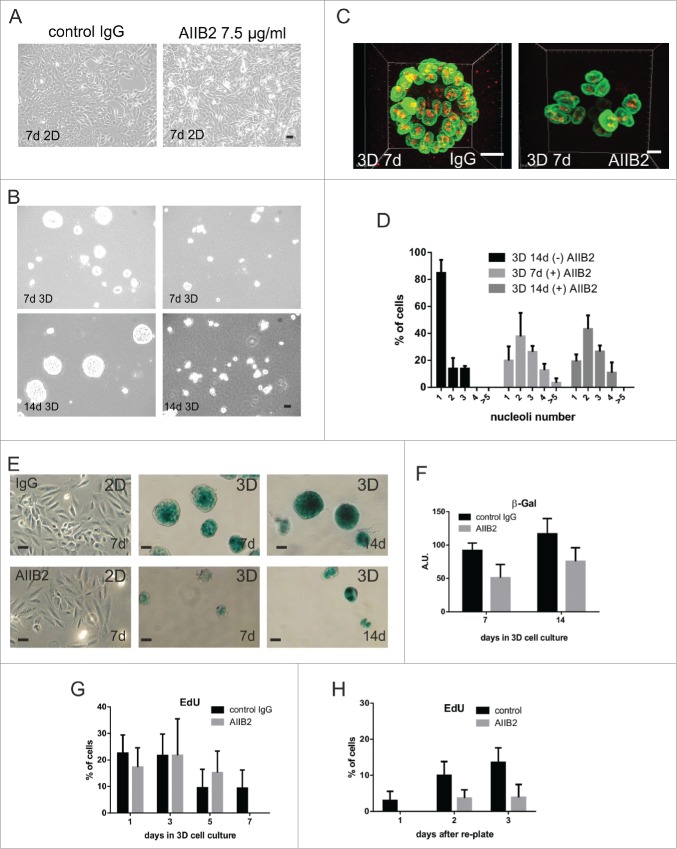
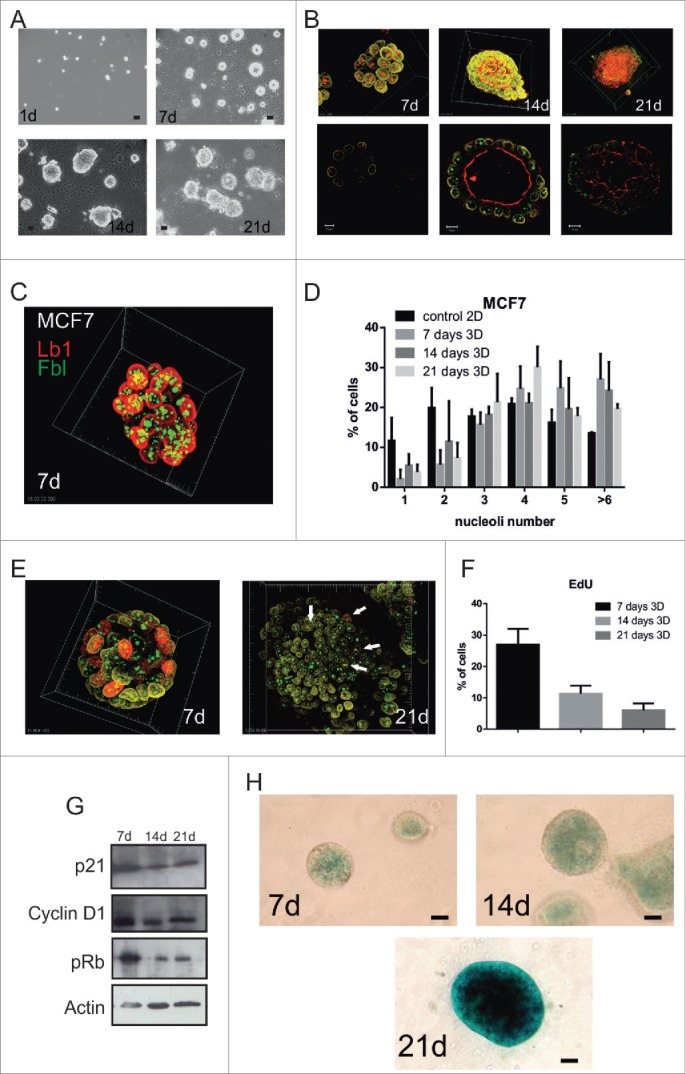
Defects in nuclear architecture occur in a variety of diseases, however the fundamental mechanisms that control the internal structure of nuclei are poorly defined. Here we reveal that the cellular microenvironment has a profound influence on the global internal organization of nuclei in breast epithelia. A 3D microenvironment induces a prolonged but reversible form of cell cycle arrest that features many of the classical markers of cell senescence. This unique form of arrest is dependent on signaling from the external microenvironment through β1-integrins. It is concomitant with alterations in nuclear architecture that characterize the withdrawal from cell proliferation. Unexpectedly, following prolonged cell cycle arrest in 3D, the senescence-like state and associated reprogramming of nuclear architecture are freely reversible on altering the dimensionality of the cellular microenvironment. Breast epithelia can therefore maintain a proliferative plasticity that correlates with nuclear remodelling. However, the changes in nuclear architecture are cell lineage-specific and do not occur in fibroblasts, and moreover they are overcome in breast cancer cells.

Keywords: breast cancer; breast mammary gland; cell cycle; cell senescence; extracellular matrix; integrin; nuclear structure.


Figures

Figure 1.
Figure 1.
Cellular microenvironment dictates the nucleolar complexity of breast epithelia (A-C) MCF10A. Representative low and high power views of cells in 2D (A) and 3D (C) stained with lamin-B1 (green) and fibrillarin (red); upper images are maximum imaging projections and lower images are high magnification views of confocal slices. The areas enlarged are shown by dotted lines and nucleoli indicated by arrows. The percentage of cells containing 1, 2, 3, 4, or >5 nucleoli in planar culture (2D n = 192 nuclei for this representative experiment from at least triplicates); or after 7, 14 and 21-d on 3D culture on LrECM (n = 172, 177, 205 respectively) are shown (B). (D, E) Primary murine MECs were grown in 3D cultures (D) and the percentage of nuclei with 1, 2, 3, 4, or >5 nucleoli determined (E); nucleoli in cells grown in 2D culture were used as a control (2D: 72-h n = 129; 3D: 72-h n = 184, 120-h n = 141, 144-h n = 129). (F, G) MRC5 diploid fibroblasts were cultured in 2D (upper panels) and 3D (lower panels) for 14-d and imaged using phase contrast (left) and confocal (right) microscopy; confocal images show fibrillarin (red) and tubulin (green) staining. While phase contrast images show that cells undergo cellular rearrangements in 3D culture (F), no difference in nucleolar number was seen when cells were grown in 2D and 3D (2D cultures n = 90, 3D cultures n = 188). Scale bars, 50 μm (phase) and10 μm (fluorescence).
Figure 2.
Figure 2.
3D culture induces prolonged cell cycle arrest and expression of senescence markers in breast epithelia (A-E) MCF10A proliferation in 2D and 3D culture was assessed by EdU incorporation (green) and nucleoli labeled with anti-fibrillarin (red). Quantification of EdU-positive cells (2D: n = 210 (at 7d of culture); 3D: 7-d n = 186, 14-d n = 179, 21-d n = 240) showed a gradual decline in proliferation in 3D culture (B; S phase index was 23% at 1-d and 5–7% by 7-d). As cells exited cell cycle, expression of the cell cycle regulators cyclin D1 and p-RB declined (immunoblots shown in C) and the senescence markers p21 (C) and SA-β-gal increased (D, E); (D) shows typical phase contrast images on acini stained for SA-β-gal expression and (E) quantification of the stain (n = 25 acini). (F-I) Primary murine MECs grown in 3D (F) and 2D (H) cultures were stained for SA-β-gal activity. Note that no SA-β-gal was detected in 2D cultures whereas expression was clearly seen after 7 days in 3D culture. Changes in cell proliferation in these cultures was measured by EdU incorporation (30 min) after the indicated number of days in 3D (G) and 2D (I) culture. Scale bars, 50 μm.
Figure 3.
Figure 3.
Cell cycle arrest in 2D culture by aphidicolin treatment (A-F) MCF10A cells treated for 24 h with the DNA polymerase inhibitor aphidicolin (1 μg/ml) for 24 h showed no DNA synthesis as judged by EdU (red) incorporation in 2D cultures (A; phase images together with the red EdU channel are shown). Nucleolar number (B) was unchanged over this time frame (CT n = 239, aphidicolin treated cells n =284), but simplified during longer treatments (C,D; n > 250 cells per time point). 2D-cultures treated with aphidicolin for short periods of time (less than 1   day) recovered proliferative capacity rapidly (cells were pulse labeled for 30min with EdU) once the inhibitor was removed (E; n > 250 cells per sample). Following prolonged (4d) cell cycle arrest, cells grown in fresh medium gradually recovered their normal distribution of nucleoli (F; 4-days with aphidicolin: n = 323; 1-day without aphidicolin: n = 285, 2-days n = 457, 3-days n = 359, and 4-days n = 477). Scale bars, 20 μm; note that after 4 days of aphidicoli-induced cell cycle arrest (C) cells are flattened and enlarged, consistent with a senescent state.
Figure 4.
Figure 4.
Breast epithelia emerge from arrest in response to changes in their local microenvironment (A-D) MCF10A. To alter the cell microenvironment, acini that had been cultured in 3D for 14-d were picked and re-plated in 2D planar culture. The acini, which initially contained SA-β-gal-staining positive cells, spread onto the plastic (A) and SA-β-gal staining declined as cells emerged onto the 2D substratum. Over a period of 4 d following re-plating, cells showed a progressive increase in nucleolar number (B); n > 250 for each time point), and increased their proliferative capacity, as judged by EdU incorporation (C); 24-h after replate: n = 303; 48-h n = 381; 72-h n = 212). These changes correlated with increased expression of the cell cycle regulators cyclin D1 and pRb (D). Note that primary murine MEC acini that expressed SA-β-gal similarly reverted from cell cycle arrest on changing their microenvironment (Janes et al. 2011). Scale bars, 50 μm.
Figure 5.
Figure 5.
β1-integrin blocking antibody prevents nucleolar simplification (A-D) MCF10A cells were cultured in 2D (A) and 3D (B) in the presence or absence of anti-β1-integrin AIIB2 antibody and examined by phase contrast microscopy over 14 days. During this period, AIIB2 had no effect on cells grown in 2D culture, but it prevented the formation of acini in 3D culture, even though very low levels of apoptosis were seen. The disruption of acinus formation was evident when 3D cultures (C) were stained for laminB1 (green) and fibrillarin (red) and this disruption correlated with the loss of nucleolar simplification that was seen in control mature acini (D; CT; n = 176; AIIB2; 7-d n = 98 and 14-d n = 146). Nucleolar numbers in 3D cultures incubated with isotype IgG mimicked those seen in untreated controls whereas cultures treated with AIIB2 had nucleolar profiles similar to cells grown in 2D culture (see Fig. 1B). The maturation of acini treated with isotype control IgG correlated with increased expression of SA-β-gal (E, F), whereas no expression was seen in 2D cultures and much reduced expression was seen in cultures treated with AIIB2 (E, F), implying that the normal function of β1-integrin was necessary to maintain expression of the senescence marker. The proliferative capacity of cells in 3D culture declined (G) as judged by EdU incorporation, whether or not AIIB2 was present. However, mature acini formed under control conditions returned to cycle much more efficiently than AIIB2-treated acini on re-plating into planar cultures (H; images shown in Fig. S6). Scale bars, 10 μm.
Figure 6.
Figure 6.
The ability of the cellular microenvironment to control nuclear architecture is uncoupled in breast cancer cells. (A-H) MCF7 cells grown in 3D cultures on LrECM for up to 21-d formed acinus-like structures as judged by phase contrast (A) and confocal microscopy (B). The nuclear envelope (lamin B1, yellow), the fibrillarin centers (red at 7-d, and green at 14 and 21-d) and lumen formation (phalloidin red at 14-d and 21-d only), are shown in projections (upper panels) and confocal sections (lower panels). Note that phalloidin, which stains f-actin, mainly localizes to the apical cell surface and demarcates the boundary of the lumen. Confocal projections (C) of cells cultured in LrECM and stained for nucleoli (green) and lamin B1 (red) were used to monitor changes in the number of nucleoli over 21 days in 3D culture and compared to 2D planar cultures as controls (D; n > 250 for each time point). Throughout this time course, proliferation in 3D culture was assessed by EdU incorporation (E-F; n > 250 for each time point; arrows indicate example cells in S phase). Note that unlike MCF10A cells, transformed MCF7 cells in 3D culture fail to simplify their nucleoli, maintain proliferative capacity and form highly disordered acini. Correspondingly, the expression of cell cycle regulators (cyclin D1 and pRB) and senescent markers (p21 and SA-b-gal) are only partially altered (G, H). Note that there is almost no SA-β-gal staining at 7-d and 14-d, in comparison with the staining in MCF10A (Fig. 3C), and expression is delayed at 21-d. Scale bars, (A and H) 50 μm, (B) 10 μm in left and middle pictures, 20 μm in right picture.

Comment in

References

    1. Jackson DA. The principles of nuclear structure. Chromosome Res 2003; 11:387-401; PMID:12971716; http://dx.doi.org/ 10.1023/A:1024954123092 - DOI - PubMed
    1. Lamond AI, Spector DL. Nuclear speckles: a model for nuclear organelles. Nat Rev Mol Cell Biol 2003; 4:605-12; PMID:12923522; http://dx.doi.org/ 10.1038/nrm1172 - DOI - PubMed
    1. Handwerger KE, Gall JG. Subnuclear organelles: new insights into form and function. Trends Cell Biol 2006; 16:19-26; PMID:16325406; http://dx.doi.org/ 10.1016/j.tcb.2005.11.005 - DOI - PubMed
    1. Boisvert FM, van Koningsbruggen S, Navascues J, Lamond AI. The multifunctional nucleolus. Nat Rev Mol Cell Biol 2007; 8:574-85; PMID:17519961; http://dx.doi.org/ 10.1038/nrm2184 - DOI - PubMed
    1. Lanctot C, Cheutin T, Cremer M, Cavalli G, Cremer T. Dynamic genome architecture in the nuclear space: regulation of gene expression in three dimensions. Nat Rev Genet 2007; 8:104-15; PMID:17230197; http://dx.doi.org/ 10.1038/nrg2041 - DOI - PubMed

Publication types